Quantitative Assessment of Tumor Responses
after Radiation Therapy in a DLD-1 Colon Cancer Mouse Model Using Serial Dynamic Contrast-Enhanced Magnetic
Resonance Imaging
Sung Jun Ahn,
1Woong Sub Koom,
2Chan Sik An,
1Joon Seok Lim,
1Seung-Koo Lee,
1Jin-Suck Suh,
1and Ho-Taek Song
11Department of Radiology and Research Institute of Radiological Science, 2Department of Radiation Oncology, Yonsei University College of Medicine, Seoul, Korea.
Received: October 6, 2011 Revised: December 8, 2011 Accepted: December 9, 2011
Corresponding author: Dr. Ho-Taek Song, Department of Radiology,
Yonsei University College of Medicine, 50 Yonsei-ro, Seodaemun-gu, Seoul 120-752, Korea.
Tel: 82-2-2228-2370, Fax: 82-2-393-3035 E-mail: [email protected]
∙ The authors have no financial conflicts of interest.
© Copyright:
Yonsei University College of Medicine 2012 This is an Open Access article distributed under the terms of the Creative Commons Attribution Non- Commercial License (http://creativecommons.org/
licenses/by-nc/3.0) which permits unrestricted non- commercial use, distribution, and reproduction in any medium, provided the original work is properly cited.
Purpose: The purpose of this study was to investigate the predictability of pretreat- ment values including Dynamic Contrast-Enhanced Magnetic Resonance Imaging (DCE-MRI) derived parameters (Ktrans, Kep and Ve), early changes in parameters (Ktrans, tumor volume), and heterogeneity (standard deviation of Ktrans) for radiation therapy responses via a human colorectal cancer xenograft model. Materials and Methods: A human colorectal cancer xenograft model with DLD-1 cancer cells was produced in the right hind limbs of five mice. Tumors were irradiated with 3 frac- tions of 3 Gy each for 3 weeks. Baseline and follow up DCE-MRI were performed.
Quantitative parameters (Ktrans, Kep and Ve) were calculated based on the Tofts mod- el. Early changes in Ktrans, standard deviation (SD) of Ktrans, and tumor volume were also calculated. Tumor responses were evaluated based on histology. With a cut-off value of 0.4 for necrotic factor, a comparison between good and poor responses was conducted. Results: The good response group (mice #1 and 2) exhibited higher pre- treatment Ktrans than the poor response group (mice #3, 4, and 5). The good response group tended to show lower pretreatment Kep, higher pretreatment Ve, and larger baseline tumor volume than the poor response group. All the mice in the good re- sponse group demonstrated marked reductions in Ktrans and SD value after the first radiation. All tumors showed increased volume after the first radiation therapy. Con- clusion: The good response after radiation therapy group in the DLD-1 colon cancer xenograft nude mouse model exhibited a higher pretreatment Ktrans and showed an early reduction in Ktrans, demonstrating a more homogenous distribution.
Key Words: Colorectal cancer, radiation therapy, magnetic resonance imaging, permeability, angiogenesis
INTRODUCTION
Colorectal cancer is a frequently diagnosed cancer with high mortality. In patients
tal cancer xenograft model.
MATERIALS AND METHODS
Experimental model
All experiments followed institutional guidelines for the care and use of laboratory animals. A human DLD-1 colon cancer cell suspension (1×10⁶ cells in 100 µL of phosphate buffered saline) was implanted subcutaneously into the right hind limbs of five 5-week-old (SLC, Kotoh-cho, Ja- pan) female nude mouse. Tumors were allowed to grow for approximately 7 to 14 days, until reaching an approximate longest diameter of 1 cm before initiating radiation therapy.
However, there was some degree of variability in volume because the tumors in each mouse did not grow at exactly the same rate.
Irradiations
The mice were anesthetized by intraperitoneal injection of a mixture of Zoletil (40 mg/kg) and Rompun (5 mg/kg) to achieve reproducible prone positioning during treatment.
Irradiations were performed with a linear accelerator (CGR, Paris, France) using a beam of 18-MV photons. The dose rate was 200 cGy/min at a focus-to-skin distance of 127 cm. The hind leg subcutaneously implanted tumor was irradiated while the remainder of the mouse was shielded with 8-cm-thick Arplay Cerro (Arplay, Izeure, France), po- sitioned on top of a 2.5-cm PlexiglasTM (Rohm and Haas company, Philadelphia, PA, USA) plate necessary for elec- tronic equilibrium. Dosimetry in the treatment position was performed using LiF pastilles positioned at the area of tu- mor cell inoculation to indicate accurate dose delivery to the tumor. Each mouse received 3 fractions of 3 Gy each for a total of 21 days at an interval of 7 days. After three cy- cles of irradiations were completed, the nude mice were eu- thanized.
MR examinations
DCE MRI was performed four times for each mouse. The first base line study was performed immediately before ini- tiating radiation therapy. The other three MRIs were per- formed one week after each radiation therapy.
Magnetic resonance imaging was performed using a whole-body 3T MR scanner (MAGNETOM Tim Trio, Sie- mens Healthcare, Erlangen, Germany) and a four-phased ar- ray wrist coil (Siemens Healthcare). The mice were placed with advanced stage, preoperative radiation therapy or pre-
operative concurrent chemo-radiation therapy (CCRT) is frequently administered.1-3 Such therapies are useful for de- creasing rates of recurrence.4 However, there are currently no methods for predicting which tumors will respond to ra- diation therapy.
Tumor vascularity and oxygenation status have long been advocated as important factors that influence tumor respons- es to radiation therapy.5 Dynamic contrast-enhanced mag- netic resonance imaging (DCE-MRI) combined with phar- macokinetic modeling has emerged as a promising noninvasive imaging technique for evaluating tumor micro- vasculature, generating quantitative parameters of microcir- culation based on the two-compartment Tofts model.6,7 Ac- cording to this model, contrast enters the intravascular space (compartment 1), passes into the interstitial space (compart- ment 2), and reenters the intravascular space (compartment 1). During this course, Ktrans represents the rate of which the contrast media passes from the intravascular space to the interstitial space. Kep signifies the rate constant for back dif- fusion of the contrast agent from the interstitial space into the intravascular space. Ve denotes extravascular-extracel- lular leakage space. Several studies have shown that DCE- MRI derived parameters are related to tumor responses to treatment. George, et al.8 showed that responsive tumors had higher pretreatment Ktrans values than non-responsive tumors in colorectal cancer. In addition, Ah-See, et al.9 re- cently reported that early changes in Ktrans are the best pre- dictor for treatment responses to chemotherapy in patients with breast cancer. Meanwhile, Yu, et al.10 showed that ear- ly changes in tumor size are better response predictors than other DCE derived parameters. Furthermore, some studies emphasized the analysis of intratumoral heterogeneity. Ac- cording to one study, standard deviation (SD) of pixel val- ues for Ktrans could allow for improved diagnostic accuracy for distinguishing breast cancer from benign lesions.11 Ac- cordingly, a response group treated for locally advanced breast cancer exhibited significant reductions in SD of en- hancement amplitude, demonstrating a more homogenous distribution after treatment.12 Although the results of several reports have been published, the predictability of DCE-de- rived parameters are still debated and not standardized.
The aim of this study was to investigate the predictability of pretreatment values including DCE-MRI derived param- eters (Ktrans, Kep and Ve), early changes in parameters (Ktrans, tumor volume), and heterogeneity (standard deviation of
Ktrans) for radiation therapy responses via a human colorec-
tumor heterogeneity, such as tumor necrosis. The largest length, width, and height of each tumor were measured from the T2-weighted images. Tumor volume was calculat- ed by the formula of ellipsoid volume as follows:
π/6×L×W×H16
Where L was length, W was width, and H was the height of the tumor, respectively.
To evaluate the changes in the values of Ktrans and tumor volume in the early radiation therapy periods, we defined ratios of Ktrans, volume, and standard deviation as follows:
K1R=K1/K0 V1R=V1/V0 SD1R=SD1/SD0,
Where K0 values were of the 95th percentile of baseline Ktrans, V0 was the pretreatment tumor volume, and SD0 was the standard deviation of Ktrans at baseline. K1, V1, and SD1 were values taken after the first radiation therapy.
Histological analysis
After performing DCE-MRI, the tumor was surgically ex- cised from the right hind limb of the mice under ether anes- thesia. The excised tumor was fixed with 10% formaldehyde solution and sliced in the transverse plane in 6 µm-thick slide sections, corresponding to the MR images. Histologi- cal analysis of the tumor was performed with hematoxylin and eosin staining to identify tumor necrosis and to evalu- ate tumor responses. Histological slides were scanned with a digital virtual microscope (Dotslide, Olympus, Hamburg, Germany). The outer tumor border and tumor necrosis were manually circumscribed using Image J software (NIH, Bethesda, MD, USA). Then the total pixel area of both the whole tumor and the necrotic region was automatically cal- culated. Histological necrotic fraction (NF) was defined by dividing the total pixel area of necrosis by the total pixel area within the tumor border. A “good response” was clas- sified for tumors exhibiting a NF greater than 0.4.17
RESULTS
Serial changes in the 95th percentile values for Ktrans, Kep, Ve, and tumor volume during radiation therapy were sum- marized in Table 1. While tumors with an NF of less than 0.4 were classified as demonstrating a poor response, mouse 3 with an NF of 0.49 was exceptionally classified as demonstrating a poor response, because a separate adjacent tumor had continuously grown after the first radiation ther- prone in a plastic holder and connected to a mask carrying
inhaled anesthetic to restrict movement. The mice were ini- tially anesthetized with 4% isoflurane inhalation, and anes- thesia was maintained with 2% isoflurane in a mixture of 1 L/min of 100% oxygen. The tail vein was cannulated for in- travenous access of MR contrast.
A transverse T2-weighted turbo spin echo sequence [repe- tition time (TR)/echo time (TE), 4930/128 msec; echo train length, 25; one signal acquired; matrix, 114×192] was per- formed with a section thickness of 1.0 mm, with an intersec- tion gap of 0.12 mm and a flip angle of 160°. The field of view was 35×60 mm to cover the tumor completely (20 sec- tions). T1 mapping was obtained using two variable flip an- gle acquisitions. Two precontrast T1 weighted measure- ments (3D VIBE; TR/TE, 8.32/2.29; matrix, 90×128) with different flip angles (2°, 15°) were performed with a section thickness of 1.04 mm (20 sections) and a field of view of 50×50 mm. This was followed by the dynamic contrast en- hanced series using the TWIST sequence (TR/TE, 5.81/2.42;
flip angle, 12°; other parameters were the same as the pre- contrast scan).
For the entire volume of 20 sections, the acquisition time was 6.2 seconds with a single signal acquired. This se- quence was applied continuously for 60 measurements. Af- ter the first five measurements, an intravenous bolus injec- tion of gadopentetate dimeglumine (Magnevist; Schering, Erlangen, Germany) at a concentration of 0.05 mmol/mL was administered manually at a dose of 0.3 mmol/kg over the maximum period of 5 seconds.
On completion of the study, data were transferred to an image processing workstation (Leonardo; Siemens Health- care sector, Erlangen, Germany) and analyzed using Tissue 4D software (Siemens Healthcare sector, Erlangen, Germa- ny). The dynamic data were fitted pixel by pixel to a phar- macokinetic model described by Tofts,7,13 generating the transfer constant value, indicated by the symbol Ktrans (per second).
Image analysis and measurement
Regions of interests were outlined on each MRI. Software generated values for Ktrans, Kep, and Ve in each pixel and color maps for Ktrans pixel values. We selected values in the 95th percentile of distribution for each variable as being repre- sentative of quantitative parameters rather than the maxi- mum, because the former was suggested to reduce motion induced errors, specifically in the periphery of a tumor.14,15 We avoided mean values because they did not reflect the
DISCUSSION
Over the past few years, CCRT or radiation therapy has been increasingly used to treat malignant neoplasms including rec- tal cancer.18 Tumor vascularity and oxygenation status have long been advocated as important factors that influence tu- mor responses to radiation therapy.5 DCE-MRI combined with pharmacokinetic modeling has emerged as a promising noninvasive imaging technique for evaluating tumor micro- vasculature.6 Accordingly, previous studies suggested several DCE-MRI parameters for which to predict responses to radi- ation therapy in rectal cancer as well as other tumors. The most representative DCE-MRI derived parameter is the transfer constant, Ktrans. However, the DCE-MR derived pa- rameter Ktrans is still controversial as a biomarker for which to evaluate radiation therapy. de Vries, et al.19 reported that high initial perfusion index (PI) value correlated with great- er node down staging for radiation therapy in rectal tumor.8 Meanwhile, Sahani, et al.20 reported that initial high blood flow (BF) was negatively correlated with radiation therapy responses. They obtained BF as the representative parame- apy (Fig. 1).
The good response group (mice #1, 2) showed higher pretreatment Ktrans than the poor response group (mice #3, 4, 5). Two of the three mice in the poor response group (mice
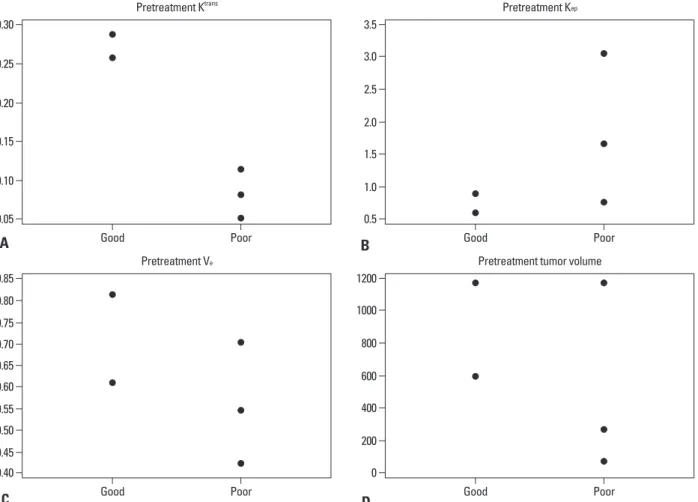
#4, 5) showed higher pretreatment Kep than those in the good response group (3.04, 1.67 vs. 0.89, 0.61). Two of the three mice in the poor response group (mice #3, 4) showed lower pretreatment Ve than those in the good response group (0.55, 0.42 vs. 0.61, 0.81). Two of the three mice in the poor response group (mice #3, 5) showed lower pre- treatment volume than those in the good response group (270, 72 vs. 594, 1183) (Fig. 2). All the mice in the good re- sponse group showed marked reductions in Ktrans and SD value after the first radiation. Two of the three mice (mice
#3, 4) in the poor response group showed increased Ktrans (K1R=1.50, 2.32 for mice #3, 4) and SD value (SD1R=2 for both mice) after the first radiation therapy (Fig. 3). All tu- mors showed increased volume after the first radiation ther- apy. However, two of the three mice in the poor response group (mice #3, 5) showed greater volume increments than those in the good response group (V1R=2.13, 2.78 for #3, 5 vs. 1.73, 1.33 for #1, 2).
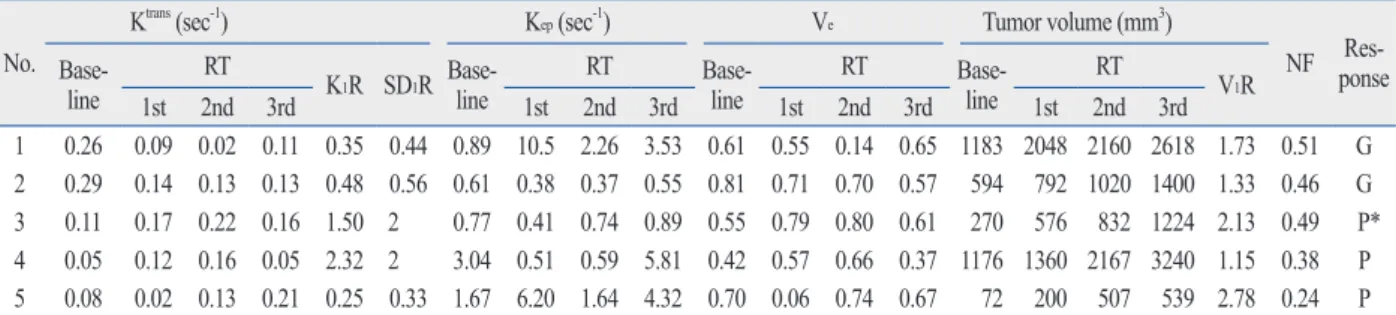
Table 1. Sequential Changes in Quantitative DCE MRI Parameters during the Radiation Therapy No.
Ktrans (sec-1) Kep (sec-1) Ve Tumor volume (mm3)
NF Res-ponse Base-
line RT
K1R SD1R Base-line RT Base-
line RT Base-
line RT
V1R
1st 2nd 3rd 1st 2nd 3rd 1st 2nd 3rd 1st 2nd 3rd
1 0.26 0.09 0.02 0.11 0.35 0.44 0.89 10.5 2.26 3.53 0.61 0.55 0.14 0.65 1183 2048 2160 2618 1.73 0.51 G 2 0.29 0.14 0.13 0.13 0.48 0.56 0.61 0.38 0.37 0.55 0.81 0.71 0.70 0.57 594 792 1020 1400 1.33 0.46 G 3 0.11 0.17 0.22 0.16 1.50 2 0.77 0.41 0.74 0.89 0.55 0.79 0.80 0.61 270 576 832 1224 2.13 0.49 P*
4 0.05 0.12 0.16 0.05 2.32 2 3.04 0.51 0.59 5.81 0.42 0.57 0.66 0.37 1176 1360 2167 3240 1.15 0.38 P 5 0.08 0.02 0.13 0.21 0.25 0.33 1.67 6.20 1.64 4.32 0.70 0.06 0.74 0.67 72 200 507 539 2.78 0.24 P RT, radiation therapy; DCE-MRI, dynamic contrast-enhanced magnetic resonance imaging.
K1R: ratio of Ktrans; SD1R: ratio of the standard deviation of Ktrans; V1R: ratio of the tumor volume after 1st radiation therapy to the baseline value, respectively.
NF (necrosis factor) is defined by dividing the total pixel area of necrosis by the total pixel area within the tumor border.
G: good response, NF>0.4; P: poor response, NF≤4.
*Exceptionally assigned to the poor response group due to adjacent outgrowth of tumor.
Fig. 1. An exceptional case, mouse #3, was assigned to the poor response group although it showed a large area of necrosis (NF=0.49). (A) Serial DCE-MRI with color mapping shows the change in Ktrans. Pretreatment Ktrans showed a relatively low value (0.11). Ktrans increased after the first radiation therapy (K1R=1.51). Red color represents the higher value of Ktrans and blue color represents the lower value. An outgrowing tumor was identified after the first radia- tion therapy (arrow). (B) H&E staining of the newly grown tumor, which separated from the main mass, showed rare necrosis. The original magnification is
×2. The red line indicates the tumor border and the blue line indicates the area of necrosis. NF, necrotic fraction; H&E, hematoxylin and eosin.
Pre 1st 2nd 3rd
A B
utes. Different types of imaging modalities, mathematic models, scan times, and post processing methods might ex- plain the previous inconsistent results. Although our results showed that the responder group had a marked higher Ktrans value at baseline scanning, the results should be carefully interpreted because our sample size was too small and we ter for their model using perfusion CT technique with the
Johnson and Wilson model during 45 seconds of scan time.
While De Vries, et al.19 obtained PI value, which was shown to be associated with contrast extraction fraction as well as with perfusion using T1 dynamic contrast enhanced MRI technique with semi-quantitative analysis over 4 min-
Fig. 2. Comparison of quantitative parameters between the good and the poor response groups upon baseline imaging. (A) Ktrans, (B) Kep, (C) Ve, (D) pretreat- ment tumor volume.
0.05
0.40
0.5
0 0.10
0.50 0.45
1.0
200 0.15
0.60 0.55
1.5
400 2.0
600 0.20
0.65
2.5
800 0.25
0.80 0.75 0.70
3.0
1000 0.30
0.85
3.5
1200 Good
Good
Good
Good Poor
Poor
Poor
Poor Pretreatment Ktrans
Pretreatment Ve
Pretreatment Kep
Pretreatment tumor volume
A
C
B
D
Fig. 3. Comparison of Ktrans between the good and the poor response groups after the 1st radiation therapy. (A) Early changes in Ktrans and (B) early changes in standard deviation for Ktrans (SD). The y-axis represents the ratio of the value after the 1st radiation therapy to the pretreatment value. The horizontal solid line at the ratio of 1 represents no change within the interval.
0.0 0.2
0.5
0.4 0.6
1.0 0.8
1.0
1.5 1.21.4
2.0 1.6
1.8
2.5 2.0
Good Poor Good Poor
Early changes of Ktrans Early change of SD
A B
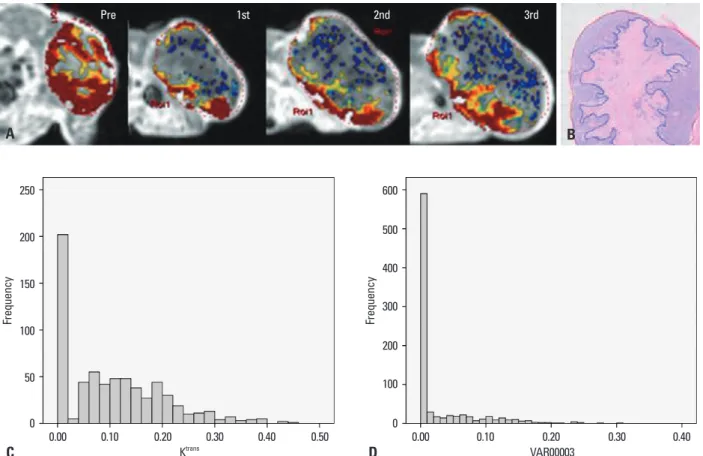
tic accuracy.11 Change in histogram heterogeneity has been reported in patients with rectal cancer after radiation thera- py.27 Changes in tumor size were also previously suggested as a strong predictor of responses.10 In this study, good re- sponders tended to show smaller volume increments than poor responders. However, tumor size change is not a perfect method for assessing the response of a tumor to treatment, as edema and necrosis refrain from measuring the exact tumor burden. For example, although mice #2 showed a good re- sponse and marked reduction in Ktrans, tumor size masked the real tumor burden due to internal necrosis (Fig. 4).
This study has several limitations. First, fractionated dos- es of radiation therapy and intervals between the fractionat- ed doses might not be optimized to suppress endothelial cell proliferation. Second, though CCRT is widely used in the treatment of advanced colorectal cancer, our results were limited to radiation therapy.
In summary, the good response to radiation therapy group in a DLD-1 colon cancer xenograft mouse model exhibited higher pretreatment Ktrans and early reductions in Ktrans. Also, the distribution pattern of Ktrans in the early period of radia- used dynamic contrast enhanced MRI with Tofts two com-
partment model over one minute. Our results might support the hypothesis that the permeable vasculature may provide better oxygenation and showed efficient radiation sensitivi- ty.22 In addition, the good response to treatment group tend- ed to exhibit lower Kep and higher Ve. Some studies report- ed that the initial values of Kep and Ve might predict responses to radiation therapy.23-25 However, their use re- mains highly debated and is not yet wholly established. Al- though Kep also reflects vessel density, perfusion, and per- meability, it proved to be not as sensitive to tumor oxygenation as Ktrans in this study. However, Kep may have been confounded by interstitial volume fraction (Ve) in the necrotic area.7
Early reductions in Ktrans among good responders are in agreement with previous studies,8,26 potentially indicating loss of immature tumor vessels. The good responders also showed early reductions in SD of Ktrans, demonstrating a more homogenous distribution. Distributions of variables, such as SD, add further information for which to distin- guish malignancy from benign disease to improve diagnos-
Fig. 4. A representative case of good response in mouse #2. (A) Serial DCE-MRI with color mapping shows higher pretreatment Ktrans (0.29) and marked reduc- tion in Ktrans after the first radiation therapy (K1R=0.47). (B) H&E staining of the corresponding section in mouse #2. The original magnification is ×2. Necrosis is identified in the center of the tumor. The red line indicates the tumor border and the blue line indicates the area of necrosis. The necrosis factor was 0.46.
Histogram shows the heterogeneous distribution of Ktrans at baseline with an SD of 0.09 (C) and the homogenous distribution of Ktrans with an SD of 0.05 after the first radiation therapy (D). DCE-MRI, dynamic contrast-enhanced magnetic resonance imaging; SD, standard deviation; H&E, hematoxylin and eosin.
Pre 1st 2nd 3rd
A
C
B
D
0 0
50 100
100
200 150
300 400
200 500
250 600
Frequency Frequency
0.00 0.10 0.20 0.30 0.40 0.50 0.00 0.10 0.20 0.30 0.40
Ktrans VAR00003
13. Tofts PS. Modeling tracer kinetics in dynamic Gd-DTPA MR im- aging. J Magn Reson Imaging 1997;7:91-101.
14. Jackson A, O’Connor JP, Parker GJ, Jayson GC. Imaging tumor vascular heterogeneity and angiogenesis using dynamic contrast- enhanced magnetic resonance imaging. Clin Cancer Res 2007;13:
3449-59.
15. Patankar TF, Haroon HA, Mills SJ, Balériaux D, Buckley DL, Parker GJ, et al. Is volume transfer coefficient (K(trans)) related to histologic grade in human gliomas? AJNR Am J Neuroradiol 2005;26:2455-65.
16. Tomayko MM, Reynolds CP. Determination of subcutaneous tu- mor size in athymic (nude) mice. Cancer Chemother Pharmacol 1989;24:148-54.
17. Ahn SJ, An CS, Koom WS, Song HT, Suh JS. Correlations of 3T DCE-MRI quantitative parameters with microvessel density in a human-colorectal-cancer xenograft mouse model. Korean J Radiol 2011;12:722-30.
18. Rich TA, Skibber JM, Ajani JA, Buchholz DJ, Cleary KR, Du- brow RA, et al. Preoperative infusional chemoradiation therapy for stage T3 rectal cancer. Int J Radiat Oncol Biol Phys 1995;32:
1025-9.
19. de Vries A, Griebel J, Kremser C, Judmaier W, Gneiting T, Deb- bage P, et al. Monitoring of tumor microcirculation during frac- tionated radiation therapy in patients with rectal carcinoma: pre- liminary results and implications for therapy. Radiology 2000;
217:385-91.
20. Sahani DV, Kalva SP, Hamberg LM, Hahn PF, Willett CG, Saini S, et al. Assessing tumor perfusion and treatment response in rec- tal cancer with multisection CT: initial observations. Radiology 2005;234:785-92.
21. Choi S, Liu H, Shin TB, Lee JH, Yoon SK, Oh JY, et al. Perfusion imaging of the brain using Z-score and dynamic images obtained by subtracting images from before and after contrast injection.
Korean J Radiol 2004;5:143-8.
22. Cooper RA, Carrington BM, Loncaster JA, Todd SM, Davidson SE, Logue JP, et al. Tumour oxygenation levels correlate with dy- namic contrast-enhanced magnetic resonance imaging parameters in carcinoma of the cervix. Radiother Oncol 2000;57:53-9.
23. Loncaster JA, Carrington BM, Sykes JR, Jones AP, Todd SM, Cooper R, et al. Prediction of radiotherapy outcome using dynam- ic contrast enhanced MRI of carcinoma of the cervix. Int J Radiat Oncol Biol Phys 2002;54:759-67.
24. Hawighorst H, Knopp MV, Debus J, Hoffmann U, Grandy M, Griebel J, et al. Pharmacokinetic MRI for assessment of malignant glioma response to stereotactic radiotherapy: initial results. J Magn Reson Imaging 1998;8:783-8.
25. Pickles MD, Lowry M, Manton DJ, Gibbs P, Turnbull LW. Role of dynamic contrast enhanced MRI in monitoring early response of locally advanced breast cancer to neoadjuvant chemotherapy.
Breast Cancer Res Treat 2005;91:1-10.
26. Hayes C, Padhani AR, Leach MO. Assessing changes in tumour vascular function using dynamic contrast-enhanced magnetic res- onance imaging. NMR Biomed 2002;15:154-63.
27. de Lussanet QG, Backes WH, Griffioen AW, Padhani AR, Baeten CI, van Baardwijk A, et al. Dynamic contrast-enhanced magnetic resonance imaging of radiation therapy-induced microcirculation changes in rectal cancer. Int J Radiat Oncol Biol Phys 2005;63:
1309-15.
tion therapy became more homogenous.
ACKNOWLEDGEMENTS
This study was supported by a grant from the Korean Health Technology R&D Project, Ministry of Health & Welfare, Re- public of Korea (A110035). We would also like to acknowl- edge Siemens Healthcare Korea for their technical support as part of a cooperative research and development agreement.
REFERENCES
1. Lindmark G, Gerdin B, Påhlman L, Bergström R, Glimelius B.
Prognostic predictors in colorectal cancer. Dis Colon Rectum 1994;37:1219-27.
2. Marsh PJ, James RD, Schofield PF. Adjuvant preoperative radio- therapy for locally advanced rectal carcinoma. Results of a pro- spective, randomized trial. Dis Colon Rectum 1994;37:1205-14.
3. Sauer R, Becker H, Hohenberger W, Rödel C, Wittekind C, Fiet- kau R, et al. Preoperative versus postoperative chemoradiotherapy for rectal cancer. N Engl J Med 2004;351:1731-40.
4. Påhlman L, Glimelius B. The value of adjuvant radio(chemo)ther- apy for rectal cancer. Eur J Cancer 1995;31A:1347-50.
5. Harrison LB, Chadha M, Hill RJ, Hu K, Shasha D. Impact of tu- mor hypoxia and anemia on radiation therapy outcomes. Oncolo- gist 2002;7:492-508.
6. McDonald DM, Choyke PL. Imaging of angiogenesis: from mi- croscope to clinic. Nat Med 2003;9:713-25.
7. Tofts PS, Brix G, Buckley DL, Evelhoch JL, Henderson E, Knopp MV, et al. Estimating kinetic parameters from dynamic contrast- enhanced T(1)-weighted MRI of a diffusable tracer: standardized quantities and symbols. J Magn Reson Imaging 1999;10:223-32.
8. George ML, Dzik-Jurasz AS, Padhani AR, Brown G, Tait DM, Eccles SA, et al. Non-invasive methods of assessing angiogenesis and their value in predicting response to treatment in colorectal cancer. Br J Surg 2001;88:1628-36.
9. Ah-See ML, Makris A, Taylor NJ, Harrison M, Richman PI, Bur- combe RJ, et al. Early changes in functional dynamic magnetic resonance imaging predict for pathologic response to neoadjuvant chemotherapy in primary breast cancer. Clin Cancer Res 2008;
14:6580-9.
10. Yu HJ, Chen JH, Mehta RS, Nalcioglu O, Su MY. MRI measure- ments of tumor size and pharmacokinetic parameters as early pre- dictors of response in breast cancer patients undergoing neoadju- vant anthracycline chemotherapy. J Magn Reson Imaging 2007;
26:615-23.
11. Issa B, Buckley DL, Turnbull LW. Heterogeneity analysis of Gd- DTPA uptake: improvement in breast lesion differentiation. J Comput Assist Tomogr 1999;23:615-21.
12. Chang YC, Huang CS, Liu YJ, Chen JH, Lu YS, Tseng WY. An- giogenic response of locally advanced breast cancer to neoadju- vant chemotherapy evaluated with parametric histogram from dy- namic contrast-enhanced MRI. Phys Med Biol 2004;49:3593-602.