INTRODUCTION
For the past twenty years, there have been significant improve-
ments in the treatment of rectal cancer to overcome the high lo- co-regional recurrence rate. With the recognition of the fact that the incomplete removal of the primary tumor is a major cause of
J Korean Soc Radiol 2014;70(2):123-132 http://dx.doi.org/10.3348/jksr.2014.70.2.123
Received October 31, 2013; Accepted December 29, 2013 Corresponding author: Young Hoon Kim, MD Department of Radiology, Seoul National University Bundang Hospital, Seoul National University College of Medicine, 82 Gumi-ro 173beon-gil, Bundang-gu, Seongnam 463-707, Korea.
Tel. 82-31-787-7714 Fax. 82-31-787-4011 E-mail: [email protected]
This is an Open Access article distributed under the terms of the Creative Commons Attribution Non-Commercial License (http://creativecommons.org/licenses/by-nc/3.0) which permits unrestricted non-commercial use, distri- bution, and reproduction in any medium, provided the original work is properly cited.
This study was supported by grant No. 02-2012-050 from Seoul National University Bundang Hospital.
Purpose: To measure the diagnostic accuracy of computed tomography (CT) and magnetic resonance imaging (MRI) obtained after neoadjuvant chemoradiotherapy (CRT) in patients with rectal cancer for a prediction of the local tumor stage and circumferential resection margin (CRM).
Materials and Methods: Two independent radiologists reviewed CT and MRI ob- tained after neoadjuvant CRT. The accuracy of the local tumor staging and the diag- nostic performance for the prediction of CRM involvement were calculated. The agree- ment between the measurements of the distance to potential CRM on both imaging modalities and the histopathology findings was assessed using Bland-Altman plots.
Results: 57 patients (mean age, 59.2 years; 24 females) were included. The accuracy of T and N staging were 43.9% (95% confidence interval, 30.8–57.7%) and 77.2% (64.2–
87.3%) on CT and 63.2% (49.4–75.6%) and 77.2% (64.2–87.3%) on MRI for Observer 1.
The accuracy of T and N staging were 54.4% (40.7–67.7%) and 77.2% (64.2–87.3%) on CT and 68.4% (54.7–80.1%) and 80.7% (68.1–90.0%) on MRI for Observer 2. Sensitivity and specificity on CRM involvement were 83.3% (43.7–97.0%) and 88.2% (76.6–94.5%) on CT and 100% (61.0–100%) and 90.2% (79.0–95.7%) on MRI for Observer 1. Sensitivi- ty and specificity on CRM involvement were 66.7% (30.0–90.3%) and 88.2% (76.7–
94.5%) on CT and 100% (61.0–100%) and 90.2% (79.0–95.7%) on MRI for Observer 2.
Bland-Altman plots showed wide discrepancies between measurements of the distance to CRM on each CT and MRI and those on histopathology findings.
Conclusion: CT and MRI showed limited performance in predicting the local tumor staging and CRM involvement in patients with neoadjuvant CRT although MRI tended to show a better performance than CT.
Index terms Rectal Neoplasms
Multidetector Computed Tomography Magnetic Resonance Imaging Sensitivity and Specificity Chemoradiotherapy
Diagnostic Accuracy of Computed Tomography and Magnetic Resonance Imaging Obtained after Neoadjuvant
Chemoradiotherapy in Predicting the Local Tumor Stage and Circumferential Resection Margin Status of Rectal Cancer
1직장암으로 수술 전 방사선 항암요법을 받은 환자에서 종양 병기와 수술 절제면 종양 침범 여부 예측에 대한 전산화단층촬영 및 자기공명영상의 진단 정확도에 관한 연구1
Ji Hoon Park, MD
1, Young Hoon Kim, MD
1, Sang Min Lee, MD
2, Yoon Jin Lee, MD
1, Kyoung Ho Lee, MD
1, Sung Bum Kang, MD
3, Duck-Woo Kim, MD
3, Jee Hyun Kim, MD
4, Jae-Sung Kim, MD
5, Hye Seung Lee, MD
61Department of Radiology, Seoul National University Bundang Hospital, Seoul National University College of Medicine, Seongnam, Korea
2Department of Radiology, Seoul National University Hospital, Seoul, Korea
Departments of 3Surgery, 4Internal Medicine, 5Radiation Oncology, 6Pathology, Seoul National University Bundang Hospital, Seongnam, Korea
CRT; 3) available CT and MRI obtained after neoadjuvant CRT;
4) TME with complete pathological evaluation. The electronic database in the surgery department was searched to identify con- secutive patients who underwent surgery for rectal cancer (n = 339). After the review of medical records 269 patients who did not undergo neoadjuvant CRT were excluded. Other patients were excluded because one patient underwent a local excision and 12 patients had no MRI after neoadjuvant CRT.
Clinical Staging, Neoadjuvant CRT and Surgery
Digital rectal examinations, abdominopelvic CT and pelvic MRI with or without endorectal ultrasonography were performed for the clinical staging. Patients with rectal cancer and with tu- mors located within 10 cm of the anal verge were eligible for an inclusion in the neoadjuvant CRT. Patients with a previous or secondary malignancy, with pregnancy a previous large bowel surgery, chemotherapy or with radiotherapy of the pelvis were excluded for the neoadjuvant CRT. Radiation of 45 Gy/25 frac- tions was delivered to the pelvis, followed by a 5.4 Gy/3 fractions boost to the primary tumor over 6 weeks using linear accelera- tors with energy of 6 and 15 MV. During the radiation therapy, chemotherapy was performed with one of the following chemo- therapy regimens: 1) continuous capecitabine (825 mg/m2, two times per day) during the radiation therapy course for 6 weeks (n = 41) or 2) an intravenous bolus injection of 5-fluorouracil (390 mg/m2) plus leucovorin (20 mg/m2) for 3 days in the first and fifth week of radiation (n = 160). About 6 weeks after com- pletion of the neoadjuvant CRT all patients underwent TME, including low anterior resection (n = 54) and abdominoperineal resection (n = 3).
Imaging Schedule
Both, the contrast-enhanced CT and the MRI were performed after the neoadjuvant CRT. The imaging studies were generally scheduled four weeks after the completion of the neoadjuvant CRT to evaluate tumor response and treatment related compli- cations. The surgery was performed two weeks after the imaging studies.
Imaging Technique
All contrast-enhanced abdominopelvic CT examinations were performed using 16-detector-row CT scanners (Brilliance; Phil- local recurrence, the total mesorectal excision (TME) has been rec-
ommended as the standard surgical practice for rectal cancer. It in- dicates the resection of the tumor-bearing rectum as well as the re- section of the surrounding mesorectum by dissection along the investing mesorectal fascia (1, 2). Because the tumor involvement of the circumferential resection margin (CRM) is known to be strong- ly associated with the high local recurrence rate (1), the preopera- tive prediction of CRM involvement is important not only to decide the treatment strategy but also to predict the prognosis. With the evidence of severe randomized controlled trials (3, 4), the neoadju- vant chemoradiotherapy (CRT) has been accepted also as standard treatment in cases of locally advanced rectal cancer to ensure the eradication of extramural infiltrating tumors and a clear CRM.
Magnetic resonance imaging (MRI) has been accepted as a key imaging modality for the initial evaluation of rectal cancer before neoadjuvant CRT. Several studies have been published to assess a diagnostic performance of MRI in patients who under- went neoadjuvant CRT (5-10). Although MRI has the superiori- ty regarding the tissue contrast, CT has several advantages over MRI in terms of quick whole-body reviews for the distant metas- tasis as well as a lower cost factor and a wider accessibility. How- ever, there is still a dearth of knowledge about the CT in terms of local tumor evaluation especially on the CRM.
In this study, we aimed to measure the diagnostic accuracy of CT and MRI which were obtained after neoadjuvant CRT in the prediction of the local tumor stage and the CRM status of rectal cancer by using histopathology as the standard reference.
MATERIALS AND METHODS
Study Design and Setting
This retrospective study was carried out for patients who ini- tially had a tumor stage T3 or greater or N positive rectal cancer and underwent a neoadjuvant CRT with subsequent TME. The study subjects were recruited from a 900-bed tertiary hospital between April 2004 and March 2007. The Institutional Review Board of our institution approved this study, and the need for an informed consent form was waived.
Patient Selection
Inclusion criteria were as follows: 1) rectal cancer (≥ cT3 or lymph node involvement) at initial presentation; 2) neoadjuvant
chrome 3-megapixel monitors (ME315; Totoku, Tokyo, Japan).
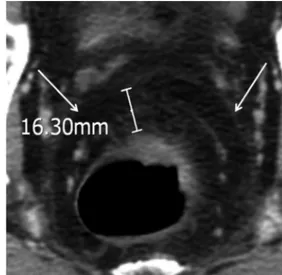
Two reading sessions for CT and MRI were held with an in- terval of four weeks. During the interpretation, CT and MRI ob- tained before neoadjuvant CRT were also reviewed to refer the initial tumor extent, respectively. They were requested to record T and N stages using the TNM system (12). Because the differ- entiation between T1 and T2 tumors is known to be virtually impossible on both CT and MRI (13), they were classified into T1/T2 group. A regional node was considered positive if the maximum short axis length was more than 5 mm (14). The dis- tance between the tumor and the potential CRM was measured as the shortest distance (in millimeters) from the outermost part of the tumor to the adjacent mesorectal fascia at the level of the maximum depth of penetration through the rectal wall on trans- verse images (Fig. 1). The mesorectal fasicia was defined as a lin- ear structure surrounding the mesorectum that shows soft tis- sue-density on CT and hypo-intensity on T2-weighted MRI. In cases of low rectal cancer where the mesorectal fascia didn’t ex- tend, the distance was measured from the tumor to the leavator ani muscle. For MRI, the measurement was conducted on T2- weighted images (Fig. 2). Only the solid portion of the tumor was considered to be a tumor margin, but the fine spiculate bor- der was not applied in the measurement. When a local tumor stage was considered to be T1/T2, the shortest distance to the potential CRM was measured from the bowel wall at the level ips Medical Systems, Cleveland, OH, USA). Intravenous non-
ionic contrast material (2 mL/kg; iopromide, Ultravist 370; Scher- ing, Berlin, Germany) was administered at a rate of 3 mL/s. Bolus tracking software was used to trigger scanning 60 seconds after the aortic enhancement reached a 150 Hounsfield unit thresh- old. Raw projection data were obtained using the following scanning parameters: scan range, from the diaphragm to upper thigh; detector collimation, 1.5 mm; gantry rotation time, 0.5 seconds; tube potential, 120 kVp; and pitch, 1.17 to 1.25. Effec- tive mAs ranged between 124 and 185 using an automatic tube current modulation technique (Dose-Right, Philips Medical Sys- tems). From the raw data, transverse images were reconstructed:
4 mm thick at 3 mm increments with matrix size of 512 × 512 pixels and field of view of 260–369 mm.
MRI was performed with a 1.5-T system (GyroscanIntera; Phil- ips Medical Systems, Amsterdam, the Netherlands) by using a pelvic phased-array coil. Two-dimensional T1-weighted and T2- weighted fast spin-echo sequences were performed. All sequences were performed in the transverse, coronal and sagittal planes. The transverse planes were angled perpendicular to the long axis of the tumor by using the sagittal plane (11). The imaging parame- ters for the T1-weighted sequences were a 15 cm field of view, a 4 mm section thickness, a 1 mm intersection gap, 500–582/9.5–13 (repetition time ms/echo time, msec), a 240 × 512 matrix, echo- train length of 4, 3 signals acquired, 90° flip angle, and no fat satu- ration. The imaging parameters for the T2-weighted sequences were a 15 cm field of view, a 4 mm section thickness, a 1 mm in- tersection gap, 4200–6069/100–120 (repetition time ms/echo time, msec), a 224 × 512 matrix, echo-train length of 16, 3–4 sig- nals acquired, 90° flip angle, and no fat saturation.
Image Analysis
Two board-certified radiologists (Y.H.K. and K.H.L. with 11 and 10 years of experience in gastrointestinal imaging including pelvic MRI, respectively) were recruited for the independent re- view of CT and MRI obtained after neoadjuvant CRT. They were aware that the patients had T3 or greater or N positive rec- tal cancer and that the patients received neoadjuvant CRT. The radiologist were blind to the clinical and surgical findings as well as to the histopathology results. All interpretations were con- ducted on a diagnostic workstation (DS3000, Impax version 4.5;
Agfa HealthCare, Mortsel, Belgium) and flat-panel mono-
Fig. 1. CT image of a 51-year-old male with T3 rectal cancer and clear circumferencial resection margin. The mesorectal fascia is shown as a linear soft tissue-density structure surrounding the mesorectum (ar- rows). The distance was measured as the shortest distance from the outermost part of the tumor to the adjacent mesorectal fascia at the level of the maximum depth of penetration through the rectal wall.
MRI by weighted kappa statistics.
Sensitivity, specificity, positive predictive value, negative pre- dictive value and accuracy of MRI and CT for the prediction of CRM involvement were obtained and compared with each oth- er using McNemar’s test and chi-square test. Cases with the dis- tance to CRM less than or equal to 2 mm were categorized as the involved CRM in both the radiologic and histopathology ex- aminations (18). Inter-observer agreements in predicting the in- volvement of CRM on both CT and MRI were assessed using weighted kappa statistics. The agreement between measure- ments for the distance to CRM on both imaging modalities and those on histopathology was assessed with Bland-Altman plots.
In the interpretation of agreement statistics, degrees of agree- ment were categorized as follows: κ of 0–0.2, slight agreement; κ of 0.2–0.4, fair agreement; κ of 0.4–0.6, moderate agreement; κ of 0.6–0.8, good agreement; and κ of 0.8–1.0, very good agree- ment (19). p values less than 0.05 were considered statistically significant. All statistical analyses were performed using Med- Calc, version 11.6.1 (MedCalc Software, Mariakerke, Belgium).
RESULTS
The study included 57 patients (mean age, 59.2 years; age range, 35–82 years). There were 33 male (mean age, 59.6 years; age range 41–82 years) and 24 female patients (mean age, 58.7 years;
age range, 35–78 years). All patients underwent 5-fluorouracil based chemotherapy (either oral or intravenous) and 54 patients underwent low anterior resections. 52 patients had cT3 cancers, and 35 patients had malignant lymph nodes. Twenty patients had an involved CRM on the MRI which was obtained before the neoadjuvant CRT. Post-CRT pathologic staging and CRM status are summarized in Table 1. The median time interval between the end of neoadjuvant CRT and imaging studies was 30 days [inter- quartile range (IQR), 29–33 days] for both CT and MRI, and the median time interval between the imaging studies and surgery was 14 days (IQR, 13–19 days) for both CT and MRI.
Local Tumor Stage
Accuracies of T and N stages on CT and MRI after neoadju- vant CRT were shown on Table 2. For T stage, the accuracy of MRI was significantly higher than that of CT in both observers (63.2% vs. 43.9%, p = 0.003, for Observer 1; 68.4% vs. 54.4%, p = and site of the tumor. In cases of the tumor invading the meso-
rectal fascia and leavator ani muscle or other adjacent organs, the distance was zero. When an enlarged lymph node or extramural tumor deposit was located closer to the potential CRM than to the primary tumor, this was used to measure the distance to the CRM (15, 16).
Reference Standard
Histopathologic evaluation of the surgical specimen was per- formed by one gastrointestinal pathologist (H.S.L. with nine years of experience in gastrointestinal pathology) using the method of Quirke et al. (17). After surgery, the specimens were inked to the circumferential resection plane and then fixed in formalin for 24 hours. During the histopathology examination, the local tu- mor stage was evaluated according to TNM system proposed by the American Joint Committee on Cancer Staging 6th edition (12). The shortest distance between the outmost margin of the tumor and CRM was measured also (17). The histopathology re- sults for the local tumor stage and the distance to CRM served as the reference standard.
Statistical Analysis
The accuracy of T and N stage on CT and MRI were obtained and compared with each other using the McNemar’s test. Cases of underestimation and overestimation were counted. The inter- observer agreement for T and N stages was obtained on CT and
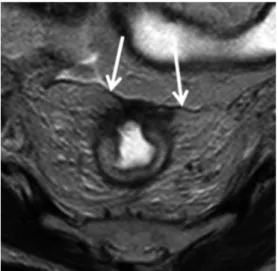
Fig. 2. MR image of a 59-year-old female with T3 rectal cancer and involved circumferential resection margin. The mesorectal fascia is shown as a hypo-intense linear structure (arrows). The distance from tumor to mesorectal fascia was 0 mm, and it was 1 mm on histopa- thology.
0.008 for Observer 2). On both CT and MRI, there was a tenden- cy to overestimate the T stage for both observers. For N stage, the difference of accuracy was not significant between CT and MRI in both observers (77.2% vs. 77.2%, p = 1.00 for Observer 1;
77.2% vs. 80.7%, p = 0.50 for Observer 2). On both CT and MRI, there was a tendency to underestimate the N stage for both ob- servers.
Inter-observer agreements for T stage were good on both CT [weighted κ: 0.69, 95% confidence interval (CI): 0.49 to 0.89]
and MRI (weighted κ: 0.74, 95% CI: 0.57 to 0.91). Inter-observer agreements for N stage were very good on both CT (weighted κ:
0.88, 95% CI: 0.72 to 1.0) and MRI (weighted κ: 0.88, 95% CI:
0.72 to 1.0).
Prediction of CRM Status
An involved CRM was shown in the histopathology of six pa- tients. Both observers identified the potential CRM on CT and MRI in all cases. Diagnostic performances of CT and MRI in predicting CRM involvement were summarized on Table 3. Al- though a statistically significant difference was not observed, MRI tended to show a better performance than CT. For Observ- er 1, there was one and zero false negative prediction for CRM involvement on CT and MRI, respectively and also six and five false positive predictions on CT and MRI, respectively. For Ob- server 2, there were two and zero false negative predictions on CT and MRI, respectively and also six and five false positive predictions on CT and MRI, respectively. The inter-observer agreement in the prediction of tumor involvement of CRM on CT was very good (weighted κ: 0.94, 95% CI: 0.83 to 1.0) and was coincident on MRI (weighted κ: 1.0, 95% CI: 1.0 to 1.0).
Four of the 57 patients with complete tumor regression were
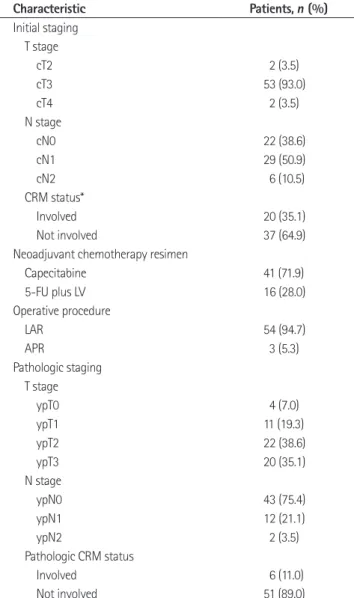
Table 1. Characteristics of the Patients
Characteristic Patients, n (%)
Initial staging T stage
cT2 2 (3.5)
cT3 53 (93.0)
cT4 2 (3.5)
N stage
cN0 22 (38.6)
cN1 29 (50.9)
cN2 6 (10.5)
CRM status*
Involved 20 (35.1)
Not involved 37 (64.9)
Neoadjuvant chemotherapy resimen
Capecitabine 41 (71.9)
5-FU plus LV 16 (28.0)
Operative procedure
LAR 54 (94.7)
APR 3 (5.3)
Pathologic staging T stage
ypT0 4 (7.0)
ypT1 11 (19.3)
ypT2 22 (38.6)
ypT3 20 (35.1)
N stage
ypN0 43 (75.4)
ypN1 12 (21.1)
ypN2 2 (3.5)
Pathologic CRM status
Involved 6 (11.0)
Not involved 51 (89.0)
Note.-*Determined on MRI obtained before neoadjuvant chemoradio- therapy by two radiologists in consensus. The cut-off distance for involved CRM was ≤ 2 mm.
APR = abdominoperineal resection, CRM = circumferential resection mar- gin, LAR = low anterior resection, LV = leucovorin, 5-FU = 5 fluorouracil Table 2. Accuracy of T and N Stages on CT and MRI after Neoadjuvant CRT in 57 Patients
Observer 1 Observer 2
CT MRI p-Value CT MRI p-Value
T stage
Accuracy, % 43.9 (30.8–57.7) 63.2 (49.4–75.6) 0.003 54.4 (40.7–67.7) 68.4 (54.7–80.1) 0.008 Over-staging, % 52.6 (38.9–66.0) 35.1 (22.9–48.9) 0.09 42.1 (29.1–55.9) 29.8 (18.4–43.4) 0.24 Under-staging, % 3.5 (0.4–12.1) 1.8 (0.0–9.5) 1 3.5 (0.4–12.1) 1.8 (0.0–9.5) 1 N stage
Accuracy, % 77.2 (64.2–87.3) 77.2 (64.2–87.3) 1 77.2 (64.2–87.3) 80.7 (68.1–90.0) 0.5 Over-staging, % 5.3 (1.1–14.7) 5.3 (1.1–14.7) 1 7.0 (1.9–17.0) 5.3 (1.1–14.7) 1 Under-staging, % 17.5 (8.7–29.9) 17.5 (8.7–29.9) 1 15.8 (7.5–27.9) 14.0 (6.2–25.8) 1 Note.-Numbers in parenthesis are 95% confidence intervals.
CRT = chemoradiotherapy
4). For Observer 1, the mean difference between the distances measured on MRI and histopathology was 1.2 mm (95% CI: 0.5 mm to 1.9 mm) and the limit of agreement was -3.8 mm (95% CI:
-5.0 mm to -2.6 mm) to 6.2 (95% CI: 5.0 mm to 7.4 mm) (Fig. 5).
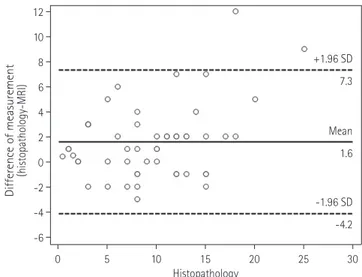
For Observer 2, the mean difference between the distances mea- sured on MRI and histopathology was 1.6 mm (95% CI: 0.8 mm to 2.4 mm) and the limit of agreement was -4.2 mm (95% CI:
-5.6 mm to -2.8 mm) to 7.3 (95% CI: 5.9 mm to 8.7 mm) (Fig.
6). The inter-observer agreements in measurements of distance to CRM on both CT and MRI were very good [intraclass corre- lation coefficient (ICC): 0.87, 95% CI: 0.77–0.93 on CT; ICC:
0.95, 95% CI: 0.91–0.97 on MRI].
excluded from the analysis for the distance to CRM because it was not measurable on histopathology. The Bland-Altman plots showed wide discrepancies between the measurements of the distance to CRM on each CT and MRI and those on histopathol- ogy. For Observer 1, the mean difference between the distances measured on CT and histopathology was 1.1 mm (95% CI: 0.2 mm to 2.1 mm) and the limit of agreement was -5.5 mm (95% CI:
-7.1 mm to -3.9 mm) to 7.7 (95% CI: 6.1 mm to 9.4 mm) (Fig. 3).
For Observer 2, the mean difference between the distances mea- sured on CT and histopathology was 2.2 mm (95% CI: 1.1 mm to 3.4 mm) and the limit of agreement was -6.1 mm (95% CI:
-8.1 mm to -4.0 mm) to 10.5 (95% CI: 8.5 mm to 12.5 mm) (Fig.
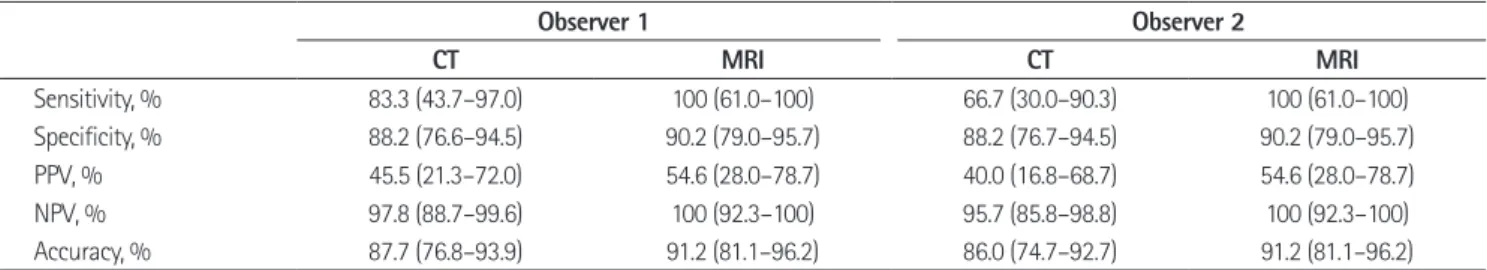
Table 3. Diagnostic Performance in Predicting Tumor Involvement of Circumferential Resection Margin
Observer 1 Observer 2
CT MRI CT MRI
Sensitivity, % 83.3 (43.7–97.0) 100 (61.0–100) 66.7 (30.0–90.3) 100 (61.0–100)
Specificity, % 88.2 (76.6–94.5) 90.2 (79.0–95.7) 88.2 (76.7–94.5) 90.2 (79.0–95.7)
PPV, % 45.5 (21.3–72.0) 54.6 (28.0–78.7) 40.0 (16.8–68.7) 54.6 (28.0–78.7)
NPV, % 97.8 (88.7–99.6) 100 (92.3–100) 95.7 (85.8–98.8) 100 (92.3–100)
Accuracy, % 87.7 (76.8–93.9) 91.2 (81.1–96.2) 86.0 (74.7–92.7) 91.2 (81.1–96.2)
Note.-Numbers in parenthesis are 95% confidence intervals. Any of performance parameters did not show statistically significant difference between CT and MRI.
NPV = negative predictive value, PPV = positive predictive value
Fig. 3. Bland-Altman plot of differences between post-chemoradio- therapy CT and histopathology in distance measurements from the tumor to circumferential resection margin (CRM) for Observer 1. The limits of agreement (-5.5 mm and 7.7 mm) are not small enough to use CT and histopathology interchangeably in the assessment of dis- tance to CRM.
Note.-X-axis = distance from the tumor and the CRM measured on histopathology, Y-axis = difference between the distances measured on CT and histopathology, solid line = mean difference, dashed line = limit of agreement
Fig. 4. Bland-Altman plot of differences between post-chemoradio- therapy CT and histopathology in distance measurements from the tumor to the circumferential resection margin (CRM) for Observer 2.
The limits of agreement (-6.1 mm and 10.5 mm) are not small enough to use CT and histopathology interchangeably in the assessment of distance to CRM.
Note.-X-axis = distance from the tumor and the CRM measured on histopathology, Y-axis = difference between the distances measured on CT and histopathology, solid line = mean difference, dashed line = limit of agreement
-8 -10
-6 -5
-4
-2 0
0 5
2
4 10
6 15
8
10 20
Difference of measurement (histopathology-CT) Difference of measurement (histopathology-CT)
0 5 10 15 20 25 30 0 5 10 15 20 25 30
Histopathology Histopathology
+1.96 SD
+1.96 SD
Mean
Mean
-1.96 SD -1.96 SD
7.7
10.5
1.1
2.2
-5.5 -6.1
weighted images were added to the evaluation. Nevertheless, a clear consensus has not been reached yet for the MRI interpreta- tion criteria after neoadjuvant CRT (24). Dimensional criterion of 5 mm cut-off were used in this study as they were conventionally used in our institution and thought to be more objective and sim- ple. Considering that a local excision based on a false negative di- agnosis might be more harmful to patients than TME based on a false positive diagnosis, the results may suggest the need for the additional imaging criteria to the dimensional criterion.
While sensitivities, specificities and negative predictive values of both imaging studies were within acceptable ranges, positive predictive values were considerably low in the evaluation of CRM. The low positive predictive values might be attributed to the low prevalence of involved CRM in the present study. How- ever, the low prevalence of involved CRM would also be expect- ed in the clinical practice with the tumor regression from neo- adjuvant CRT. Pomerri et al. (9) reported similar results in the diagnostic performances of CT and MRI after neoadjuvant CRT in predicting the CRM status. In their prospective observational study, they reported a higher diagnostic performance of MRI than of CT without a statistical significance and also consider- able low positive predictive values which might also be affected
DISCUSSION
In the present study, both CT and MRI showed a limited value in the prediction of T stage of rectal cancer after a neoadjuvant CRT although the post-CRT MRI showed a statistically signifi- cant superiority to the post-CRT CT. In both imaging studies there was a tendency to overestimate the T stage. These results were similar to or showed slightly higher accuracies than those of previous reports (6, 20). It is well known that post-CRT fibrosis and an inflammation within or around tumors can mimic tumor infiltration and may result in the overestimation of the primary tumor extent. Both observers presented one case of underesti- mation on MRI only. In this case the nodular extramural tumor invasion was misinterpreted as a perirectal lymph node enlarge- ment. Both observers categorized the local tumor stage as T2N1 while it turned out to be T3N0 on pathologic examination.
In N staging, both CT and MRI showed moderate accuracy with a tendency of underestimation. Several previous studies pro- posed diagnostic criteria according to the morphologic character- istics including border, texture and shape of lymph nodes (21, 22).
Lambregts et al. (23) reported an increased diagnostic perfor- mance in the prediction of nodal involvement when diffusion- Fig. 5. Bland-Altman plot of difference between post-chemoradio- therapy MRI and histopathology in distance measurements from the tumor to the circumferential resection margin (CRM) for Observer 1.
The limits of agreement (-3.8 mm and 6.2 mm) are not small enough to use MRI and histopathology interchangeably in the assessment of distance to CRM.
Note.-X-axis = distance from the tumor and the CRM measured on histopathology, Y-axis = difference between the distances measured on MRI and histopathology, solid line = mean difference, dashed line
= limit of agreement
Fig. 6. Bland-Altman plot of difference between post-chemoradio- therapy MRI and histopathology in distance measurements from the tumor to the circumferential resection margin (CRM) for Observer 2.
The limits of agreement (-4.2 mm and 7.3 mm) are not small enough to use CT and histopathology interchangeably in the assessment of distance to CRM.
Note.-X-axis = distance from the tumor and the CRM measured on histopathology, Y-axis = difference between the distances measured on MRI and histopathology, solid line = mean difference, dashed line
= limit of agreement -6
-6 -4 -4
-2
-2 0
0 2
2 4
4 6
8
6 10
8 12
Difference of measurement (histopathology-MRI) Difference of measurement (histopathology-MRI)
0 5 10 15 20 25 30 0 5 10 15 20 25 30
Histopathology Histopathology
+1.96 SD
+1.96 SD
Mean
Mean
-1.96 SD
-1.96 SD 6.2
7.3
1.2
1.6
-3.8 -4.2
Johnston D, et al. Role of circumferential margin involve- ment in the local recurrence of rectal cancer. Lancet 1994;
344:707-711
2. Heald RJ, Ryall RD. Recurrence and survival after total mesorectal excision for rectal cancer. Lancet 1986;1:1479- 1482
3. García-Aguilar J, Hernandez de Anda E, Sirivongs P, Lee SH, Madoff RD, Rothenberger DA. A pathologic complete response to preoperative chemoradiation is associated with lower local recurrence and improved survival in rectal can- cer patients treated by mesorectal excision. Dis Colon Rec- tum 2003;46:298-304
4. Sauer R, Becker H, Hohenberger W, Rödel C, Wittekind C, Fietkau R, et al. Preoperative versus postoperative chemo- radiotherapy for rectal cancer. N Engl J Med 2004;351:
1731-1740
5. Chen CC, Lee RC, Lin JK, Wang LW, Yang SH. How accurate is magnetic resonance imaging in restaging rectal cancer in patients receiving preoperative combined chemoradio- therapy? Dis Colon Rectum 2005;48:722-728
6. Kuo LJ, Chern MC, Tsou MH, Liu MC, Jian JJ, Chen CM, et al.
Interpretation of magnetic resonance imaging for locally advanced rectal carcinoma after preoperative chemoradia- tion therapy. Dis Colon Rectum 2005;48:23-28
7. Suppiah A, Hunter IA, Cowley J, Garimella V, Cast J, Hart- ley JE, et al. Magnetic resonance imaging accuracy in as- sessing tumour down-staging following chemoradiation in rectal cancer. Colorectal Dis 2009;11:249-253
8. Kulkarni T, Gollins S, Maw A, Hobson P, Byrne R, Widdow- son D. Magnetic resonance imaging in rectal cancer downstaged using neoadjuvant chemoradiation: accuracy of prediction of tumour stage and circumferential resec- tion margin status. Colorectal Dis 2008;10:479-489 9. Pomerri F, Pucciarelli S, Maretto I, Zandonà M, Del Bianco
P, Amadio L, et al. Prospective assessment of imaging after preoperative chemoradiotherapy for rectal cancer. Surgery 2011;149:56-64
10. Vliegen RF, Beets GL, Lammering G, Dresen RC, Rutten HJ, Kessels AG, et al. Mesorectal fascia invasion after neoad- juvant chemotherapy and radiation therapy for locally advanced rectal cancer: accuracy of MR imaging for pre- diction. Radiology 2008;246:454-462
by the low prevalence of CRM-positive cases.
Bland-Altman plots showed wide discrepancies between the measurements in CT and MRI and the measurements in histo- pathology. Both CT and MRI had a mild tendency to produce shorter measurements than the histopathology, which was more evident in cases of threatened CRM. It probably resulted from the overestimation of the tumor extent caused by post-CRT fi- brosis and inflammation. In addition, considering that the peri- rectal tissue which constitutes mesorectum is mostly composed of relatively loose adipose tissue (25), the surgical specimen used in the histopathology measurements might be shrunken or stretched. The inherent discrepancies between in-vivo and ex- vivo states of the specimen as well as the tumor responses and the tissue reactions after neoadjuvant CRT made it virtually im- possible to substitute CT and MRI for histopathology in the dis- tance measurement between tumor and CRM. Another possible reason for these discrepancies may be the time interval between imaging study and surgery. The response to neoadjuvant CRT in patients with rectal cancer is time-dependent and a complete tu- mor regression may last several months (26, 27). So the discrep- ancies might be influenced due to this ongoing process of tumor regression. However, this influence seems not to be substantial based on the findings of Bland-Altman plots, which showed no strong tendency for an over- or underestimation.
The present study had limitations. First, the number of study participants was small. This limited the comparison of CT and MRI with an adequate statistical power. Second, the distance be- tween the tumor and potential CRM was measured on trans- verse CT images and not on multi-planar reformation which would allow the image to be sectioned perpendicular to the tu- mor. The measurement of CRM on CT would be expected to be less accurate.
In conclusion, CT and MRI showed a limited performance in predicting the local tumor staging and CRM involvement in pa- tients after neoadjuvant CRT although MRI tended to show a better performance than CT.
The study data can provide a guidance for the treatment plan- ning for subjects with rectal cancer following neoadjuvant CRT.
REFERENCES
1. Adam IJ, Mohamdee MO, Martin IG, Scott N, Finan PJ,
20. Allen SD, Padhani AR, Dzik-Jurasz AS, Glynne-Jones R.
Rectal carcinoma: MRI with histologic correlation before and after chemoradiation therapy. AJR Am J Roentgenol 2007;188:442-451
21. Kim JH, Beets GL, Kim MJ, Kessels AG, Beets-Tan RG. High- resolution MR imaging for nodal staging in rectal cancer:
are there any criteria in addition to the size? Eur J Radiol 2004;52:78-83
22. Brown G, Richards CJ, Bourne MW, Newcombe RG, Rad- cliffe AG, Dallimore NS, et al. Morphologic predictors of lymph node status in rectal cancer with use of high-spa- tial-resolution MR imaging with histopathologic compari- son. Radiology 2003;227:371-377
23. Lambregts DM, Cappendijk VC, Maas M, Beets GL, Beets-Tan RG. Value of MRI and diffusion-weighted MRI for the diag- nosis of locally recurrent rectal cancer. Eur Radiol 2011;
21:1250-1258
24. Beets-Tan RG, Lambregts DM, Maas M, Bipat S, Barbaro B, Caseiro-Alves F, et al. Magnetic resonance imaging for the clinical management of rectal cancer patients: recom- mendations from the 2012 European Society of Gastroin- testinal and Abdominal Radiology (ESGAR) consensus meeting. Eur Radiol 2013;23:2522-2531
25. Diop M, Parratte B, Tatu L, Vuillier F, Brunelle S, Monnier G.
“Mesorectum”: the surgical value of an anatomical ap- proach. Surg Radiol Anat 2003;25:290-304
26. Garcia-Aguilar J, Smith DD, Avila K, Bergsland EK, Chu P, Krieg RM; Timing of Rectal Cancer Response to Chemoradi- ation Consortium. Optimal timing of surgery after chemo- radiation for advanced rectal cancer: preliminary results of a multicenter, nonrandomized phase II prospective trial.
Ann Surg 2011;254:97-102
27. Wang Y, Cummings B, Catton P, Dawson L, Kim J, Ringash J, et al. Primary radical external beam radiotherapy of rectal adenocarcinoma: long term outcome of 271 patients. Ra- diother Oncol 2005;77:126-132
11. Brown G, Daniels IR, Richardson C, Revell P, Peppercorn D, Bourne M. Techniques and trouble-shooting in high spa- tial resolution thin slice MRI for rectal cancer. Br J Radiol 2005;78:245-251
12. Greene FL, Page DL, Fleming ID, Fritz A, Balch CM, Haller DG, et al. AJCC cancer staging manual, 6th ed. New York:
Springer-Verlag, 2002
13. Brown G, Richards CJ, Newcombe RG, Dallimore NS, Rad- cliffe AG, Carey DP, et al. Rectal carcinoma: thin-section MR imaging for staging in 28 patients. Radiology 1999;
211:215-222
14. Grubnic S, Vinnicombe SJ, Norman AR, Husband JE. MR evaluation of normal retroperitoneal and pelvic lymph nodes. Clin Radiol 2002;57:193-200; discussion 201-204 15. Beets-Tan RG, Beets GL, Vliegen RF, Kessels AG, Van Boven
H, De Bruine A, et al. Accuracy of magnetic resonance im- aging in prediction of tumour-free resection margin in rectal cancer surgery. Lancet 2001;357:497-504
16. Wieder HA, Rosenberg R, Lordick F, Geinitz H, Beer A, Becker K, et al. Rectal cancer: MR imaging before neoad- juvant chemotherapy and radiation therapy for prediction of tumor-free circumferential resection margins and long- term survival. Radiology 2007;243:744-751
17. Quirke P, Durdey P, Dixon MF, Williams NS. Local recur- rence of rectal adenocarcinoma due to inadequate surgi- cal resection. Histopathological study of lateral tumour spread and surgical excision. Lancet 1986;2:996-999 18. Nagtegaal ID, Marijnen CA, Kranenbarg EK, van de Velde CJ,
van Krieken JH; Pathology Review Committee; Cooperative Clinical Investigators. Circumferential margin involvement is still an important predictor of local recurrence in rectal carcinoma: not one millimeter but two millimeters is the limit. Am J Surg Pathol 2002;26:350-357
19. Arrivé L, Renard R, Carrat F, Belkacem A, Dahan H, Le Hir P, et al. A scale of methodological quality for clinical studies of radiologic examinations. Radiology 2000;217:69-74
직장암으로 수술 전 방사선 항암요법을 받은 환자에서 종양 병기와 수술 절제면 종양 침범 여부 예측에 대한 전산화단층촬영 및
자기공명영상의 진단 정확도에 관한 연구1
박지훈
1· 김영훈
1· 이상민
2· 이윤진
1· 이경호
1· 강성범
3· 김덕우
3· 김지현
4· 김재성
5· 이혜승
6목적: 수술 전 방사선 항암요법을 받은 직장암 환자에서 국소 종양 병기와 수술 절제면의 종양 침범 여부 평가에 대한 전 산화단층촬영과 자기공명영상의 진단 정확도에 대해 연구하고자 하였다.
대상과 방법: 두 명의 영상의학과 의사가 독립적으로 수술 전 방사선 항암요법을 받은 후 시행된 전산화단층촬영과 자기 공명영상을 보고 국소 종양 병기와 수술면의 종양 침범 여부에 대해 판정하였다. 종양과 잠재적 수술 절제면 간의 거리를 영 상에서 측정한 후 이를 병리 검사에서 측정한 결과와 비교하고 블랜드-알트만 도표를 이용하여 일치도를 평가하였다.
결과: 총 57명의 환자(평균 나이 59.2세; 여성 24명)가 연구에 포함되었다. T 병기와 N 병기에 대한 CT의 정확도는 영 상의학과 의사 1에서 각각 43.9%(95% 신뢰구간, 30.8~57.7%)와 77.2%(64.2~87.3%)였고, MRI에서 63.2%
(49.4~75.6%)와 77.2%(64.2~87.3%)였다. 영상의학과 의사 2에서 CT의 정확도는 54.4%(40.7~67.7%)와 77.2%(64.2~87.3%), MRI의 정확도는 68.4%(54.7~80.1%)와 80.7%(68.1~90.0%)였다. 절제면 침범 여부에 대한 민감도와 특이도는 영상의학과 의사 1에서 CT는 83.3%(43.7~97.0%)와 88.2%(76.6~94.5%)였으며, MRI에서는 100%(61.0~100%)와 90.2%(79.0~95.7%)였다. 영상의학과 의사 2에서는 CT는 66.7%(30.0~90.3%)와 88.2%(76.7~94.5%)였으며, MRI에서는 100%(61.0~100%)와 90.2%(79.0~95.7%)였다. 블랜드-알트만 도표를 통 해 보았을 때 병리 검사에서 측정한 결과와 두 영상 검사 간의 측정 결과는 큰 차이를 보였다.
결론: 자기공명영상이 전산화단층촬영에 비해 좀 더 높은 진단능을 보이기는 하지만, 수술 전 방사선 항암요법을 받은 직장 암 환자에서 전산화단층촬영 및 자기공명영상은 국소 종양 병기와 수술절제면을 평가하는 데 제한적인 진단능을 보였다.
1서울대학교 의과대학 분당서울대학교병원 영상의학과, 2서울대학교병원 영상의학과,
분당서울대학교병원 3외과, 4내과, 5방사선종양학과, 6병리과