소아뇌종양을 위한 최신 자기공명영상: 현재의 영상기법과 판독 알고리즘
구 현 우
울산대학교 의과대학 서울아산병원 영상의학과 영상의학연구소
Advanced Magnetic Resonance Imaging for Pediatric Brain Tumors:
Current Imaging Techniques and Interpretation Algorithms
Hyun Woo Goo, M.D.
Department of Radiology and Research Institute of Radiology, Asan Medical Center, University of Ulsan College of Medicine, Seoul, Korea
Magnetic resonance imaging plays a pivotal role in noninvasive evaluation of pediatric brain tumors before and after treatments. These imaging techniques have continuously evolved and now they are incorporated into imaging protocols dedicated for brain tumors.
Advanced magnetic resonance imaging techniques include diffusion-weighted imaging, diffusion tensor imaging, functional imaging, perfusion imaging, spectroscopy, and sus- ceptibility-weighted imaging. In order to maximize their clinical usefulness, fundamental concept and clinical utility of each technique should be recognized not only by radiol- ogists, but also by referring physicians. Because pediatric brain tumors differ from adult brain tumors in various aspects, magnetic resonance imaging protocols should be appro- priately tailored to pediatric brain tumors. Another recent trend in magnetic resonance imaging is three-dimensional data acquisition that can allow high-solution isotropic images and shorter examination time. In this article, current magnetic resonance imaging techni- ques and interpretation algorithms for pediatric brain tumors are reviewed.
pISSN 2233-5250 / eISSN 2233-4580 Clin Pediatr Hematol Oncol 2013;20:13∼21
Received on April 1, 2013 Revised on April 16, 2013 Accepted on April 18, 2013
Corresponding author: Hyun Woo Goo Department of Radiology and Research Institute of Radiology, Asan Medical Center, University of Ulsan College of Medicine, 88 Olympic-ro 43-gil, Songpa-gu, Seoul 138-736, Korea
Tel: +82-2-3010-4388 Fax: +82-2-476-0090 E-mail: [email protected]
Key Words: Brain tumors, Imaging techniques, Infants and children, Magnetic resonance imaging, Magnetic resonance spectroscopy
Introduction
Pediatric brain tumors are the second most common pe- diatric tumor, surpassed only by leukemia [1]. Pediatric brain tumors differ from adult brain tumors in their type, location, and presentation. These differences often demand magnetic resonance imaging (MRI) protocols uniquely opti- mized for pediatric brain tumors. For example, the imaging evaluation tends to be cumbersome in pediatric brain tu-
mors adjacent to the skull base where magnetic suscepti-
bility artifacts significantly degrade image quality. In the
noninvasive evaluation of pediatric brain tumors before and
after treatments, MRI plays a pivotal role. In addition to
conventional MRI techniques, advanced magnetic reso-
nance imaging techniques including diffusion-weighted
imaging (DWI), diffusion tensor imaging (DTI), functional
imaging, perfusion imaging, spectroscopy, and suscepti-
bility-weighted imaging (SWI) are commonly used [1-6]. A
3 tesla (T) MRI system is generally preferred to a 1.5 T sys-
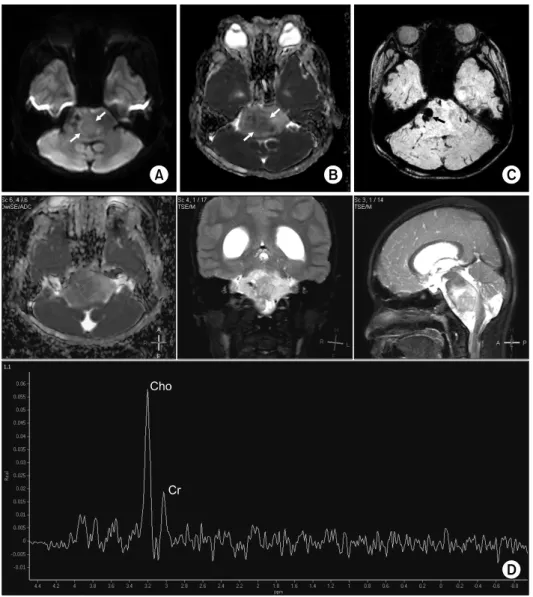
Fig. 1. Diffuse pontine glioma. Dif-
fusion-weighted image (A) and ap- parent diffusion coefficient map (B) show a region with restricted water diffusion (arrows) suggesting a higher-grade tumor. (C) Suscepti- bility-weighted image demonstrate a hemorrhagic focus (arrow) in the tumor. (D) Single-voxel MR spect- roscopy obtained at the region with restricted water diffusion reveals a high choline (Cho) peak. A smaller creatine (Cr) peak is also noted.The tumor was proven to have a portion of glioblastoma by image- guided biopsy.
tem for neuroradiology mainly due to higher contrast-to- noise ratio (CNR), higher signal-to-noise ratio (SNR), and higher performance [7]. In addition, three-dimensional (3D) data acquisition is another recent innovation in MRI be- cause it provides isotropic spatial resolution and shorter ex- amination time [8]. In this article, fundamental concept, clinical utility, and interpretation algorithms of these MRI techniques in evaluating pediatric brain tumors are reviewed.
Diffusion-weighted Imaging (DWI)
DWI is usually obtained by a diffusion-sensitized sin- gle-shot echo planar sequence and a b value of 1,000 s/mm
2and provides qualitative and quantitative assess- ments of water diffusion in brain tumors as well as brain
tissue. Of note, DWI includes the so-called T2-shine-through effects. To avoid this diagnostic pitfall of DWI, we should ascertain whether a hyperintense area on DWI is also true on the apparent diffusion coefficient (ADC) map. ADC val- ues are calculated from MRI data obtained with at least two b values (i.e., 0 and 1,000 s/mm
2). These ADC values re- flect tumor cellularity or nucleocytoplasmic ratio in brain tumors. Therefore, restricted water diffusion is seen in me- dulloblastoma or primitive neuroectodermal tumor, whereas low-grade gliomas generally show increased water diffusion.
In spite of a considerable diagnostic gray zone, DWI and
ADC map have been used to evaluate tumor grade, treat-
ment response, and tumor recurrence of pediatric brain
tumors. DWI and ADC map seem to be particularly useful
to identify a high-grade component in brainstem tumors (Fig.
Fig. 2. Pilocytic astrocytoma in the left thalamus. Diffusion tensor imaging provides a fractional anisotropy image (A) and color-coded
map (B) showing low fractional anisotropy values in the tumor (asterisk). (C) Fiber tractography demonstrates that the left corticospinal tract is deviated by the tumor (asterisk).1). Recent studies showed that ADC ratios or histogram could be used for distinguishing pediatric brain tumors [9,10]. In addition to pure water diffusion in the tissue, ADC values include a microvascular perfusion component in lower b values (e.g., < 100-150 s/mm
2). It should be not- ed that hemorrhagic foci in brain tumors produce artifacts on ADC map.
Diffusion Tensor Imaging (DTI)
DTI acquired with at least six diffusion-sensitizing gra- dient directions provides index of anisotropic water dif- fusion mostly due to white matter tracts. Fractional aniso- tropy map represents the magnitude of anisotropic water diffusion ranging from 0 to 1, and three different colors (red, green, and blue) on color-coded map additionally demonstrates major directions of white matter tracts along three orthogonal spatial axes (Fig. 2). The effects of a brain tumor on white matter tracts are classified into four pat- terns: deviated, infiltrated, edematous, and destroyed [11].
In brain tumors, DTI may delineate tumor infiltration in peritumoral edema invisible on other MRI techniques [12].
Two or 3D fiber tractography reconstructed from DTI data can show spatial relationships between major functional fi- bers, such as motor, language, and visual tracts, and brain tumors that is crucial for surgical planning [13,14] (Fig. 2).
This fiber tractography has shown a good correlation with direct subcortical stimulation. In pediatric posterior fossa tu- mors, DTI may be used to demonstrate the structural in- tegrity of cerebello-thalamo-cerebral connections altered af- ter treatments that correlates with impairment of cognitive function [15]. Diagnostic pitfalls of DTI, such as crossing fibers, false negative findings, image distortion due to mag- netic susceptibility artifacts, and intraoperative brain shift- ing, should be kept in mind to avoid misinterpretation [13].
Functional Imaging
Functional MRI can be used to reveal eloquent brain areas to minimize potential neurological deficits after tumor resection [16]. The blood oxygen level-dependent (BOLD) technique is used to indirectly measure neuronal activity al- tered by various tasks, such as motor and language (Fig.
3). However, it may be challenging to obtain reliable re-
sults in young children because successful functional MRI
is cooperation-dependent [17]. Behavioral analysis and
training have shown increased levels of cooperation during
functional MRI. Using a mock scanner is also helpful in fa-
miliarizing children with the MRI environment. When chil-
dren have a difficulty in performing task-based functional
MRI, passive range of motion in sedated children or rest-
ing-state functional MRI may be used as an alternative
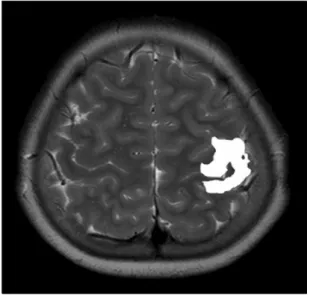
Fig. 3. Functional magnetic resonance imaging shows the left
motor area induced by a right finger tapping task.[18,19].
Perfusion Imaging
Perfusion MRI provides information on the degree of ne- ovascularity or tumor angiogenesis, one of essential factors in determining tumor grade and prognosis [5]. Three imag- ing techniques can be used to obtain perfusion MRI: dy- namic susceptibility-weighted contrast-enhanced (DSC) per- fusion imaging, dynamic contrast-enhanced (DCE) perfu- sion imaging, and arterial spin labeling (ASL) imaging. DSC imaging is most widely used for evaluating brain tumors.
In contrast, both DCE and ASL imaging techniques are con- tinuously evolving and increasingly used in clinical practice.
1) DSC imaging
DSC MRI is obtained by a dynamic T2*-weighted gra- dient-echo echo-planar imaging in which the measured sig- nal is derived from the T2* susceptibility effect (negative enhancement) induced by the injected gadolinium contrast agent. Perfusion parameters, such as relative cerebral blood volume (rCBV), relative cerebral blood flow (rCBF), and mean transit time (MTT), are calculated by using various methods, such as the indicator dilution method and the pharmacokinetic modeling approach. In general, high-grade tumors show high rCBV values measured by DSC imaging
(Fig. 4). However, foci of high rCBV may be often seen in low-grade tumors, such as pilocytic astrocytoma and oligodendroglioma. High rCBV values in enhancing lesions are also helpful in distinguishing viable tumor from radiation necrosis (Fig. 5), and in differentiating true tumor progression from pseudo-progress during radiation or chemotherapy.
DSC imaging has several technical limitations. Firstly, DSC imaging needs a complicated algorithm to obtain absolute perfusion values. In addition, a paradoxical nulling of the rCBV may be resulted from contrast leakage through dis- rupted blood-brain barrier in brain tumors, violating the as- sumption that the injected contrast agent remains within the intravascular compartment [3]. This can be ameliorated by pre-imaging infusion of a small dose of contrast agent (0.025-0.05 mmol/kg) [6]. DSC imaging may not provide perfusion values because the imaging technique is exceed- ingly vulnerable to image distortion and artifacts from brain-bone-air interfaces, blood products, and calcium [6].
In children, high-flow contrast injection required for opti- mal DSC imaging is often difficult.
2) DCE imaging
DCE imaging obtained by a dynamic contrast-enhanced
T1-weighted gradient echo imaging (positive enhancement)
provides quantitative assessment of vascular permeability of
brain tumors (Fig. 5). Various transfer constants provided
by DCE imaging include K
trans(volume transfer constant be-
tween blood plasma and extracellular extravascular space
[EES]), K
ep(flux rate constant between plasma and EES),
and V
e(the EES fractional volume) [5,14]. High-grade glio-
mas tend to have higher K
transthan low-grade gliomas. Its
clinical usefulness in pediatric brain tumors remains to be
clarified by further studies. As compared with DSC imaging,
DCE imaging is less problematic in image distortion and ar-
tifacts, but DCE imaging is limited by shorter longitudinal
coverage and lower temporal resolution. In some in-
stitutions, the MRI protocol for brain tumors includes the
so-called combined approach using both DCE imaging
(with the first single-dose contrast injection) and DSC imag-
ing (with the second single-dose contrast injection).
Fig. 4. Atypical teratoid rhabdoid
tumor in the pineal gland region.(A) Axial contrast-enhanced T1- weighted image shows intense en- hancement (arrows) in the tumor.
Dynamic susceptibility-weighted contrast-enhanced perfusion image (B), dynamic contrast-enhanced per- fusion image (C), and pseudo- continuous arterial spin labeling image (D) demonstrate increased relative cerebral blood volume, increased vascular permeability, and increased blood flow, respec- tively, of the enhancing tumor (arrows).
Fig. 5. Primitive neuroectodermal tumor in the left frontal lobe after radiotherapy. (A) Axial contrast-enhanced T1-weighted image
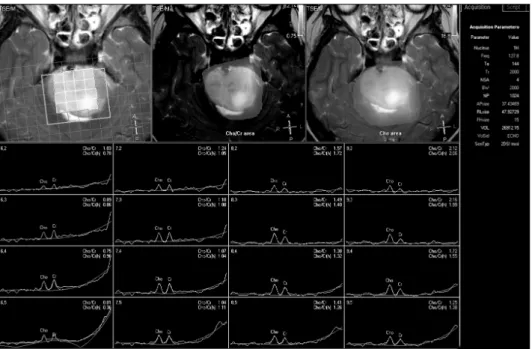
shows an enhancing lesion (arrow) along the resection margin. (B) Dynamic susceptibility-weighted contrast-enhanced perfusion image reveals no areas with increased relative cerebral blood volume in the left frontal lobe. (C) [18F]-fluoro-3’-deoxy-3’-L-fluorothymidine PET image shows no areas with increased uptake in the left frontal lobe. The lesion is presumed to be radiation necrosis rather than recurred tumor.Fig. 6. Diffuse pontine glioma.
Multi-voxel magnetic resonance spectroscopy demonstrated color- coded maps of choline/creatine area and choline area with a 4×4 resolution.