JKSMRM 13:81-87(2009)
1Department of Diagnostic Radiology and Research Institute of Radiological Science, Yonsei University College of Medicine Received; May 3, 2009, revised; May 15, 2009, accepted; May 30, 2009
This work was supported by a faculty research grant of Yonsei University College of Medicine (6-2008-0148). Corresponding author : Byoung Wook Choi, M.D., Department of Diagnostic Radiology, Severance Hospital,
Yonsei University College of Medicine, 250 Seongsanno, Seodaemoon-Gu, Seoul 120-752, Korea. Tel. 82-2-2228-7400 Fax. 82-2-393-3035 E-mail: [email protected]
Gadolinium-Enhanced Magnetic Resonance Imaging of
Atherosclerotic Plaques in Comparison with
Histopathology: An In Vivo Study in Aorta of Rabbits
Byoung Wook Choi, Jin Hur, Hye-Jeong Lee, Young Jin Kim, Tae Hoon Kim, Kyu Ok ChoePurpose : We sought to evaluate enhancement of plaque with gadolinium-based contrast agent by magnetic resonance imaging (MRI) in comparison with histopathology, namely lipid-rich and macrophage-rich components that were two representative characteristics of plaque vulnerability using atherosclerotic rabbit aorta in order to determine which histopathologic component is relevant to the enhancement.
Materials and Methods : New Zealand white rabbit (n=4, weight 3.0 to 3.5 kg, all male) was used for animal model of atherosclerosis. Atherosclerotic aortic lesions were induced by high-cholesterol diet and double balloon injury. T1-weight axial images were acquired before and after gadolinium-based contrast agent using a 3-T MRI. MR images and the matched histopathological sections (n=35) were divided into 4 quadrants or 3 (n=130). Enhancement ratio (ER, ER=SIpost/SIpre) on MRI was calculated for each quadrant and compared with histopathology in regard to lipid-rich and macrophage-rich areas.
Results : Lipid-rich quadrants were 72 and fibrous quadrants were 58. The number of quadrants which had macrophage-rich areas was 105 and that of quadrants which did not have macrophage-rich areas was 25. ER was significantly higher in lipid-rich quadrants than in fibrous quadrants (mean ER 2.25±0.41 vs. 2.72±0.65, p=0.013). ER poorly correlated with macrophage-rich areas when lipid-component was controlled (correlation coefficient -0.203, p=0.236).
Conclusion : Lipid-rich plaques showed stronger enhancement than fibrous plaques using a standard gadolinium-based extracellular contrast agent. Macrophage infiltration did not correlate with degree of enhancement. Further study is warranted that account for optimal time of imaging after contrast injection using various plaque models from early to advanced stages and all possible parameters associated with contrast enhancement.
Index words :Atherosclerotic plaque Plaque vulnerability
Contrast-enhanced magnetic resonance imaging Lipid-rich plaque, Macrophage
Introduction
Conventional angiography has been a standard modality to diagnose degree of stenosis of coronary artery. However it does not provide any information with regard to plaque composition and inflammatory activity. Growing evidence suggests that the decisive factor determining plaque vulnerability is plaque composition rather than the degree of luminal narrowing (1-3). Vulnerable plaque has characteristic features of a large lipid core, a thin fibrous cap, and abundant macrophages and neovessels as an inflammatory activity (4). Magnetic resonance imaging (MRI) with high spatial resolution has shown great promise in the identification and quantification of atherosclerotic plaque components which are related to plaque vulnerability (5-12).
Contrast-enhanced MRI using gadolinium-based extracellular contrast agents offers morphological as well as functional assessment of atherosclerotic plaque formation (5-10). Contrast-enhanced MRI has been found useful for the characterization of fibrous plaque tissue in patients with advanced carotid artery stenosis (5, 6). Recent studies on human carotid atherosclerotic plaques have shown that several gadolinium uptake parameters correlated with the extent of macrophage burden (7). However, gadolinium-based contrast agents are not specific, and the underlying mechanisms leading to contrast enhancement within the atherosclerotic vessel wall are so far not fully elucidated.
With current MR technology, evaluation of atherosclerotic plaques in human coronary artery is limited. Rabbit aorta is well established atherosclerotic model for plaques in human coronary artery because the size of vessel is similar to that of human coronary artery and high cholesterol diet with double balloon injury technique to induce atherosclerosis in the aorta of rabbit has been proved to be efficient even though there is no concrete evidence that the characteristics or contrast-enhancement of plaques in rabbit aorta is the same as those of coronary artery or carotid artery.
In this study, we sought to evaluate enhancement of plaque with gadolinium-based contrast agent by MRI in comparison with histopathology, namely lipid-rich and macrophage-rich components that were two
representative characteristics of plaque vulnerability using atherosclerotic rabbit aorta in order to determine which histopathologic component is relevant to the enhancement.
Materials and Methods Animal Protocol
New Zealand white rabbit (n = 4, weight 3.0 to 3.5 kg, all male) was used for animal model of atherosclerosis. Atherosclerotic aortic lesions were induced by 4 months of a high-cholesterol diet (1% cholesterol and 5% coconut oil) and double aortic balloon denudation injury (at 1 week and 1 month after starting the high-cholesterol diet). Aortic injury was performed 3 times from the aortic arch to the iliac bifurcation with use of a 4F Fogarty embolectomy catheter introduced through the iliac artery. All procedures were performed under general anesthesia by intramuscular ketamine injection (30 mg/kg) and xylazine (10 mg/kg). The study protocol was approved by our Animal Care and Use Committee.
Magnetic Resonance Imaging
Under general anesthesia by intramuscular ketamine injection (20 mg/kg) and xylazine (5 mg/kg), the rabbits were imaged in the craniocaudal direction and in the supine position with a 3.0 Tesla (T) MRI unit (TrioTim, Siemens Medical Systems, Germany) using the body coil. Three orthogonal localizer images served to confirm an adequate position of the animal. Thereafter, sequential axial T1-weighted images with a 3-mm thickness of the aorta from the arch to the iliac bifurcation were obtained using a fast spin-echo sequence with an in-plane resolution of 0.43×0.43 mm. Two minutes after administration of 0.1mmol/kg of gadolinium-based contrast agent (Gadodiamide, OmniscanTM, 0.5 mmol/ml, GE Healthcare) via the ear vein, axial T1-weighted imaging was repeated with the same protocol as pre-contrast scan. Each T1-weighted imaging typically took 15 minutes. Fat suppression was applied in all imaging sequences. The typical parameters were as follows; TR/TE: 624/10 ms, field of view = 11×11 cm, matrix 256×256, echo train length = 5, signal averages = 2.
a b
c d
e
Fig. 1. In vivo T1-weighted MR images before (a) and after
contrast injection (b). Masson’s trichrome staining characterizes fibrous cap (FC) and lipid-rich areas (LR) (c). Staining with monoclonal mouse anti RAM-11 antibodies for macrophages represents macrophage-rich area (MR) in the plaque (d). MR images and histopathological sections were divided into 4 quadrants for further analysis (e). * L: lumen, FC: fibrous cap, LR: lipid-rich area, MR: macrophage-rich area
Histopathology
Rabbits were euthanized within 48 hours after MRI by intravenous injection of 5 mL IV of 26% sodium pentobarbital after receiving heparin (1000 U/kg) to prevent postmortem thrombosis.
The aortas were excised after the perfusion-fixation using 4% phosphate-buffered paraformaldehyde (4% in PBS). Serial sections of the aorta were cut at 3-mm intervals to match the corresponding MR images. Specimens were embedded in paraffin, and sections 5 μm thick were cut for one per every 3 slices and stained with combined Masson’s trichrome elastin stain. Additional sections were stained with monoclonal mouse anti RAM-11 antibodies for macrophages (Dako, CA, USA).
Image Analysis
The MR images were transferred to a dedicated workstation (Aquarius, Terrarecon Inc) for analysis. Wall and lumen signal intensities (SI) were determined with standard region-of-interest (ROI) measurements with magnification. One experienced radiologist who
was dedicated to cardiovascular imaging drew all ROIs. Enhancement ratio (ER) of the SI was calculated as follows; ER=SIpost/SIpre, where SIpost is SI of the wall after contrast enhancement and SIpre is SI of the wall before contrast enhancement. An experienced radiologist performed all measurements.
The histopathologic sections were digitized from a camera attached to a light microscope then transferred to another computer. An independent pathologist blinded to the results of MRI performed the histopathology analysis.
MR images and the matched histopathological sections (n=35) were divided into 3 or 4 quadrants (n=130) (Fig. 1). ER was calculated for each quadrant of MR images and was thereafter classified as lipid-rich or fibrous plaque on the basis of histological sections. On histological analysis, if the percentage of lipid rich areas was over 50% of total plaque area, then it was considered as a lipid-rich plaque. Macrophage-rich areas were measured by manual drawing of ROI at the areas which were stained with monoclonal mouse anti RAM-11 antibodies for macrophages. All measurement
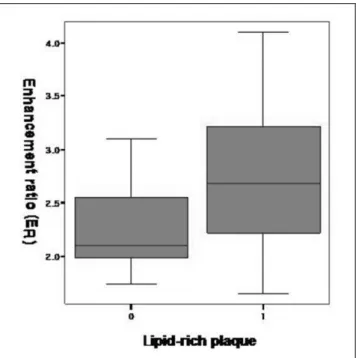
Fig. 2. Box-whisker graph of enhancement ratio of fibrous and lipid-rich quadrants determined by histopathology. Each box describes the distribution of enhancement ratio within one standard deviation.
* Lipid-rich quadrant is labeld as 1 in the x-axis. * Fibrous quadrant is labeled as 0 in the x-axis.
Fig. 3. Box-whisker graph of enhancement ratio of non macrophage-rich and macrophage-rich quadrants determined by histopathology. Each box describes the distribution of enhancement ratio within one standard deviation.
* Macrophage-rich area is labeld as 1 in the x-axis. * Non macrophage-rich area is labeled as 0 in the x-axis.
on histological analysis was performed using a computer-assisted quantitative color image analysis system (Image Pro-Plus, Media Cybernetics) in each slices and were expressed in mm2.
The slices for each rabbit were sequentially numbered to match the image slices between histopathology and MRI. The site and longitudinal extent of plaques were also determined by their distance to the fiduciary points such as side branches or plaque morphology. These were used as references for comparison between MRI and histopathology for each site.
The ER was correlated with the lipid content and macrophage-rich area for each image quadrant.
Statistical Analysis
The statistical significance of differences in ER of plaques according to different plaque types determined by histopathology was assessed using Student’s t test for independent samples. Correlations of ER and macrophage-rich areas were performed using Pearson’ s correlation coefficient. P-values less than 0.05 will be considered statistically significant. SPSS software (Version 10.0; Statistical Package for the Social Sciences, Chicago, IL) was used for statistical evaluation.
Results
Lipid-rich quadrants were 72 and fibrous quadrants were 58. The number of quadrants which had macrophage-rich areas was 105 and that of quadrants which did not have macrophage-rich areas was 25.
The mean area of ROI was 4.2±1.1 mm2 which
varied according to wall thickness. The mean value of maximal wall thickness of each quadrant was 1.1±0.3 mm. ER was significantly higher in lipid-rich quadrants than in fibrous quadrants (mean ER 2.25±0.41 vs. 2.72 ± 0.65, p=0.013) (Fig. 2). The mean value of macrophage-rich areas was not significantly different between in lipid-rich quadrants and in fibrous quadrants (0.48±0.51 mm2 vs. 0.58±0.49 mm2,
p=0.557). ER poorly correlated with macrophage-rich areas when lipid-component was controlled (correlation coefficient -0.203, p=0.236) (Fig. 3). ER was not different between in the quadrants that had macrophage-rich areas and in the quadrants that did
not have macrophage-rich areas (2.57±0.64 vs.2.63± 0.60, p=0.816).
Discussion
Plaque vulnerability is decided by plaque composition and inflammatory activity rather than the degree of luminal narrowing (1-4). A large lipid-rich necrotic core is a well known factor to reflect plaque vulnerability. Inflammation plays a key role in the whole process of initiation and progression of atherosclerosis and increases vulnerability to rupture as well. Accumulation of macrophages in atherosclerotic plaque is indicative of local inflammatory reaction (13, 14).
MRI is a diagnostic modality for noninvasive imaging of plaque components, such as lipid core, fibrous cap, calcifications, and intraplaque hemorrhage. Because of the limited spatial resolution and low signal-to-noise ratio of MRI, plaque MRI has been studied mainly for carotid artery plaques which have larger size and less motion than coronary artery plaques. Previous studies for carotid atherosclerotic plaques have shown that postcontrast T1-weighted MR images helped to discriminate fibrous cap from necrotic core (6). Fibrous tissue in atherosclerotic plaques was enhanced more than lipid-rich necrotic core and the differences between enhancement of fibrous tissue and lipid-rich necrotic core were significant (5).
Neovessels play a key role in the progression of atherosclerotic plaques by providing routes of leukocyte recruitment into plaque. Several studies reported a higher neovessel count in highly inflamed macrophage-rich atherosclerotic plaques compared to fibrocalcific lesions (8, 9). This suggested that macrophage-rich atherosclerotic plaques, which were active inflammatory plaques, could be enhanced stronger than macrophage-poor atherosclerotic plaques. Kerwin et al. reported that plasma volume and transfer constant correlated with macrophage-rich area using contrast enhanced dynamic MRI in advanced carotid atherosclerotic plaques (7).
The underlying mechanism of plaque enhancement is likely to be mutifactorial and not fully elucidated so far (8, 15, 16). Gadolinium-based agents are known to passively distribute from the intravascular into the extracellular fluid space. Contrast enhancement may be
due to increased permeability, increased extracellular volume, and/or decreased washout of contrast agent (15). Therefore loose matrix, inflammation, and neovascularture were associated with stronger enhancement in atherosclerotic plaque.
In some studies, differentiation of lipid-rich necrotic core from fibrous tissue was potentially possible by using contrast-enhanced MRI (5, 6). Collagen-rich fibrous cap showed moderate enhancement, but the fibrous cap containing neovasculature, inflammatory cell infiltrates or loose matrix showed strong enhancement (6). In our study, however, ER correlated with lipid-rich components. In addition, ER did not correlate with macrophage-rich area, which reflected active inflammation and neovascularization. Lipid-rich area does not necessarily mean avascularity. In our study, necrosis was not a characteristic feature of lipid-rich area in atherosclerotic plaque probably because the plaques were relatively earlier and actively inflammatory stage. Lipid-rich area had loose cellularity which suggested that the lipid-rich plaque had more space for contrast agent to distribute.
In this study, more distributable space was associated with strong enhancement because contrast-enhanced MRI protocol allowed sufficient time for contrast agent molecules to diffuse into lipid-rich areas. In addition, macrophage existed in most quadrants including fibrous quadrant as well as lipid-rich quadrants.
As loose matrix is associated with delayed hyperenhancement using extracellular contrast agents and neovasculature is associated with perfusion parameters, further studies are warranted that account for optimal timing of MRI after contrast administration. Recently, high resolution wall imaging has been tried in human coronary artery with a 3-T MR unit and a 32-channel receiver coil. Multicontrast plaque imaging and contrast enhanced imaging for evaluation of atherosclerotic plaques in human coronary artery will be possible in near future. This study would be helpful to elucidate the mechanism of contrast enhancement in plaques and to predict vulnerability of plaques based on the association of enhancement and representative components of vulnerabiligy.
Limitation of this study was as follows. We did not analyze neovessels which could be a direct explanation of enhancement. The atherosclerotic plaques in this animal model had abundant lipid-rich area and active
inflammation in most quadrants, which resulted in discrepancy of the results between this study and previous studies, where advanced plaque in human carotid artery were used. Interobserver and intraobserver agreement were not obtained. Finally we did not use control to compare enhancement of plaque and normal wall.
Conclusion
Lipid-rich plaques showed stronger enhancement than fibrous plaques using a standard gadolinium-based extracellular contrast agent. Macrophage infiltration did not correlate with degree of enhancement. Further study is warranted that account for optimal time of imaging after contrast injection using various plaque models from early to advanced stages and all possible parameters associated with contrast enhancement.
References
1.Virmani R, Burke AP, Farb A, Kolodgie FD. Pathology of the vulnerable plaque. J Am Coll Cardiol 2006;47:C13-18. 2.Falk E, Shah PK, Fuster V. Coronary plaque disruption.
Circulation 1995;92:657-671.
3.Carr S, Farb A, Pearce WH, Virmani R, Yao JS. Atherosclerotic plaque rupture in symptomatic carotid artery stenosis. J Vasc Surg 1996;23:755-566.
4.Virmani R, Kolodgie FD, Burke AP, Farb A, Schwartz SM. Lessons from sudden coronary death: a comprehensive morphological classification scheme for atherosclerotic lesions. Arterioscler Thromb Vasc Biol 2000;20:1262-1275. 5.Yuan C, Kerwin WS, Marina S, et al. Contrast-enhanced high
resolution MRI for atherosclerotic carotid artery tissue characterization. J Magn Reson Imaging 2002;15:52-67. 6.Cai J, Hatsukami TS, Ferguson MS, et al. In vivo quantitative
measurement of intact fibrous cap and lipid-rich necrotic core size in atherosclerotic carotid plaque; comparison of high-resolution, contrast-enhanced magnetic resonance imaging and histology. Circulation 2005;112:3437-3444.
7.Kerwin WS, O’brien KD, Ferguson MS, Polissar N, Hatsukami TS, Yuan C. Inflammation in carotid atherosclerotic plaque: a dynamic contrast-enhanced MR imaging study. Radiology 2005;241:459-468.
8.Kerwin W, Hooker A, Spilker M, et al. Quantitative magnetic resonance imaging analysis of neovesculature volume in carotid atherosclerotic plaque. Circulation 2003;107:851-856. 9.Calcagno C, Cornily JC, Hyafil F, et al. Detection of
neovessels in atherosclerotic plaques of rabbits using dynamic contrast enhanced MRI and 18F-FDG PET. Arterioscler Thromb Vasc Biol 2008;28:1311-1317.
contrast-enhanced cardiac magnetic resonance imaging demonstrates regression of hyperenhancement within the coronary artery wall in patients after acute myocardial infarction. J Am Coll Cardiol Img 2009;2:580-588.
11.Lobbes MB, Miserus RJJHM, Heeneman S, et al. Atherosclerosis: contrast-enhanced MR imaging of vessel wall in rabbit model-comparison of gadofosveset and gadopentetate dimeglumine. Radiology 2009;250:682-691. 12.Barkhausen J, Ebert W, Heyer C, Debatin JF, Weinmann HJ.
Detection of atherosclerotic plaque with gadofluorine-enhanced magnetic resonance imaging. Circulation 2003;108:605-609.
13.Ohtsuki K, Hayase M, Akashi K, Kopiwoda S, Strauss HW. Detection of monocyte chemoattractant protein-1 receptor
expression in experimental atherosclerotic lesions: an autoradiographic study. Circulation 2001;104:203-208. 14.Ogawa M Ishino S, Mukai T, et al. F-FDG accumulation in
atherosclerotic plaques: immunohistochemical and PET imaging study. J Nucl Med 2004;45:1245-1250.
15.Wasserman BA, Smith WI, Trout HH III, Cannon RO III, Balaban RS, Arai AE. Carotid artery atherosclerosis: in vivo morphologic characterization with gadolinium-enhanced double-oblique MR imaging-initial results. Radiology 2002;223:566-573.
16.Aoki S, Aoki K, Ohsawa S, Nakajima H, Kumagai H, Araki T. Dynamic MR imaging of the carotid wall. J Magn Reson Imaging. 1999;9:420-427.
통신저자 : 최병욱, (120-752) 서울시 서대문구 신촌동 134, 연세대학교 의과대학 영상의학과 방사선의과학연구소 Tel. 82-2-2228-7400 Fax. 82-2-393-3035 E-mail: [email protected]