Hypertension Risk of Obesity and Abdominal Obesity in High School Students
Yu jin Kwak, Ji Hyen Lee, Young Mi Hong, Hae Soon Kim
Department of Pediatrics, Ewha Womans University College of Medicine, Seoul, Korea
Introduction
The prevalence of overweight and obesity is rising among children and adolescents in both developed and developing countries [1-3]. The World Health Organization reported that 18% of children and adolescents aged 5 to 19 were overweight or obese in 2016 Global Health Observatory data and the prevalence has increased at an alarming rate. The World Health Organization further projects that by 2016, the number of over-
weight children under the age of five, is estimated to be over 41 million and almost half of all overweight children under 5 lived in Asia. Accordingly, childhood obesity has become a public health crisis in Asia [4].
With the increased childhood weight problems, the preva- lence of weight-related health conditions including hypertension is increased [2,5]. Because of the close association between blood pressure (BP) and obesity, the rapid increase in obesity may contribute to a raise in the prevalence of hypertension Objectives: This study was conducted to determine the prevalence of hypertension in
adolescents and to find the relationship between an increase of body mass index and waist circumference (WC) and blood pressure (BP).
Methods: Four hundred twenty-nine adolescents between the ages of 15 and 18 at high school in Seoul were enrolled and their anthropometric data and body composi- tion were measured. BP was measured by oscillometric devices at least twice. Hyper- tension was defined according to the normative BP reference for Korean children and adolescents.
Results: The prevalence of prehypertension and hypertension was 14.0%, 9.2% in boys and 9.0%, 10.2% in girls. The prevalence of prehypertension and hypertension was 9.0%, 6.0% in the normal body mass index group, 14.6 %, 16.7% in the overweight group, 21.7%, 29.8% in the obese group. The prevalence of systolic hypertension was 3.6% in the normal group, 12.5% in the overweight group and 29.8% in the obese group. How- ever, the prevalence of diastolic hypertension had significant differences between the groups, which were 3.3% in the normal group, 6.3% in the overweight group and 4.3% in the obese group. According to WC, the prevalence of hypertension was 6.2% in the be- low 75th percentile WC group, 22.2% in the75th to 90th percentile WC group and 25.6%
in ≥90th percentile WC group. The risk of hypertension was 5.55 times higher in the obese group and 2.04 times higher in the overweight group, 3.93 times higher in ≥90th percentile of WC group.
Conclusion: The risk of hypertension is markedly increased with obesity in high school students. (Ewha Med J 2018;41(1):13-18)
Received January 11, 2018 Revised January 19, 2018 Accepted January 22, 2018 Corresponding author Hae Soon Kim
Department of Pediatrics, Ewha Womans University College of Medicine, 1071 Anyangcheon-ro, Yangcheon-gu, Seoul 07985, Korea
Tel: 82-2-2650-5275, Fax: 82-2-2653-3718 E-mail: [email protected]
Key Words
Prehypertension; Hypertension; Body mass index; Waist circumference
This is an Open Access article distributed under the terms of the Creative Commons Attribution Non-Commercial License (http://creativecommons.org/licenses/by-nc/4.0) which permits unrestricted non-commercial use, distribution, and reproduction in any medium, provided the original work is properly cited.
in children and adolescents [6-8]. Higher BP in childhood is predictive of sustained hypertension in young adulthood and a major risk factor for cardiovascular disease and is linked to car- diovascular morbidity [9-11]. In addition, once obesity-related hypertension has been established in adults, the control of BP is difficult to achieve because the mainstay of therapy must be weight loss [12].
The purpose of this study was to investigate the prevalence of prehypertension and hypertension in a high school students and to establish the relationship between obesity indices and hyper- tension. Furthermore, the effective interventions for prevention and control of adolescent obesity should be considered to pre- vent adult obesity and hypertension.
Methods
1. Study participants
This study was conducted in March 2009 at a high school.
A total of 429 adolescents (173 males and 256 females), aged between 15 to 18 years, were included in this study. Exclusion criteria included the self-reported presence of renal disease or cardiac disease. We classified as overweight if body mass index (BMI) was between 85th and 95th percentiles and obesity if BMI was ≥95th percentile for children of the same age and sex [13].
Abdominal obesity was classified as normal if waist circum- ference (WC) was below 75th percentile compared to >75th and ≤90th and >90th percentile for children of the same age and sex [14].
This study was carried out with the approval of the ethics committee of Ewha Womans University Hospital institutional re- view board, and written informed consents were obtained from
the parents of all subjects.
2. Anthropometric measurements
Anthropometric data of weight, height, WC, BMI were col- lected from all participants. WC was measured using a metal anthropometric tape at the mid-waist point between the lowest rib and the iliac crest in a standing position at minimal respira- tion. BMI was calculated by dividing the body weight (measured in kilograms) by height squared (measured in meters).
3. BP measurements
Oscillometric devices, Dinamap Procare 200 (GE Inc., Mil- waukee, WI, USA), were used for the BP measurements. BP was measured twice with a cuff of appropriate size on the right arm in a sitting position following a 5-minute rest period and averaged for a final BP reading.
4. Definition of hypertension
Hypertension was defined if systolic or diastolic pressure was
≥95th percentiles for age, height, and sex. Prehypertension was defined if systolic or diastolic pressure ≥90th percentiles for age, height, and sex according to the normative BP reference for Korean children and adolescents [15].
Results
Anthropometric data of participants including weight, height, BMI, and WC are presented according to sex in Table 1. The age of all boys and girls were similar range from 15 to 18 years (P=0.536). The mean value of weight, height and WC of boys
Table 1. Anthropometric data
Boys Girls P-value
No. of subjects 173 256
Age (yr) 16.6±0.9 16.5±0.9 0.536
Weight (kg) 67.4±14.8 55.8±9.1 <0.001 Height (cm) 172.3±5.9 159.5±4.8 <0.001
BMI (kg/m2) 22.7±4.6 21.9±3.3 0.056
WC (cm) 77.2±10.8 68.4±7.5 <0.001
Data are expressed as number or mean±standard deviation.
BMI, body mass index; WC, waist circumference.
Table 2. The prevalence of obesity according to BMI and WC percentiles Boys (%) Girls (%) Total (%)
BMI ≥85th percentile 23.1 21.4 22.1
Overweight* 12.1 10.5 11.2
Obesity† 11.0 10.9 10.9
WC ≥75th percentile 25.4 17.6 20.7
75th to <90th percentile 12.1 9.4 10.5
≥90th percentile 13.3 8.2 10.2
BMI, body mass index; WC, waist circumference.
*BMI 85th to <95th percentiles of 2007 Korean National Growth Charts.
†BMI ≥95th percentiles of 2007 Korean National Growth Charts.
were higher compared to those of girls (P<0.001), but BMI was no difference between boys and girls (P=0.056).
The prevalence of overweight was 12.1% in boys and 10.5%
in girls. The prevalence of obesity was 11.0% in boys and 10.9% in girls. The prevalence of abdominal obesity, which means over 90th percentile of WC was 13.3% in boys and 8.2% in girls (Table 2). The prevalence of hypertension was 9.2% in boys and 10.2% in girls and the prevalence of prehy- pertension was 14.0% in boys and 9.0% in girls.
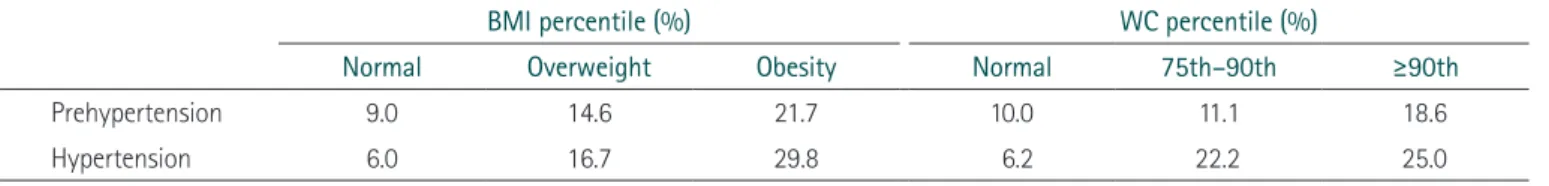
The prevalence of hypertension and prehypertension according to BMI and WC percentiles shows in Table 3. The prevalence of prehypertension was 9.0% in the normal BMI group, 14.6%
in the overweight group and 21.7% in the obese group and the prevalence of hypertension was 6.0% in the normal BMI group, 16.7% in the overweight group and 29.8% in the obese group.
Based on WC percentile, the prevalence of prehypertension was 10.0% in the normal group, 11.1% in the 75th to 90th percen- tile group and 18.6% in ≥90th percentile group and the preva- lence of hypertension was 6.2% in the normal group, 22.2% in the 75th to 90th percentile group and 25.0% in ≥90th per-
centile group.
In addition, the distribution of hypertension according to BMI and WC percentiles shows the relationship of obesity with high BP. The more BMI percentiles increased, the prevalence of hy- pertension increased (Fig. 1). Similarly, the more WC percen- tiles increased, the prevalence of hypertension increased (Fig.
Table 3. The prevalence of hypertension according to BMI and WC percentiles
BMI percentile (%) WC percentile (%)
Normal Overweight Obesity Normal 75th–90th ≥90th
Prehypertension 9.0 14.6 21.7 10.0 11.1 18.6
Hypertension 6.0 16.7 29.8 6.2 22.2 25.0
BMI, body mass index; WC, waist circumference.
100
80
60
40
20
>95 Body mass index percentile
0
Normal Hypertension (%)
85 95 50 85
25 50 10 25
<10 (%)
Fig. 1. The distribution of hypertension according to body mass index
percentiles. Fig. 2. The distribution of hypertension according to waist circumfer-
ence percentiles.
100
80
60
40
20
>90 Waist circumference percentile
0
Normal Hypertension (%)
75 90 50 75
25 50 10 25
<10 (%)
40
20
0
Systolic HTN Diastolic HTN (%)
Normal Overweight Obesity
Fig. 3. The prevalence of systolic hypertension (HTN) vs. diastolic HTN according to weight.
2). The prevalence of hypertension was markedly increased, especially in above 85th percentile of BMI and above 75th percentile of WC. Increase in BMI and WC is associated with increase in the prevalence of hypertension.
The prevalence of systolic hypertension was 3.6% in the nor- mal group, 12.5% in the overweight group and 29.8% in the obese group (P<0.05). But, the prevalence of diastolic hyper- tension was 3.3% in normal group, 6.3% in overweight group and 4.3% in obesity group (P=0.305). The results shows that obesity affects systolic BP more than diastolic BP (Fig. 3).
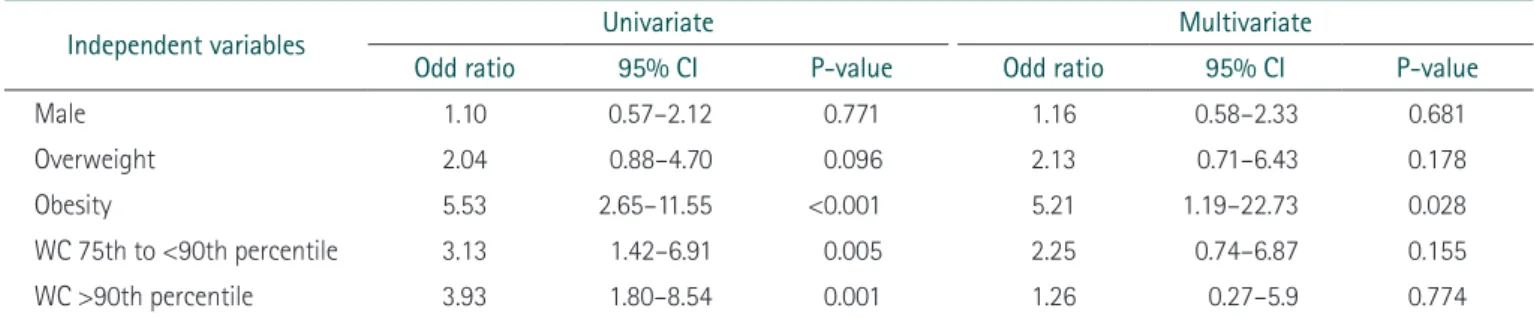
We used logistic regression analysis to obtain odds ratio and to assess the association between obesity and hypertension (Table 4). In univariate analysis, the significant risk factors of hypertension were obesity and above 75th percentile of WC.
The risk of hypertension was 5.53 times higher with obesity, 2.04 times higher with overweight and 3.93 times higher in above 90th percentile of WC. In multivariate analysis, obesity was significantly risk factor, which was 5.21 times higher in the prevalence of hypertension.
Discussion
The increasing prevalence of childhood obesity is a worldwide trend and becomes a significant public health problem [2,16].
The Global Burden of Disease 2013 Obesity Collaboration re- ported that the prevalence of overweight and obesity was rising among children and adolescents, increasing from 8.1% in 1980 to 12.9% in 2013 for boys and 8.4% to 13.4% in girls for 21 regions in 188 countries [7]. As Korea had been developing, obesity increased rapidly from 1979 to 2002 and the prevalence increased from 11.0% to 17.9% in boys and from 9.0% to 10.9% in girls [17]. And in Korean, the overall prevalence of
overweight and obese adolescents increased from 6.8% in 1998 to 10.0% in 2013 [1].
In our study similar results produced that the prevalence of overweight was 12.1% in boys and 10.5% in girls. And the prevalence of obesity was 11.0% in boys and 10.9% in girls.
This study provided data on the association of increased BMI and WC with high BP in adolescents from high school students.
As BMI percentiles increased, the prevalence of hypertension raised from 3.2% to 29.8% and most rapidly increased in the last highest 15 percentiles group, which showed over 5 times to 9 times higher. Similarly, children with BMI over 85th per- centile demonstrated that the risk of hypertension were 4-fold higher [18]. The prevalence of hypertensive range diastolic BP in normal versus obese BMI girls was 1.4% versus 12% and 3.5% versus 15.2% in boys, which represented significant as- sociation between obese and hypertensive BP [19]. As WC percentiles increased, the prevalence of hypertension increased 3.7% to 25% and showed the peak level in group where de- fined as abdominal obesity. Rosa et al. [20] also reported that there was a statistically significant association between WC and hypertension based on the prevalence ratios in Brazil with chil- dren and adolescents.
The results indicated that obesity or abdominal obesity ado- lescents were at a substantially increased prevalence of hyper- tension. The current study found that overweight, which odd ratio were 2.04 and 2.13, made the risk of hypertension twice higher and obesity, which odd ratio was 5.53 and 5.21, made the risk of hypertension 5 times higher. Dong et al. [7] reported that odd ratio were 4.1 in obese boys and 4.0 in obese girls, which meant overweight and obese children had about 4 times higher in prevalence of high BP than normal weight children.
Thus increased BMI and WC are good predictors of the risk of
Table 4. Logistic regression analysis of the factors related to hypertension
Independent variables Univariate Multivariate
Odd ratio 95% CI P-value Odd ratio 95% CI P-value
Male 1.10 0.57–2.12 0.771 1.16 0.58–2.33 0.681
Overweight 2.04 0.88–4.70 0.096 2.13 0.71–6.43 0.178
Obesity 5.53 2.65–11.55 <0.001 5.21 1.19–22.73 0.028
WC 75th to <90th percentile 3.13 1.42–6.91 0.005 2.25 0.74–6.87 0.155
WC >90th percentile 3.93 1.80–8.54 0.001 1.26 0.27–5.9 0.774
CI, confidence interval; WC, waist circumference.
development of hypertension in adolescents. As a results, two variables are clinical useful points in risk identification of hy- pertension.
In addition, this present study findings indicated that the prev- alence of systolic BP appears, which were 12.5% in overweight group and 29.8% in obese group, were more than that of dia- stolic BP respectively 6.3% and 4.3%. Similarly, Sorof et al.
[21] reported that the prevalence of systolic BP were higher than that of diastolic BP in obesity group. In the same study, the prevalence of isolated systolic hypertension among adolescents who were both obese and had BP above the 95th percentile was 94%.
Limitation of this study was that BP was measured with au- tomated oscillometric device which could be prone to errors when there were too much patient arm movement or the use of inappropriate cuff size. Another limitation was white coat effect, which is a phenomenon that BP level is above the normal range when measuring with personnel wearing white coats in a clinical setting than when taken at home [22,23].
Overweight and obesity in childhood had a significant impact on physical health and associated with the development of hy- pertension, which could lead to cardiovascular diseases including coronary artery disease, cerebrovascular disease, renal insuffi- ciency, atherosclerosis, left ventricular hypertrophy, atrial fibril- lation, and congestive heart failure [12,24,25].
In conclusion, this study emphasized the importance of check BMI, WC, and BP regularly in order to assess the risk of hy- pertension and follow up carefully. Anthropometric data which are very non-invasive way can be used to recognize the status of children at risk of hypertension. Hypertension is not only an adult disease but also can become children disease which are a potential state at present. Furthermore, we should make efforts to make preventive strategies of adolescent obesity to avoid a future unfavorable epidemic of adult cardiovascular disease. Fur- ther study is required to assess the effect of preventive strategies and to find other risk factors of hypertension among Korean children and adolescents.
References
1. Ha KH, Kim DJ. Epidemiology of childhood obesity in Korea.
Endocrinol Metab (Seoul) 2016;31:510-518.
2. Falkner B. Hypertension in children and adolescents: epidemiol- ogy and natural history. Pediatr Nephrol 2010;25:1219-1224.
3. Ng M, Fleming T, Robinson M, Thomson B, Graetz N, Margono C, et al. Global, regional, and national prevalence of overweight and obesity in children and adults during 1980-2013: a system- atic analysis for the Global Burden of Disease Study 2013. Lancet 2014;384:766-781.
4. Ramachandran A, Snehalatha C. Rising burden of obesity in Asia. J Obes 2010;2010:868573.
5. Hansen ML, Gunn PW, Kaelber DC. Underdiagnosis of hyper- tension in children and adolescents. JAMA 2007;298:874-879.
6. Chiolero A, Madeleine G, Gabriel A, Burnier M, Paccaud F, Bovet P. Prevalence of elevated blood pressure and association with overweight in children of a rapidly developing country. J Hum Hypertens 2007;21:120-127.
7. Dong B, Ma J, Wang HJ, Wang ZQ. The association of overweight and obesity with blood pressure among Chinese children and adolescents. Biomed Environ Sci 2013;26:437-444.
8. Souza MG, Rivera IR, Silva MA, Carvalho AC. Relationship of obesity with high blood pressure in children and adolescents.
Arq Bras Cardiol 2010;94:714-719.
9. Falkner B, Gidding SS, Ramirez-Garnica G, Wiltrout SA, West D, Rappaport EB. The relationship of body mass index and blood pressure in primary care pediatric patients. J Pediatr 2006;148:195-200.
10. Update on the 1987 Task Force Report on High Blood Pressure in Children and Adolescents: a working group report from the National High Blood Pressure Education Program. National High Blood Pressure Education Program Working Group on Hypertension Control in Children and Adolescents. Pediatrics 1996;98(4 Pt 1):649-658.
11. Vasan RS, Larson MG, Leip EP, Evans JC, O’Donnell CJ, Kannel WB, et al. Impact of high-normal blood pressure on the risk of cardiovascular disease. N Engl J Med 2001;345:1291-1297.
12. Re RN. Obesity-related hypertension. Ochsner J 2009;9:133-136.
13. Sweeting HN. Measurement and definitions of obesity in child- hood and adolescence: a field guide for the uninitiated. Nutr J 2007;6:32.
14. Xi B, Mi J, Zhao M, Zhang T, Jia C, Li J, et al. Trends in abdomi- nal obesity among U.S. children and adolescents. Pediatrics 2014;134:e334-e339.
15. Lee CG, Moon JS, Choi JM, Nam CM, Lee SY, Oh K, et al. Norma- tive blood pressure references for Korean children and adoles- cents. Korean J Pediatr 2008;51:33-41.
16. Sorof J, Daniels S. Obesity hypertension in children: a problem of epidemic proportions. Hypertension 2002;40:441-447.
17. Park YS, Lee DH, Choi JM, Kang YJ, Kim CH. Trend of obesity in school age children in Seoul over the past 23 years. Korean J Pediatr 2004;47:247-257.
18. Tu W, Eckert GJ, DiMeglio LA, Yu Z, Jung J, Pratt JH. Intensified effect of adiposity on blood pressure in overweight and obese children. Hypertension 2011;58:818-824.
19. Oduwole AA, Ladapo TA, Fajolu IB, Ekure EN, Adeniyi OF. Obe- sity and elevated blood pressure among adolescents in Lagos, Nigeria: a cross-sectional study. BMC Public Health 2012;12:616.
20. Rosa ML, Mesquita ET, da Rocha ER, Fonseca VM. Body mass index and waist circumference as markers of arterial hyperten- sion in adolescents. Arq Bras Cardiol 2007;88:573-578.
21. Sorof JM, Poffenbarger T, Franco K, Bernard L, Portman RJ. Iso- lated systolic hypertension, obesity, and hyperkinetic hemody- namic states in children. J Pediatr 2002;140:660-666.
22. Ramli A, Halmey N, Teng C. White coat effect and white coat hypertension: one and the same? Malays Fam Physician 2008;3:
158-161.
23. Jurko A Jr, Minarik M, Jurko T, Tonhajzerova I. White coat hyper- tension in pediatrics. Ital J Pediatr 2016;42:4.
24. Dehghan M, Akhtar-Danesh N, Merchant AT. Childhood obesity, prevalence and prevention. Nutr J 2005;4:24.
25. Barnes VA, Orme-Johnson DW. Clinical and pre-clinical applica- tions of the transcendental meditation program in the preven- tion and treatment of essential hypertension and cardiovascular disease in youth and adults. Curr Hypertens Rev 2006;2:207-218.