J Intell Inform Syst 2014 December: 20(4): 43~58 http://dx.doi.org/10.13088/jiis.2014.20.4.43
An Optimized Combination of π-fuzzy Logic and Support Vector Machine for Stock Market Prediction
Tuanhung Dao
Post-doc Researcher, Graduate School of Business IT, Kookmin University
(E-mail. [email protected])
Hyunchul Ahn
Associate Professor, Graduate School of Business IT, Kookmin University
(E-mail. [email protected])
․․․․․․․․․․․․․․․․․․․․․․․․․․․․․․․․․․․․․․․․․․․․․․․․․․․․․․․․․․․․․․․․․․․․․․․․․․․․․․․․․․․․․․
As the use of trading systems has increased rapidly, many researchers have become interested in developing effective stock market prediction models using artificial intelligence techniques. Stock market prediction involves multifaceted interactions between market-controlling factors and unknown random processes. A successful stock prediction model achieves the most accurate result from minimum input data with the least complex model. In this research, we develop a combination model of π-fuzzy logic and support vector machine (SVM) models, using a genetic algorithm to optimize the parameters of the SVM and π-fuzzy functions, as well as feature subset selection to improve the performance of stock market prediction. To evaluate the performance of our proposed model, we compare the performance of our model to other comparative models, including the logistic regression, multiple discriminant analysis, classification and regression tree, artificial neural network, SVM, and fuzzy SVM models, with the same data. The results show that our model outperforms all other comparative models in prediction accuracy as well as return on investment.
Keyword : Stock market prediction, Trading systems, π-fuzzy logic, Support vector machine, Genetic algorithm
․․․․․․․․․․․․․․․․․․․․․․․․․․․․․․․․․․․․․․․․․․․․․․․․․․․․․․․․․․․․․․․․․․․․․․․․․․․․․․․․․․․․․․
Received : December 6, 2014 Revised : December 12, 2014 Accepted : December 16, 2014 Type of Submission : Concise Paper Corresponding Author : Hyunchul Ahn
1. Introduction
Financial forecasting, particularly stock market prediction, is an important topic for researchers because of its commercial applications and the attractive benefits it offers (Majhi et al., 2009). The stock market is naturally non-linear.
Stock prediction plays an important role in determining the performance of the stock business.
Hence, for many years, researchers have been greatly attracted to forecasting stock returns or
stock indexes (Debashish and Mohamad, 2013).
Many artificial intelligent techniques have been used to uncover the nonlinearity, but, as in any other field, stock prediction is always a challenging and daunting practice. To predict the nonlinear variables, a large amount of data collection and nonlinear analysis modeling techniques are required to produce information.
Fuzzy logic extends the two-valued logic of
“true” and “false” to many-valued logic, in which
there are more than two truth values with different
degrees of truth ranging from 0 to 1. A fuzzy logic system may be less precise than conventional systems, but is more like our everyday experiences and is meaningful for humans describing real- world situations. Fuzzy logic is suitable for describing nonlinearity in, for example, financial or stock variables. Thus, some studies have attempted to adopt the concept of fuzziness when applying technical indicators to predict the financial market (Mohammadian and Kingham, 2004).
When applying the π-fuzzy function, the values of independent variables are expressed by more than one dimension. In other words, fuzzification extends the variable dimensions n times. Therefore, it could create too many variables as inputs of the prediction model. In this case, appropriate variable selection (i.e., feature selection) could improve the prediction performance.
This study proposes a binary classification model that combines the π-fuzzy logic and support vector machine (SVM) models for stock market prediction. To enhance the prediction quality of the model, a genetic algorithm (GA) is used to find the optimized values of the parameters and to optimize the feature selection. The performance of the proposed model is compared to comparative models such as the logistic regression (LOGIT), multiple discriminant analysis (MDA), classification and regression tree (CART), artificial neural network (ANN), SVM, and fuzzy SVM models.
The rest of this paper consists of four sections: The next section reviews the theoretical background of stock market prediction and provides
a brief summary of SVM, π-fuzzy logic, and GA.
Section 3 explains the architecture of the proposed prediction model, followed by the empirical validation section, where the experiment is explained in detail with the test results. The last section is the conclusion, in which the results are evaluated and analyzed. Limitations and future research directions are also discussed in this section.
2. Theoretical Background
2.1 Stock Market Prediction
Stock market prediction has attracted researchers for years. Even though more and more money is being invested in the stock market, investors are still anxious about the future trends of stock prices in the market. The most common concern of investors is how to determine the proper time to buy/sell or hold their shares.
Unfortunately, stock market prediction is challenging because stock indices are dynamic, nonlinear, complicated, nonparametric, and chaotic in nature (Tan et al., 2005). The recent trend is to develop adaptive models, which can be divided into statistical and soft-computing models, for forecasting financial data (Majhi et al., 2009). New advances in soft-computing techniques offer useful tools for forecasting noisy environments like stock markets, capturing their nonlinear behavior (Atsalakis and Valavanis, 2009).
Stock market prediction authors have obtained
data for training and testing their proposed models.
They have used input data indexes from well- developed markets in Europe, North America (Kanas and Yannopoulos, 2001; Lendasse et al., 2000; Rodriguez et al., 2000; Rodriguez et al., 2004), indexes for forecasting emerging markets (Constantinou et al., 2006; Koulouriotis, 2005;
Yumlu et al., 2004, 2005), or independent stocks or portfolios of stocks (Atsalakis and Valavanis, 2006; Steiner and Wittkemper, 1997).
Data mining techniques have also been used previously. Chang et al. (2009) proposed an integrated system, CBDWNN, by combining dynamic time windows, case-based reasoning (CBR), and neural networks (NN) for stock trading prediction. The empirical results show that CBDWNN overtakes models that use CBR or BPN alone. An improved bacterial chemotaxis optimization (IBCO), integrated into the backpropagation (BP) artificial neural network forecasting model by Yudong and Lenan (2009) showed better performance than other methods in terms of learning ability and generalization. Ahn and Lee (2009) combined several techniques (LR, ANN, SVM) and then used GA to find the optimized combination weights of each technique to improve the accuracy of the up/down direction prediction of the Korean Composite Stock Price Index (KOSPI). Kim and Ahn (2011) used GA to optimize the instance selection process with simultaneous parameter optimization. The ISVM model (SVM with instance selection) was compared to several other comparative models, including LOGIT, backpropagation neural networks (BPN), nearest neighbor (1-NN),
conventional SVM, and SVM with optimized parameters (PSVM), to prove its outstanding performance. An intelligent trading system created by Kim and Ahn (2010) was designed to use both technical indicators and other non-price variables of the market. It adopts a “two-threshold mechanism”
to transform the outcome of the stock market prediction model based on SVM to trading decision signals like buy, sell, or hold. The proposed system outperformed the other comparative models from the perspective of “rate of return.”
Even though many different techniques have been applied to improve the quality of the prediction process, the nonlinear, complicated, but attractive nature of the stock market is still challenging to researchers.
2.2 Support Vector Machines
In machine learning, support vector machines
(SVMs), also called support vector networks
(Cortes and Vapnik, 1995) are supervised learning
models with associated learning algorithms that
analyze data and recognize patterns; they are used
for classification and regression analysis. Given a
set of training examples, each example is marked
as belonging to one of two categories. An SVM
model using a training algorithm learns from the
training examples set so that it can assign new
examples to the appropriate category. An SVM
model presents examples as points in space,
mapping them so that the examples of the separate
categories are divided by a clear gap that is as
wide as possible. New examples are then mapped
into that same space and are predicted to belong to a category based on which side of the gap they fall on.
SVM is mainly used for classification and regression. In addition to performing linear classification, SVMs can efficiently perform non-linear classification using a class of algorithms for pattern analysis called the kernel trick, implicitly mapping their inputs into high-dimensional feature spaces.
SVM has been successfully used to predict the financial or trading system (Ahn and Lee, 2009; Kim and Ahn, 2010; Kim and Ahn, 2011).
2.3 π-Fuzzy Logic
In traditional or Aristotelian logic, there are only two possible values (i.e., “true” and “false”) for any proposition. This classical two-valued logic may be extended to n-valued logic, where n is greater than 2, or infinite-valued (infinitely many-valued) logic. The term “fuzzy logic” was first introduced with Zadeh’s (1965) proposal of fuzzy set theory. Fuzzy logic is a form of many-valued logic, in which there are more than two truth values. Fuzzy logic deals with reasoning that is approximate rather than fixed and exact.
The goal of this approach is to imitate the aspect of human cognition, also called approximate reasoning. Fuzzy systems may be less precise than conventional systems but are more like our everyday experiences and are meaningful for human describing real-world situations and their explanations. Fuzzy logic variables may have a truth value that ranges in degree between 0 and 1.
Fuzzy logic has been extended to handle the concept of partial truth, where the truth value may range between completely true and completely false (Novák et al., 1999). Fuzzy logic has been applied to many fields, from control theory to artificial intelligence. Additionally, when linguistic variables are used, these degrees may be managed by specific membership functions.
π -fuzzy logic uses the π-fuzzy function with linguistic terms {low, medium, high} to assign membership values for independent variables. The π -fuzzy function, with range [0,1] is defined as follows (Pal and Pramanik, 1986):
; ,
2 1 | |
2
1 2 1 | |
0 2
0
where F
jis the j
thinput value of an object u with n-dimensional features, and λ > 0 is the radius of the π-fuzzy function with c as the central point.
Note that when F
jlies at the central point c, then |F
j- c| = 0 and its membership value is the maximum, that is, π(F
j;c,λ) = 1. The membership value of a point decreases with its distance from the central point c, that is, . When , the membership value of F
jis 0.5, which is called a crossover point. Therefore, a fuzzy set with membership function π(F
j;c,λ) represents a set of points clustered around c.
If F
jmaxand F
jmindenote the upper and lower
bounds of the dynamic range of input value F
j, then the three linguistic terms are defined as follows:
1
2
1
0.5
1
0.5
where f
denomis a parameter controlling the extent of overlapping.
Figure 1 depicts the overlapping structure of the three π-functions for a particular input value F
j. In this way, the object with n-dimensional features can be expressed with 3n-dimensional membership values. Each independent variable value is determined by one of the three linguistic terms low, medium, or high.
0 0.2 0.4 0.6 0.8 1 1.2
Fj min Clow(Fj) Cmedium(Fj) Chigh(Fj) Fj max
medium(Fj)
low(Fj) / 2 high(Fj) / 2
<Figure 1> Overlapping structure of the π-functions for the linguistic terms low, medium,
and high
In the defuzzification process, the fuzzy rules are applied to a fuzzified independent variable for classification. The application of fuzzy rules is different from that of non-fuzzy classification rules. When non-fuzzy rules are applied, an object is classified into one class.
However, when fuzzy rules are applied, many rules can be applied to an object at the same time;
therefore, that object could be classified into different classes with different degrees.
2.4 Genetic Algorithm
In artificial intelligence, GA is the most popular type of evolutionary algorithm (EA). GA is a search technique used in computing to find the exact or approximate solutions to optimization and search problems. GA uses techniques inspired by evolutionary biology, such as inheritance, mutation, selection, and crossover. At its heart lies Charles Darwin’s simple, powerful insight: that the random chance of variation, coupled with the law of selection, is a problem-solving technique of immense power and nearly unlimited application (Marczyk, 2004).
Similar to other techniques, GA has strengths and weaknesses, but it is one of the most appropriate techniques for optimization. Although the calculation is time consuming, it normally provides high accuracy. In the same way, GA can
“home in” on the space with the highest-fitness
individuals and find the overall best one from that
group. In the context of EA, this is known as the
Schema Theorem, and it is GA’s “central advantage”
over other problem-solving methods (Goldberg, 1989; Holland, 1992; Mitchell, 1996). GA has been successfully applied to a variety of optimization problems such as real-world teacher volunteer transfer problems (Chen et al., 2015), BPN (Huang et al., 2015), small and medium-sized enterprise bankruptcy prediction (Gordini, 2014), and a passive vibration absorber for a barrel (Esen and Koç, 2015).
3. Research Model
In many research papers, there has been an issue of integration of traditional methods and artificial intelligence (AI) methods. Traditional quantitative methods have been viewed as an independent area and progressed in parallel.
Researchers have paid attention to the integration and competition between quantitative methods and AI (Lee, 1990). Various studies have integrated traditional methods and AI to build their research models (Jhee and Lee, 1993; Liang et al., 1990).
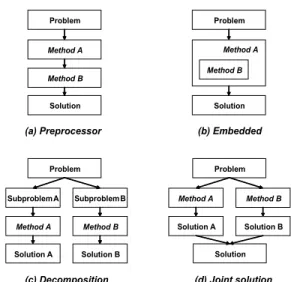
As a result, the three-architecture model, one of the most commonly used schemas for integration, was suggested. It proposed three types of integration models: (1) loosely coupled or distributed, (2) tightly coupled, and (3) embedded or full integration (Medsker and Turban, 1994).
Figure 2 shows the four types of integration methodology, expanded from the three-architecture model (Jo, 1999):
Problem Method A Method B Solution
Problem
Method A Method B
Solution
Problem SubproblemA
Method A Solution A
SubproblemB Method B Solution B
Problem
Solution Method A Solution A
Method B Solution B
(a) Preprocessor (b) Embedded
(c) Decomposition (d) Joint solution
<Figure 2> Four types of integration models
In this paper, we propose a combination of model types A (preprocessor) and B (embedded) to form our research model, which is depicted in Figure 3:
<Figure 3> Research model architecture
As shown in Figure 3, the data are divided
into a training dataset and a hold-out dataset. The
training dataset is used in the training phase, where
π -fuzzy logic and SVM are used as preprocessors,
and embedded GA is used to find the optimized
values of f
denom, C, and σ
2. When applying the π
Code Indicator name Description Formula F1 Stochastic%K Stochastic %K. It compares where a security’s
price closed relative to its price range over a given time period.
100
where
LL and t HH mean lowest low and thighest high in the last t days respectively.
F2 Stochastic %D Stochastic %D. Moving average of %K. ∑ %
F3 Stochastic Slow %D
Stochastic slow %D. Moving average of %D. ∑ %
F4 Momentum It measures the amount that a security’s price has changed over a given time span.
F5 ROC Price Rate-of-Change. It displays the difference between the current price and the price n days ago.
100
F6 Williams’ %R Larry William’s %R. It is a momentum indicator
that measures overbought/oversold levels. 100 F7 A/D Oscillator Accumulation/Distribution Oscillator. It is a
momentum indicator that associates changes in price.
<Table 1> Selected technical indicators -fuzzy function, the values of independent
variables are determined by three linguistic terms low, medium, or high. As a result, fuzzification extends the variable dimensions by three times. To improve the prediction performance, GA is also used to find the optimized feature selection. The hold-out dataset is used in the validation phase.
The optimized parameters and selection of features determined in the training phase are used to validate the prediction results of the model.
4. Empirical Validation
4.1 Experimental Data Set
The data used in this study consist of 2,210
daily observations of the KOSPI 200. It covers a 10-year period, from January 2, 2004, to December 30, 2013. The dependent variable is set to the direction of daily price change in the KOSPI 200, and the technical indicators are used as the independent variables. This study uses 12 technical indicators selected by the prior research (Kim and Ahn, 2012). Descriptions of the selected indicators are presented in Table 1.
The data were divided into two subsets:
training and hold-out datasets. The data from 2004
to 2011 (1,778 samples, about 80%) were used as
the training dataset, and the data from the
remaining two, more recent, years (493 samples,
about 20%) used as the hold-out dataset. Table 2
shows the number of cases for the training and
Code Indicator name Description Formula F8 Disparity5 5-day disparity. It means the distance of current
price and the moving average of 5 days. 100 F9 Disparity10 10-day disparity.
100 F10 OSCP Price Oscillator. It displays the difference
between two moving averages of a security’s price.
F11 CCI Commodity Channel Index. It measures the variation of a security’s price from its statistical mean.
0.015
where means 3 ,
is
∑
, and
means ∑
. F12 RSI Relative Strength Index. It is a price
following an oscillator that ranges from 0 to 100.
100 100
1 ∑
∑
where means Upward-price-change and means Downward-price-change at time t.
where
: Closing price at time t,
: Low price at time t,
: High price at time t,
: Moving average of t days
Value of the Dep. Var.
Training Hold-out
2004 2005 2006 2007 2008 2009 2010 2011 2012 2013 Sum
Decline(0) 113 100 109 102 122 112 110 121 122 130 1,141
Rise(1) 113 100 109 102 122 112 110 121 124 117 1,130
Total 226 200 218 204 244 224 220 242 246 247 2,271
<Table 2> Number of cases in each year
hold-out datasets in each year. As shown here, the portions of the rise and decline in the training dataset were set to be the same using random sampling.
4.2 Experimental Design
For the controlling parameters of the GA search, the population size is set to 100 organisms, and the crossover and mutation rates are set at 0.5 and 0.1, respectively. As the stopping condition,
only 50 generations are permitted.
The experimental system was developed using LIBSVM v2.8 (Chang and Lin, 2011), Evolver v5.5, and Microsoft Visual Basic for Applications (VBA). Evolver, a commercial software application, was used for implementing GA, and LIBSVM used for training SVM classifiers.
Application of the π-fuzzy function was implemented using VBA programming.
To evaluate the performance of the proposed
The optimized value of the kernel parameters in SVM
C
σ
219.3442 1.0562
The optimized value of the parameters in π -fuzzy function
fd01 fd02 fd03 fd04 fd05 fd06
1.2313 0.7384 1.1798 1.1595 0.7836 1.4722
fd07 fd08 fd09 fd10 fd11 fd12
1.3519 0.7429 1.1552 1.4965 1.1330 1.3920
The optimized feature subset selection (1: selected / 0: not selected)
F1_low F1_med F1_high F2_low F2_med F2_high
0 1 1 1 1 1
F3_low F3_med F3_high F4_low F4_med F4_high
1 0 1 1 1 1
F5_low F5_med F5_high F6_low F6_med F6_high
1 0 1 1 1 1
F7_low F7_med F7_high F8_low F8_med F8_high
1 1 1 0 0 0
F9_low F9_med F9_high F10_low F10_med F10_high
1 1 0 1 1 1
F11_low F11_med F11_high F12_low F12_med F12_high
0 1 1 0 1 1
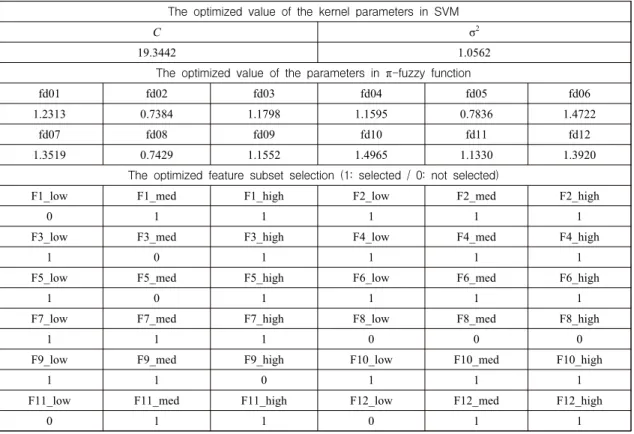
<Table 3> Optimized values of the parameters and feature subset selection model, we compare the performances of our model
to other comparative models using LOGIT, MDA, CART, ANN, SVM, and fuzzy SVM on the same data. LOGIT, MDA, and CART are tested using IBM SPSS Statistics 20, and ANN using Neuroshell2. SVM and fuzzy SVM are tested using LIBSVM v2.8 (Chang and Lin, 2011). In case of fuzzy SVM, we apply three values (0.5, 1.0, and 1.5) of f
denom, and select the value that shows the best performance.
4.3 Experimental Results
Table 3 shows the values of the parameters
and the feature subset selection finally selected by GA in our proposed model. Table 4 describes the average prediction accuracies of the proposed model and other comparative models. As shown in Table 4, our proposed model outperforms all the others. In detail, it achieves prediction accuracy higher than LOGIT, MDA, CART, ANN, SVM, and fuzzy SVM by 9.13%, 10.14%, 10.95%, 4.26%, 2.84%, and 2.63%, respectively, for the hold-out dataset.
We used the two-sample test for proportions
to examine whether the differences of prediction
accuracy between the proposed model and other
comparative algorithms are statistically significant.
Model Training Test Hold-out Settings
LOGIT 52.87% 51.72% Backward selection
MDA 53.04% 50.71% Stepwise selection
CART 53.09% 49.90% Gini index, Max. difference in risk=0,
Max. tree depth=5
ANN 53.95% 50.43% 56.59% # of the nodes in the hidden layer=26
SVM 59.11% 58.01% Gaussian RBF kernel, C=33, σ
2=75
FuzzySVM 84.59% 58.22%
fdenom=1.0, Gaussian RBF kernel, C=10, σ2=1
Proposed
Model 88.08% 60.85% Gaussian RBF kernel, C =19.344, σ
2=1.0562,
# of the selected features=27
<Table 4> Prediction accuracy of the models
MDA CART ANN SVM FuzzySVM Proposed Model
LOGIT 0.3186 0.5733 -1.5339** -1.9839** -2.0483** -2.8891***
MDA 0.2548 -1.8520** -2.3017*** -2.3661*** -3.2062***
CART -2.1063*** -2.5557*** -2.6201*** -3.4595***
ANN -0.4507 -0.5152 -1.3584**
SVM -0.0645 -0.9080*
FuzzySVM -0.8435*
* statistical significant at 10%, ** statistical significant at 5%, *** statistical significant at 1%
<Table 5> Z values of the two-sample test for proportions By applying this test, it is possible to check
whether there is a difference between two probabilities when the prediction accuracy of the left-vertical methods is compared with the right- horizontal methods (Harnett and Soni, 1991). In this test, the null hypothesis is H
0: p
i– p
j= 0 where i=1,…,6 and j=2,…,7, while the alternative hypothesis is H
a: p
i– p
j> 0 where i=1,…,6 and j=2,…,7. p
kmeans the classification performance of the kth method. Table 5 shows Z values for the pairwise comparison of the models’ performance.
As presented in Table 5, the proposed model outperforms LOGIT, MDA, and CART at the 1%
statistical significance level, ANN at the 5%
statistical significance level, and SVM and fuzzy SVM at the 10% statistical significance levels.
Thus, we can conclude that the application of π -fuzzy logic and GA optimization has the potential to improve the accuracy of stock market prediction based on SVM.
Although it is important to accurately predict the directions of the stock market, it is more important to yield better ROI using the prediction model in the trading systems domain.
For this reason, we apply our model and other
comparative models to the hold-out dataset, and
Models Total ROI (from 2012 to 2013)
Average ROI
(per year) Number of trading transactions
Benchmark* 10.70% 5.35% 1
LOGIT 16.40% 8.20% 45
MDA 13.81% 6.90% 33
CART 11.55% 5.78% 32
ANN 30.84% 15.42% 66
SVM 33.71% 16.85% 71
FuzzySVM 38.43% 19.21% 113
Proposed Model 58.91% 29.45% 112
* Benchmark strategy: Buy at the beginning and sell at the end of the period
<Table 6> ROI rates for the hold-out dataset
simulate trading transactions according to the signals from these models in order to measure their ROIs. Table 6 depicts the ROIs of each model. As shown in Table 6, our proposed model was found to provide the highest ROI: 29.45% per year on average. The yearly ROI of our model is more than 10% higher than the second-best (fuzzy SVM, 19.21%), and more than 24% higher than the benchmark strategy (5.35%).
5. Conclusion
In this study, we have proposed a new hybrid SVM model using π-fuzzy logic and GA.
Our proposed model optimizes the feature selection, kernel, and π-fuzzy parameters simultaneously. In order to validate the usefulness of our model, we applied it to a Korean stock market dataset covering 10 years. As a result, we found that our proposed model showed higher prediction accuracy and ROI than other conventional models such as
LOGIT, MDA, CART, ANN, SVM, and fuzzy SVM. In particular, the ROI of our model was found to be more than five times higher than the benchmark strategy. The synergy between π-fuzzy logic’s information expansion and GA’s effective information filtering via appropriate feature selection seems to be the reason that our proposed model leads to better prediction accuracy. Because of our proposed model’s high accuracy capability, we expect that investors using trading systems would adopt it willingly.
However, this study has some limitations.
First, our model requires a high level of computational resources. Similar to other GA-based optimization models, our model iterates the SVM training process when genetic evolutions occur. In particular, the search space of our model is very large, so it takes more time to get enough training.
Consequently, efforts to make the training of our model more efficient should be undertaken in the future.
Second, other factors may enhance the
performance of our model. For example, although GA in our model only optimizes feature subset selection, appropriate instance selection may also improve the performance according to prior studies (Kim and Ahn, 2011). Thus, we believe that more work is necessary to incorporate instance selection in the future.
Third, the general applicability of the proposed model should be tested further. Although we applied our model to stock market prediction in this study, it can be applied to any domain that requires accurate prediction. Thus, it is necessary to validate the generalizability of the proposed model by applying it to other problem domains in the future.
References
Ahn, H. and H. Y. Lee, “A combination model of Multiple Artificial Intelligence techniques based on Genetic Algorithms for Investment Decision Support Aid: An Application to KOSPI”, The e-Business Studies, Vol.10, No.1 (2009), 215~236.
Atsalakis, G. and K. Valavanis, “Neuro-fuzzy and technical analysis for stock prediction,”
Working paper, 2006.
Atsalakis, G. S. and K. P. Valavanis, “Surveying stock market forecasting techniques – Part II: Soft computing methods”, Expert Systems with Applications, Vol.36, No.3(2009), 5932~
5941.
Chang, C.-C. and C.-J. Lin, “LIBSVM: a library for support vector machines”, ACM Transactions
on Intelligent Systems and Technology, Vol.2, No.3(2011), 27:1~27:27. Software available at http://www.csie.ntu.edu.tw/~cjlin/libsvm.
Chang, P.-C., C.-H. Liu, J.-L. Lin, C.-Y. Fan, and C. S. P. Ng, “A neural network with a case based dynamic window for stock trading prediction”, Expert Systems with Applications, Vol.36, No.3(2009), 6889~6898.
Chen, C.-H., T.-K. Liu, J.-H. Chou, C.-H. Tasi, and H. Wang, “Optimization of teacher volunteer transferring problems using greedy genetic algorithms”, Expert Systems with Applications, Vol.42, No.1(2015), 668~678.
Constantinou, E., R. Georgiades, A. Kazandjian, and G. P. Kouretas, “Regime switching and artificial neural network forecasting of the Cyprus Stock Exchange daily returns”, International Journal of Finance and Economics, Vol.11, No.4(2006), 371~383.
Cortes, C. and V. Vapnik, "Support-vector networks", Machine Learning, Vol.20, No.3(1995), 273~
297
Debashish D. and S. U. Mohammad, “Data mining and Neural network techniques in Stock market prediction: A methodological review”, International Journal of Artificial Intelligence
& Applications (IJAIA), Vol.4, No.1(2013), 117~127.
Esen, I. and M. A. Koç, “Optimization of a passive vibration absorber for a barrel using the genetic algorithm”, Expert Systems with Applications, Vol.42, No.2(2015), 894~905.
Goldberg, D., Genetic algorithms in search, optimization, and machine learning, Addison –Wesley, 1989.
Gordini, N., “A genetic algorithm approach for
SMEs bankruptcy prediction: Empirical
evidence from Italy”, Expert Systems with Applications, Vol.41, No.14(2014), 6433~6445.
Harnett, D. L. and A. K. Soni, Statistical methods for business and economics, Addison-Wesley.
Massachusetts, MA, (1991).
Holland, J. H., “Genetic Algorithms”, Scientific American, Vol.267, No.1(1992), 66~72.
Huang, H.-X., J.-C. Li, and C.-L. Xiao, “A proposed iteration optimization approach integrating backpropagation neural network with genetic algorithm”, Expert Systems with Applications, Vol.42, No.1(2015), 146~155.
Jhee, W. C. and J. K. Lee, “Performance of Neural networks in managerial forecasting”, Intelligent Systems in Accounting, Finance, and Management, Vol.2, No.1(1993), 55~71.
Jo, H., “The integrated methodology of artificial intelligence and statistical methods for bankruptcy prediction,” Ph.D. Dissertation, Dept. of Management Engineering, KAIST, 1999.
Kanas, A. and A. Yannopoulos, “Comparing linear and nonlinear forecasts for stock returns”, International Review of Economics and Finance, Vol.10, No.4(2001), 383~398.
Kim, K.-j. and H. Ahn, “Optimization of Support Vector Machines for Financial Forecasting”, Journal of Intelligence and Information Systems, Vol.17, No.4(2011), 241~254.
Kim, K.-j., and H. Ahn, “Simultaneous optimization of artificial neural networks for financial forecasting”, Applied Intelligence, Vol.36, No.4(2012), 887~898.
Kim, S.-W. and H. Ahn, “Development of an Intelligent Trading System Using Support Vector Machines and Genetic Algorithms”,
Journal of Intelligence and Information Systems, Vol.16, No.1(2010), 71~92.
Koulouriotis, D. E., I. E. Diakoulakis, D. M.
Emiris, and C. D. Zopounidis, “Development of dynamic cognitive networks as complex systems approximators: Validation in financial time series”, Applied Soft Computing, Vol.5, No.2(2005), 157~179.
Lee, J. K., “Integration and competition of AI with quantitative methods for decision support”, Expert Systems with Applications, Vol.1, No.4(1990), 329~333.
Lendasse, A., E. de Bodt, V. Wertz, and M.
Verleysen, “Non-linear financial time series forecasting – Application to the Belgium 20 Stock Market Index”, European Journal of Economical and Social Systems, Vol.14, No.1(2000), 81~91.
Liang, T.-P., J. S. Chandler, and I. Han,
“Integrating statistical and inductive learning methods for knowledge acquisition”, Expert Systems with Applications, Vol.1, No.4(1990), 391~401.
Majhi, R., G. Panda, B. Majhi, and G. Sahoo,
“Efficient prediction of stock market indices using adaptive bacterial foraging optimization (ABFO) and BFO based techniques”, Expert Systems with Applications, Vol.36, No.6 (2009), 10097~10104.
Marczyk, A., Genetic algorithms and evolutionary computation, The TalkOrigins Archive, 2004.
Available at http://www.talkorigins.org/faqs/
genalg/genalg.html (Downloaded 1 November, 2014).
Medsker, L. and E. Turban, “Integrating expert
systems and neural computing for decision
support”, Proceedings of the Twenty-Seventh
Hawaii International Conference on System Sciences, (1994), 656~665.
Mitchell, M., An Introduction to Genetic Algorithms, MIT Press, Massachusetts, 1998.
Mohammadian, M. and M. Kingham, “An adaptive hierarchical Fuzzy logic system for modelling of Financial Systems”, Intelligent Systems in Accounting, Finance and Management, Vol.12, No.1(2004), 61~82.
Novák, V., I. Perfilieva, and J. Močkoř, Mathematical Principles of Fuzzy Logic, Kluwer Academic, Dordrecht, 1999.
Pal, S. K. and P. K. Pramanik, “Fuzzy measures in determining seed points in clustering”, Pattern Recognition Letters, Vol.4, No.3(1986), 159~164.
Fernández-Rodrı́guez F., C. González-Martel, and S. Sosvilla-Rivebo, “On the profitability of technical trading rules based on artificial neural networks: Evidence from the Madrid Stock Market”, Economics Letters, Vol.69, No.1(2000), 89~94.
Pérez-Rodríguez, J. V., S. Torra, and J.
Andrada-Félix, “STAR and ANN models:
Forecasting performance on the Spanish
‘‘Ibex-35” stock index”, Journal of Empirical Finance, Vol.12, No.3(2004), 490~509.
Steiner, M., and H.-G. Wittkemper, “Portfolio optimization with a neural network implementation of the coherent market hypothesis”, European Journal of Operational Research, Vol.100, No.1(1997), 27~40.
Tan, T. Z., C. Quek, and G. S. Ng, “Brain inspired genetic complimentary learning for stock market prediction”, Proceedings of the IEEE congress on evolutionary computation, Vol.3(2005), 2653~2660.
Zhang, Y. and L. Wu, “Stock market prediction of S&P 500 via combination of improved BCO approach and BP neural network”, Expert Systems with Applications, Vol.36, No.5(2009), 8849~8854.
Yumlu, M. S., F. S. Gurgen, and N. Okay,
“Turkish stock market analysis using mixture of experts”, Proceedings of Engineering of Intelligent Systems (EIS), (2004).
Yumlu, S., F. S. Gurgen, and N. Okay, “A Comparison of global, recurrent and smoothed-piecewise neural models for Istanbul Stock Exchange prediction”, Pattern Recognition Letters, Vol.26, No.13 (2005), 2093~2103.
Zadeh, L.A., "Fuzzy sets", Information and Control,
Vol.8, No.3(1965), 338~353.
국문요약
주식 시장 예측을 위한 π-퍼지 논리와 SVM의 최적 결합
1) 다오두안훙*ㆍ안현철**
최근 정보기술의 발전으로 복잡하고 방대한 양의 주가 데이터에 대한 실시간 분석이 가능해지면서 인공지능 기법을 활용해 주식 시장의 등락을 예측하고, 이를 기반으로 매매 거래를 수행하는 트레이딩 시스템에 대한 세간의 관심이 높아지고 있다. 본 연구는 이러한 트레이딩 시스템의 시장 예측 알고리 즘으로 활용될 수 있는 새로운 주식 시장 등락 예측 모형을 제시한다. 본 연구의 제안 모형은 π-퍼지 논리를 이용해 모든 입력변수의 차원을 low, medium, high로 퍼지변환한 입력값을 대상으로 Support Vector Machine(SVM)을 적용하여 익일 시장의 등락을 예측하도록 설계되었다. 그런데 이 경우 입력변 수의 수가 3배로 늘어나기 때문에, 적절한 입력변수의 선택이 요구된다. 이에 본 연구에서는 유전자 알고리즘을 활용하여 입력변수 선택 집합을 최적화하도록 하였으며, 동시에 π-퍼지 논리 및 SVM에 적용되는 조절 파라미터들의 값도 함께 최적화 하도록 하였다. 모형의 성능을 검증하기 위해, 본 연구
에서는 지난 2004년부터 2013년까지의 10년치 국내 주식시장 데이터를 기반으로 한 KOSPI 200 지수
의 등락 예측에 제안모형을 적용해 보았다. 이 때, 비교모형으로 로지스틱 회귀모형, 다중판별분석, 의 사결정나무, 인공신경망, SVM, 퍼지SVM 등도 함께 적용시켜 성과를 정밀하게 검증해 보고자 하였다.
그 결과, 제안모형이 예측 정확도는 물론 투자수익률(Return on Investment) 측면에서도 다른 모든 비교 모형들에 비해 월등히 우수한 성능을 보임을 확인할 수 있었다.
주제어 : 주식 시장 예측, 트레이딩 시스템, π-퍼지 논리, Support Vector Machine, 유전자 알고리즘
논문접수일:2014년 12월 6일 논문수정일:2014년 12월 12일 게재확정일:2014년 12월 16일 투고유형 : Concise Paper 교신저자:안현철
* 국민대학교 비즈니스IT전문대학원 박사후연구원
** Corresponding Author: Hyunchul Ahn
Graduate School of Business IT, Kookmin University 77 Jeongneung-ro, Seongbuk-gu, Seoul 136-702, Korea
Tel: +82-2-910-4577, Fax: +82-2-910-5209, E-mail: [email protected]
저 자 소 개