Comparative Analysis of Logistic
Regression, Support Vector Machine and Artificial Neural Network for the
Differential Diagnosis of Benign and
Malignant Solid Breast Tumors by the Use of Three-Dimensional Power Doppler
Imaging
Objective: Logistic regression analysis (LRA), Support Vector Machine (SVM) and a neural network (NN) are commonly used statistical models in computer- aided diagnostic (CAD) systems for breast ultrasonography (US). The aim of this study was to clarify the diagnostic ability of the use of these statistical models for future applications of CAD systems, such as three-dimensional (3D) power Doppler imaging, vascularity evaluation and the differentiation of a solid mass.
Materials and Methods: A database that contained 3D power Doppler imaging pairs of non-harmonic and tissue harmonic images for 97 benign and 86 malig- nant solid tumors was utilized. The virtual organ computer-aided analysis-imag- ing program was used to analyze the stored volumes of the 183 solid breast tumors. LRA, an SVM and NN were employed in comparative analyses for the characterization of benign and malignant solid breast masses from the database.
Results: The values of area under receiver operating characteristic (ROC) curve, referred to as Az values for the use of non-harmonic 3D power Doppler US with LRA, SVM and NN were 0.9341, 0.9185 and 0.9086, respectively. The Az values for the use of harmonic 3D power Doppler US with LRA, SVM and NN were 0.9286, 0.8979 and 0.9009, respectively. The Az values of six ROC curves for the use of LRA, SVM and NN for non-harmonic or harmonic 3D power Doppler imaging were similar.
Conclusion: The diagnostic performances of these three models (LRA, SVM and NN) are not different as demonstrated by ROC curve analysis. Depending on user emphasis for the use of ROC curve findings, the use of LRA appears to pro- vide better sensitivity as compared to the other statistical models.
ew technologies have been proposed to improve diagnostic performance as compared to the use of conventional breast ultrasonography (US), such as elastography and three-dimensional (3D) US (1, 2). 3D imaging that can display images in the multiplanar mode offers the aspect of a coronal plane and the technique has shown advantages for computer-aided diagnosis (CAD) (2). 3D power Doppler breast US can be used to assess the vascularity of the whole tumor as compared to the use of limited transverse and longitudinal planes with two-
Shou-Tung Chen, MD1 Yi-Hsuan Hsiao, MD2 Yu-Len Huang, PhD3 Shou-Jen Kuo, MD1, 4 Hsin-Shun Tseng, MD1, 2 Hwa-Koon Wu, MD5 Dar-Ren Chen, MD1, 2, 4
Index terms : Vascularization index Flow index
Vascularization-flow index Logistic regression analysis Neural network
Support Vector Machine
DOI:10.3348/kjr.2009.10.5.464 Korean J Radiol 2009;10:464-471 Received February 4, 2009; accepted after revision March 18, 2009.
1Departments of Surgery, 2Research,
4Comprehensive Breast Cancer Center,
5Medical Imaging, Changhua Christian Hospital, Changhua, Taiwan; 3Department of Computer Science and Information Engineering, Tunghai University, Taichung, Taiwan
This work was supported by grants of Changhua Christian Hospital (97-CCH- ICO-06-2, 97-CCH-ICO-07-2, 97-CCH- ICO-08-2 and 97-CCH-ICO-09-2) and by a grant from the National Science Council (97-2314-B-371-001-MY3) in Taiwan.
Address reprint requests to : Dar-Ren Chen, MD, Comprehensive Breast Cancer Center, Changhua Christian Hospital, 135 Nanhsiao Street, Changhua 500, Taiwan.
Tel. 886-4-7238595 ext.4871 Fax. 886-4-7231922 e-mail: [email protected]
N
dimensional Doppler US. Although increased vascularity does not necessary correlate with the presence of a malignancy, an increasing vascular index such as the
‘vascular index’ or ‘flow index’ may correlate with malignant potential (3). Tissue harmonic imaging (THI) is an US technique that can eliminate many imaging artifacts such as reverberations, clutter and side-lobe. Many investi- gators (4-6) have demonstrated that THI improves the image quality of breast lesions by enhancement of the delineation of tumor margins and by improvement of the conspicuity of low contrast lesions.
Logistic regression analysis (LRA) is widely used in epidemiological studies for its ability to perform probabil- ity estimation using a logistic formula. In a recent study, 3D power Doppler US was able to distinguish malignant tumors from benign lesions by the use of LRA (7). The artificial neural network (NN) method is extensively used in classification for its ability to model a complex non- linear system by the use of hidden units in a compact range. An NN has been proposed to improve the diagnos- tic findings of breast nodules for breast US (8-15). A Support Vector Machine (SVM) is a statistical method that operates by finding a hyperplane leaving the largest possible fraction of points of the same class on the same side, while maximizing the distance of either class from the hyperplane. The SVM has been widely used in classifi- cation and regression for its high generalization perfor- mance using pattern recognition and data mining. Several breast US CAD systems using an SVM algorithm have been proposed and the use of these systems have demonstrated that the SVM has potential effectiveness (16-18).
This study aimed to compare the diagnostic performance by the use of the three statistical models (LRA, SVM and NN) as determined by the use of receiver operating charac- teristic (ROC) curve analysis for the classification of malignant and benign breast lesions.
MATERIALS AND METHODS
Patients
The Institutional Review Board and ethics committee of our hospital approved this study. From a consecutive series of images of suspicious masses in 183 patients (age range, 17-80 years; mean age, 44 years), 97 benign and 86 malignant cases were identified. The masses had
undergone fine needle aspiration cytology, a core biopsy or/and an excisional biopsy and patients were subjected to an US examination with the use of both non-harmonic and THI. Informed consent was obtained from all patients. The largest tumor was selected in the study if more than one
lesion was detected in one patient and a tumor size larger than 3.1 cm was excluded because of probe limitations.
Malignant masses included infiltrating ductal carcinoma (n
= 75), apocrine carcinoma (n = 3), ductal carcinoma in situ (n = 5), papillary carcinoma (n = 1), mucinous carcinoma (n
= 1) and intracystic carcinoma (n = 1). Benign lesions included fibroadenoma (n = 81), papilloma (n = 1), phylloid (n = 1), sclerosing adenosis (n = 2) and other benign tumors (n = 12).
3D Power Doppler US Examinations
Non-harmonic and THI scans were obtained using a Voluson 730 scanner (GE Healthcare, Zipf, Austria) with a linear-array broadband 6-12 MHz transducer. The
transducer had a relative stopping power (RSP) index of 6- 12. A fixed installed 3D power Doppler setting for all US examinations was used as follows: a sweep angle of 5 to 29 , ‘low 1’ wall motion filter, 0.9 kHz pulse repetition frequency, -0.6 gain and mid frequency. Patients were examined in the supine position and were asked to hold their breath while the scanner generated the 3D volume.
Movement of the probe was also avoided. The duration of the 3D volume acquisition was approximately 20 seconds.
All of the acquired 3D power Doppler non-harmonic and THI scans were stored on a disc and no compression of the data was used at any time. Acquired 3D volumes were transferred to a personal computer using a digital imaging and communications in medicine (DICOM) connection for later offline imaging analysis.
Imaging Analysis
The virtual organ computer-aided analysis (VOCAL)- imaging program (version 2.1) was used to analyze the stored volume with a personal computer (M5, ASUS, Taipei, Taiwan). Detailed measurements and the applica- tion of the VOCAL-imaging program have been reported previously (19-21). In brief, the program can be used to calculate the histogram indices of the vascularity and blood flow obtained from quantitative 3D power Doppler US scanning. Both gray-scale and color scale voxels are graded from the lowest value (intensity, 0) and the highest value (intensity, 100). The stored US volume is defined by the smallest unit of volume, also a voxel. Three histogram indices, the vascularization index (VI), flow index (FI) and vascularization flow index (VFI) were calculated using these values. In a previous study, Jarvela et al. (19) have described these indices and detailed formulas. In brief, VI represents the vessels in tissue and VI is expressed as a percentage; FI represents the average intensity of flow (i.e., the mean color value of the color voxels); VFI represents both vascularization and flow (i.e., the mean color value of
all of the voxels in the obtained volume). Mean grayness (MG) is a representation of the average grayness in the gray voxels of a sphere.
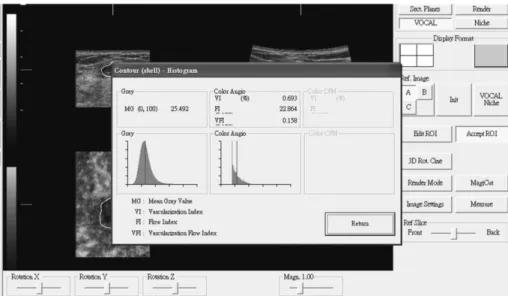
During measurement for all non-harmonic and harmonic 3D power Doppler image analyses, we used the VOCAL- program with the manual model with a rotation step of 30 to perform contour defining. We defined the contour around the tumor. The volume was obtained, since contours in the six image planes were determined; the histogram indices MG, VI, FI and VFI were determined once the contour was accepted (Fig. 1).
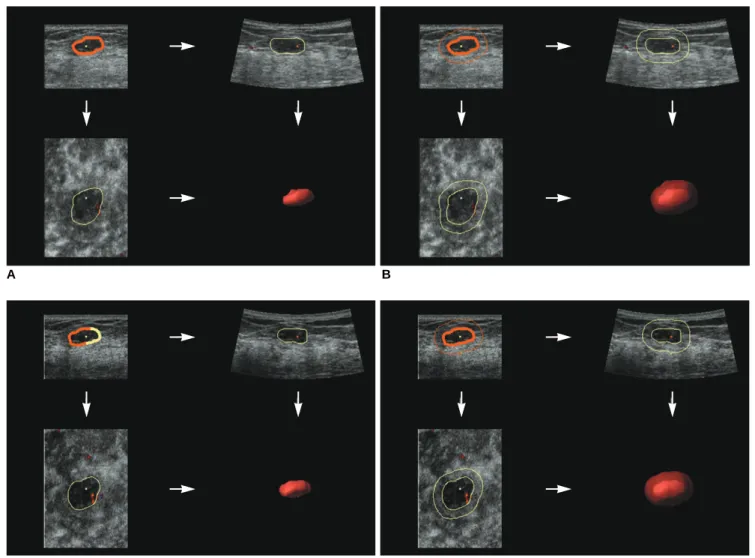
We prepared schemes for two signals to assess the vascularity of each tumor. One signal was the shell-off contour (i.e., the contour around the tumor margin) and the other signal was the outside shell with a thickness of 3 mm. Figure 2 shows the two power Doppler signals. We labeled the histogram indices VI, FI and VFI for the intra- tumor (inVI, inFI and inVFI) and for shells with a thickness of 3 mm surrounding the breast lesion (out3mmVI, out3mmFI and out3mmVFI). In addition, two vascular signals were obtained for the THI scans, the histogram indices of VI, FI and VFI for the intra-tumor (HinVI, HinFI and HinVFI) and for shells with a thickness of 3 mm surrounding the breast lesion (Hout3mmVI, Hout3mmFI and Hout3mmVFI) (Fig. 2). Briefly, histogram indices representing the MG and vascularity characteristics (VI, FI and VFI) of a mass were measured quantitatively from sonograms for both 3D power Doppler non-harmonic and THI.
Vascularity indices were recorded as 0 in scans with no vascularization as determined with the use of 3D power Doppler US. One of the investigators performed all of the clinical examinations of breast US. Imaging analysis was performed by one physician using the virtual organ
computer-aided analysis (VOCAL TM) imaging program (version 2.1, GE Medical Systems) who was blinded to the histology results. Repeat measurements were performed for reproducibility.
Statistical Analysis
Logistic regression analysis, SVM and NN were employed in a comparative analysis for the characteriza- tion of benign and malignant solid breast masses using 3D power Doppler imaging with the use of both non-harmonic US and THI. The performance of each statistical method included the overall parameters of inVI, inFI, inVFI, out3mmVI, out3mmFI and out3mmVFI. The performance measurements, including diagnostic accuracy, sensitivity, specificity, positive predictive value (PPV), negative predictive value (NPV) and the area (Az) under the ROC curve were calculated to estimate the performance of the diagnostic system. All p values < 0.05 were considered to be statistically significant.
Logistic Regression Analysis
For a pool of N samples, N-1 was fitted to an LRA model defined by Log (p) = + 1X1+ 2X2+ + kXk, where p is the probability of a malignancy, is a constant, 1, 2, ,
kare logistic regression coefficients and X1, X2, , Xkare parameters; and determine the shape of the logistic curve. We employed the Statistical Package for the Social Sciences (SPSS 15.0 statistical software, SPSS, Chicago, IL) to calculate the multivariate LRA of patient age, tumor volume and the vascularization indices of the benign and malignant breast tumors.
Support Vector Machine
An SVM is a machine learning system developed using
Fig. 1. Virtual organ computer-aided analysis (VOCAL)-imaging program can calculate histogram indices automatically since contour is defined and is accepted.
VI = vascularization index, FI = flow index, VFI = vascularization flow index, MG = mean grayness
statistical learning theories to classify data points into two classes. Notably, SVM models have been applied
extensively for classification, image recognition and bioinformatics. The SVM has been shown to be an effective tool in sonography for the diagnosis of breast cancer (16, 17, 22). The SVM algorithm reveals the feasibility and superiority to extract higher-order statistics.
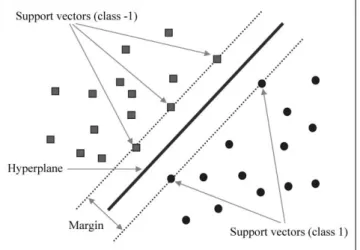
The maximal margin classifier aims to find a hyperplane to separate the training data. Of the possible hyperplanes, only one hyperplane maximizes the margin (distance between the hyperplane) and the nearest data point of each class. Figure 3 shows an optimal separating hyperplane with the largest margin. The support vectors denote the points lying on the margin border. The value produced by the output node is used to decide whether a tumor is benign or malignant. For an output value 0, the SVM system will classify the tumor as malignant;
conversely, for an output value < 0, the tumor will be
diagnosed as benign. The time consumed using the SVM method is shown in Table 3.
Neural Network
Neural networks have been successfully applied for aided diagnoses of solid breast nodules in US examina- tions. Chen et al. (9) have described in detail the applica- tion of CAD to US of solid breast nodules by the use of NNs. An NN model consists of hidden layers. The function of neurons in the hidden layer is to arbitrate between the input and output of the NN. The input vector is first supplied to the source nodes in the input layer. The neurons of the input layer constitute the signals applied to the neurons of the hidden layer. The output results of the hidden layer are employed as inputs to the next hidden layer. The output layer eventually generates the results and terminates the NN computing procedure. Among the learning algorithms used to train an NN, the back-propaga-
A B
Fig. 2. Cubes enclosing vessels of (A) intra-tumor, (B) outside shell thickness of 3 mm surrounding breast tumor for non-harmonic 3D power Doppler imaging, (C) intra-tumor and (D) outside shell thickness of 3 mm surrounding breast tumor for harmonic 3D power Doppler US.
C D
tion algorithm is the most widely used. The learning method iteratively executes the back-propagation algorithm for the training set and then produces the final synaptic weight vectors. The NN model has been used as a classifier by applying the final synaptic weight vectors to identify the tumor as benign or malignant. The input signals of the NN classifier contain a feature vector that comprises the vascularity indices of each breast tumor. The tumor is classified as benign if the output value is close to 0; the tumor is classified as malignant if the output value is near to 1.
RESULTS
A total of 183 solid breast image pairs (as measured with non-harmonic and harmonic 3D power Doppler imaging) were analyzed. The sizes of the lesions ranged from 6.00- 31.00 mm (mean size, 18.97 mm) for malignant tumors and 5.00-30.20 mm (mean size, 14.73 mm) for benign lesions. Histogram indices for the use of 3D power Doppler non-harmonic US scans were calculated. Twenty-three benign and two malignant cases were detected without intra-tumor vascularity; 14 benign cases and one malignant case were detected without vascular signals in shells with a thickness of 3 mm surrounding the breast lesions as determined by use of the VOCAL program. These histogram indices were labeled 0.
Table 1 summarizes the accuracy, sensitivity, specificity, PPV and NPV for the use of 3D power Doppler US non- harmonic and THI for the differentiation of benign from malignant breast tumors by the use of the different statisti- cal methods. Table 2 shows the Az value of ROC curve analysis for the diagnostic performance of LRA, SVM and NN for 3D power Doppler non-harmonic and THI of solid breast tumors. The statistical significance of the difference comparing two ROC curves (LRA versus SVM, LRA versus NN and SVM versus NN, respectively) is also
Fig. 3. Optimal hyperplane for Support Vector Machine.
Table 1. Accuracy, Sensitivity, Specificity, PPV and NPV for Diagnostic Performance of LRA, SVM and NN for Non-Harmonic and Harmonic Three-Dimensional Power Doppler Imaging of Solid Breast Tumors
LRA SVM NN
Non-harmonic Harmonic Non-harmonic Harmonic Non-harmonic Harmonic Accuracy 0086% (157/183) 0084% (154/183) 0082% (150/183) 0079% (144/183) 0088% (161/183) 0083% (151/183) Sensitivity91% (78/86) 93% (80/86) 91% (78/86) 87% (75/86) 91% (78/86) 86% (74/86) Specificity82% (79/97) 76% (74/97) 74% (72/97) 71% (69/97) 86% (83/97) 79% (77/97) PPV 81% (78/96) 078% (80/103) 076% (78/103) 073% (75/103) 85% (78/92) 79% (74/94)
NPV 91% (79/87) 93% (74/80) 90% (72/80) 86% (69/80) 91% (83/91) 87% (77/89)
Note.─LRA = logistic regression analysis, SVM = Support Vector Machine, NN = neural network, PPV = positive predictive value, NPV = negative predictive value
Table 2. Az Value of Receiver Operating Characteristic Curve Analysis for Diagnostic Performance of LRA, SVM and NN for Non-Harmonic and Harmonic 3D Power Doppler Imaging of Solid Breast Tumors
LRA SVM NN LRA versus SVM LRA versus NN SVM versus NN
Non-harmonic Az 0.9341 0.9185 0.9086
Std. error 0.0174 0.0200 0.0215
P value 0.2315 0.1241 0.4756
Harmonic Az 0.9286 0.8979 0.9009
Std. error 0.0182 0.0225 0.0223
P value 0.3493 0.1276 0.3770 0.3163 0.2625 0.4532
Note.─LRA = logistic regression analysis, SVM = Support Vector Machine, NN = neural network, Std. = standard
presented in Table 2. The difference was not statistically significant (p values > 0.05). The computation time of the CADs using the SVM and NN classifiers is displayed in Table 3. The training time was evaluated by the use of the US image database containing 183 images. The diagnosis time was the average computation time for one case.
Analysis of Az by LRA, SVM and NN for non-harmonic and harmonic imaging using 3D power Doppler US is shown in Figures 4 and 5.
DISCUSSION
In our study, satisfactory results were shown by the use of both harmonic and non-harmonic 3D power Doppler sonographic imaging to classify benign and malignant breast tumors by vascularization, and LRA, an SVM or
NN were applied to assess diagnostic performance. An NN and SVM have been shown to be acceptable diagnos- tic models for CAD systems. Vascularity scoring with 3D power Doppler US can predict the malignant potential of breast tumors, as has been recently demonstrated (7). Our study demonstrated that the areas under the six ROC curves of LRA, the SVM and NN for nonharmonic or harmonic 3D power Doppler imaging were similar. We conclude that there was no difference in diagnostic ability among these three statistical models by applying the models to both non-harmonic and harmonic 3D power Doppler images.
In a study by Song et al. (23) that compared LRA with an NN for 24 malignant and 30 benign masses, no differ- ence in performance for the masses as measured by the area under the ROC curve was demonstrated; however, the NN had better specificity than LRA for a fixed sensitiv- ity. However, it is difficult to assess whether the advantage of an NN as compared to LRA in a local region of an ROC curve is statistically significant. In several previous studies (11, 14, 15), a diagnostic model based on an NN showed promise for breast tumor diagnosis. In our study, the LRA approach for non-harmonic imaging had the highest Az value (0.9341) and the NN method for non-harmonic imaging had the highest level of accuracy (88%). In a study by Huang and Chen (17) that compared multilayer percep- tion neural networks (MLPs) with an SVM for 140 US
Table 3. Computation Time of CADs Using SVM and NN Classifiers
Training Time Diagnose Time (seconds) (milliseconds)
SVM CAD 00.70 00.91
NN CAD 27.98 53.37
Note.─SVM = Support Vector Machine, NN = neural network, CAD = computer-aided diagnosis. Training time was evaluated by use of US image database containing 183 Images. Diagnosis time is average computation time for one case.
Fig. 4. Analysis for area under receiver operating characteristics curve (Az) by logistic regression analysis (LRA), Support Vector Machine (SVM) and artificial neural network (NN) for non- harmonic 3D power Doppler US.
TPF = true positive fraction, FPF = false positive fraction, nonH_LRA = logistic regression formula employed for non- harmonic 3D power Doppler imaging, nonH_SVM = Support Vector Machine model applied for non-harmonic 3D power Doppler imaging, nonH_NN = neural network method applied for non-harmonic 3D power Doppler imaging
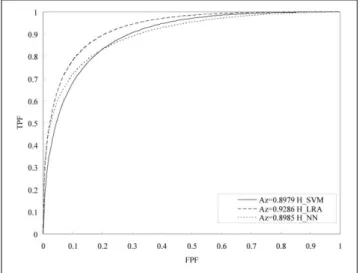
Fig. 5. Analysis of area under receiver operating characteristic curve (Az) by logistic regression analysis (LRA), Support Vector Machine (SVM) and artificial neural network (NN) for harmonic 3D power Doppler US.
TPF = true positive fraction, FPF = false positive fraction, H_LRA
= logistic regression formula employed for harmonic 3D power Doppler imaging, H_SVM = Support Vector Machine model applied for harmonic 3D power Doppler imaging, H_NN = neural network method applied for harmonic 3D power Doppler imaging
images of solid breast nodules, the investigators
demonstrated that the training and diagnosis procedures for the proposed SVM model were 700-fold and 2380-fold faster as compared to the MLPs, respectively.
Furthermore, the results from the use of the SVM model revealed better classification performance by the use of texture analysis. The time consumed for training and diagnosis procedures for the NN classifier were 39.97-fold and 58.75-fold that of the use of the SVM CAD in our study. The diagnostic performances as determined by the Az values for the use of LRA, the SVM and NN were nearly identical, and the shapes of the six curves were similar (Figs. 4, 5). These results differ from a previous study (23). Song et al. (23) reported that the use of an NN had a higher specificity as compared with LRA at a fixed 95% sensitivity. According to our results, the left portion of the ROC curve of ‘non-harmonic’_LRA was extended more to the left side as compared with ‘non-
harmonic’_SVM or ‘non-harmonic’_NN (Fig. 4). This finding implies that LRA for non-harmonic 3D power Doppler imaging has better specificity as compared to the SVM or NN for a fixed sensitivity. For harmonic imaging,
‘harmonic’_LRA is extended more to the left side as compared with ‘harmonic’ SVM or ‘harmonic’_NN (Fig. 5).
It is difficult to appraise whether the advantage of the use of LRA as compared to the other models for the local region of an ROC curve reaches statistical significance.
Furthermore, it is difficult to compare differences among investigations, as the application of different parameters (such as texture analysis or vascular indices) to the same model does not necessarily indicate identical diagnostic performance.
In summary, sensitivity for the LRA approach for harmonic imaging had a value of 93%. Moreover, LRA for both non-harmonic and harmonic 3D power Doppler imaging had better specificity as compared to the SVM or NN for a fixed sensitivity.
References
1. Cho N, Moon WK, Park JS, Cha JH, Jang M, Seong MH.
Nonpalpable breast masses: evaluation by US elastography.
Korean J Radiol 2008;9:111-118
2. Chen DR, Chang RF, Chen WM, Moon WK. Computer-aided diagnosis for 3-dimensional breast ultrasonography. Arch Surg 2003;138:296-302
3. Kuo SJ, Hsiao YH, Huang YL, Chen DR. Classification of benign and malignant breast tumors using neural networks and three-dimensional power Doppler ultrasound. Ultrasound Obstet Gynecol 2008;32:97-102
4. Rosen EL, Soo MS. Tissue harmonic imaging sonography of breast lesions: improved margin analysis, conspicuity, and image quality compared to conventional ultrasound. Clin Imaging 2001;25:379-384
5. Szopinski KT, Pajk AM, Wysocki M, Amy D, Szopinska M, Jakubowski W. Tissue harmonic imaging: utility in breast sonography. J Ultrasound Med 2003;22:479-487
6. Seo BK, Oh YW, Kim HR, Kim HW, Kang CH, Lee NJ, et al.
Sonographic evaluation of breast nodules: comparison of conventional, real-time compound, and pulse-inversion harmonic images. Korean J Radiol 2002;3:38-44
7. Hsiao YH, Kuo SJ, Liang WM, Huang YL, Chen DR. Intra- tumor flow index can predict the malignant potential of breast tumor: dependent on age and volume. Ultrasound Med Biol 2008;34:88-95
8. Chang RF, Huang SF, Moon WK, Lee YH, Chen DR. Solid breast masses: neural network analysis of vascular features at three-dimensional power Doppler US for benign or malignant classification. Radiology 2007;243:56-62
9. Chen DR, Chang RF, Huang YL. Computer-aided diagnosis applied to US of solid breast nodules by using neural networks.
Radiology 1999;213:407-412
10. Chen DR, Chang RF, Huang YL, Chou YH, Tiu CM, Tsai PP.
Texture analysis of breast tumors on sonograms. Semin Ultrasound CT MR 2000;21:308-316
11. Chen DR, Chang RF, Kuo WJ, Chen MC, Huang YL. Diagnosis of breast tumors with sonographic texture analysis using wavelet transform and neural networks. Ultrasound Med Biol 2002;28:1301-1310
12. Seker H, Odetayo MO, Petrovic D, Naguib RN, Bartoli C, Alasio L, et al. Assessment of nodal involvement and survival analysis in breast cancer patients using image cytometric data:
statistical, neural network and fuzzy approaches. Anticancer Res 2002;22:433-438
13. Tourassi GD. Journey toward computer-aided diagnosis: role of image texture analysis. Radiology 1999;213:317-320
14. Joo S, Yang YS, Moon WK, Kim HC. Computer-aided diagnosis of solid breast nodules: use of an artificial neural network based on multiple sonographic features. IEEE Trans Med Imaging 2004;23:1292-1300
15. Chen CM, Chou YH, Han KC, Hung GS, Tiu CM, Chiou HJ, et al. Breast lesions on sonograms: computer-aided diagnosis with nearly setting-independent features and artificial neural networks. Radiology 2003;226:504-514
16. Chang RF, Wu WJ, Moon WK, Chou YH, Chen DR. Support vector machines for diagnosis of breast tumors on US images.
Acad Radiol 2003;10:189-197
17. Huang YL, Chen DR. Support vector machines in sonography:
application to decision making in the diagnosis of breast cancer.
Clin Imaging 2005;29:179-184
18. Zhang J, Wang Y, Dong Y, Wang Y. Ultrasonographic feature selection and pattern classification for cervical lymph nodes using support vector machines. Comput Methods Programs Biomed 2007;88:75-84
19. Jarvela IY, Sladkevicius P, Kelly S, Ojha K, Nargund G, Campbell S. Three-dimensional sonographic and power Doppler characterization of ovaries in late follicular phase. Ultrasound Obstet Gynecol 2002;20:281-285
20. Chang CH, Yu CH, Ko HC, Chen CL, Chang FM. Three- dimensional power Doppler ultrasound for the assessment of the fetal brain blood flow in normal gestation. Ultrasound Med Biol 2003;29:1273-1279
21. Alcazar JL. Tumor angiogenesis assessed by three-dimensional power Doppler ultrasound in early, advanced and metastatic ovarian cancer: a preliminary study. Ultrasound Obstet Gynecol
2006;28:325-329
22. Chang RF, Wu WJ, Moon WK, Chen DR. Improvement in breast tumor discrimination by support vector machines and speckle-emphasis texture analysis. Ultrasound Med Biol 2003;29:679-686
23. Song JH, Venkatesh SS, Conant EA, Arger PH, Sehgal CM.
Comparative analysis of logistic regression and artificial neural network for computer-aided diagnosis of breast masses. Acad Radiol 2005;12:487-495