Introduction
Osteoporosis, otherwise known as low bone mineral density (BMD), is a degenerative disorder that occurs in all human populations and at all ages.1In particular, osteo-
porotic hip fractures are significantly correlated with an increased risk of morbidity and mortality and result in a greater burden on society.2In order to overcome this, iden- tifying features associated with osteoporosis on dental panoramic radiographs (DPRs) is becoming increasingly relevant and necessary.3Klemetti et al4 first defined the mandibular cortical shape classifications on DPRs for identifying osteoporosis in postmenopausal women. It has also been reported that there is a considerable association between osteoporosis and mandibular bone loss in post-
The combination of a histogram-based clustering algorithm and support vector machine for the diagnosis of osteoporosis
Muthu Subash Kavitha1,2, Akira Asano2,3, Akira Taguchi4, Min-Suk Heo1,*
1Department of Oral and Maxillofacial Radiology and Dental Research Institute, School of Dentistry, Seoul National University, Seoul, Korea
2Graduate School of Engineering, Hiroshima University, Hiroshima, Japan
3Faculty of Informatics, Kansai University, Osaka, Japan
4Department of Oral and Maxillofacial Radiology, Matsumoto Dental University, Nagano, Japan
ABSTRACT
Purpose: To prevent low bone mineral density (BMD), that is, osteoporosis, in postmenopausal women, it is essen- tial to diagnose osteoporosis more precisely. This study presented an automatic approach utilizing a histogram- based automatic clustering (HAC) algorithm with a support vector machine (SVM) to analyse dental panoramic radiographs (DPRs) and thus improve diagnostic accuracy by identifying postmenopausal women with low BMD or osteoporosis.
Materials and Methods: We integrated our newly-proposed histogram-based automatic clustering (HAC) algorithm with our previously-designed computer-aided diagnosis system. The extracted moment-based features (mean, vari- ance, skewness, and kurtosis) of the mandibular cortical width for the radial basis function (RBF) SVM classifier were employed. We also compared the diagnostic efficacy of the SVM model with the back propagation (BP) neural network model. In this study, DPRs and BMD measurements of 100 postmenopausal women patients (aged ¤50 years), with no previous record of osteoporosis, were randomly selected for inclusion.
Results: The accuracy, sensitivity, and specificity of the BMD measurements using our HAC-SVM model to identi- fy women with low BMD were 93.0% (88.0%-98.0%), 95.8% (91.9%-99.7%) and 86.6% (79.9%-93.3%), respective- ly, at the lumbar spine; and 89.0% (82.9%-95.1%), 96.0% (92.2%-99.8%) and 84.0% (76.8%-91.2%), respectively, at the femoral neck.
Conclusion: Our experimental results predict that the proposed HAC-SVM model combination applied on DPRs could be useful to assist dentists in early diagnosis and help to reduce the morbidity and mortality associated with low BMD and osteoporosis. (Imaging Sci Dent 2013; 43: 153-61)
KEY WORDS: Osteoporosis; Mandible; Radiography, Panoramic; Computer-Assisted Diagnosis
Received April 7, 2013; Revised April 28, 2013; Accepted May 7, 2013
*Correspondence to : Prof. Min-Suk Heo
Department of Oral and Maxillofacial Radiology, School of Dentistry, Seoul National University, 101 Daehak-ro, Jongno-gu, Seoul 110-749, Korea
Tel) 82-2-2072-3016, Fax) 82-2-744-3919, E-mail) [email protected]
Copyright ⓒ 2013 by Korean Academy of Oral and Maxillofacial Radiology
This is an Open Access article distributed under the terms of the Creative Commons Attribution Non-Commercial License (http://creativecommons.org/licenses/by-nc/3.0) which permits unrestricted non-commercial use, distribution, and reproduction in any medium, provided the original work is properly cited.
Imaging Science in Dentistry∙pISSN 2233-7822 eISSN 2233-7830
menopausal women, suggesting that mandibular bone mass and morphology may correlate with osteoporosis.5-7 After comparing the mandibular cortical width (MCW) and the cortical index, Devlin et al8showed that the MCW measurement would be a better area of research than the mandibular cortical index measurement for improving efficacy in detecting osteoporosis.
Some computer-aided diagnostic (CAD) systems have been developed,9,10but the methods of detection and diag- nostic assessment of low BMD or osteoporosis in these systems were manual, potentially inconsistent and requir- ed trained personnel to facilitate the process by analysing a large number of DPRs of undiagnosed individuals at high risk of developing osteoporosis. Allen et al11 proposed a CAD system involving steps both with and without man- ual intervention to estimate low BMD on DPRs through MCW measurement. This method required experts to iden- tify the lower part of the mandible by identifying four reference points. Roberts et al12 demonstrated an auto- matic hybrid method for estimating osteoporosis, which showed similar diagnostic accuracy to the manually ini- tialized search.
To overcome all these problems, a recently-proposed CAD system for osteoporosis screening provided continu- ous measurements of MCW between the upper and lower boundaries of each segment below the mental foramen without any manual intervention. However, continuous measurement results can sometimes be affected by irre- movable noises or objects such as uneven illumination and low-quality images.13 To avoid this, we adopted the trimmed mean method to calculate the mean of the MCW measurements obtained in our previous study. However, the trimmed mean method requires a prior threshold set- ting, which is undesirable for accurate measurement of MCW. In order to improve the precision of MCW mea- surement, we proposed a new cluster number optimization method. Further, to achieve higher classification accuracy, we have combined a machine learning algorithm with our proposed CAD system.
Hence, in this study, 1) we integrated our newly develop- ed automatic clustering algorithm with our previously pro- posed CAD system13 to measure MCW more accurately;
in addition, 2) we used a radial basis function (RBF)-sup- port vector machine (SVM) model utilizing the moment- based cortical features to obtain the highest classification rate to discriminate women with low BMD or osteoporosis from normal BMD. 3) We also compared the diagnostic efficacy of the SVM model with the BP neural network model.
Materials and Methods
Subjects
The study protocol was approved by the Hiroshima University Human Subject Committee, and DPRs were obtained for all the subjects after informed consent was obtained. The study subjects were 100 postmenopausal women recruited at Hiroshima University Hospital; 60 were allocated for system training and 40 for testing. All 100 women underwent dual energy X-ray absorptiometry (DXA) for the measurement of the BMD of the lumbar spine (L2-L4) and femoral neck (DPX-alpha; Lunar Co., Madison, WI). The inclusion criteria were 1) postmeno- pausal women, 2) aged ›50 years, and 3) with no previ- ous diagnosis of osteoporosis. The exclusion criteria were the same as per our previous study protocol.9,14-16The sub- jects were classified as normal (T-score greater than -1.0), osteopenia (T-score between -1 and -2.5), or osteoporo- sis (T-score less than -2.5) at each skeletal site according to the World Health Organization (WHO) criteria.17 The Adult Health Study cohort in Japan18reported that the cut- off BMD value defining osteoporosis in the lumbar spine that was based on the Japanese definition19(⁄70%) was similar to that based on the WHO definition (T-score less than -2.5 SD); therefore, we used the WHO definition in this study.
Dental panoramic radiography
All radiographs were obtained using an AZ-3000 Pano- ramic Dental X-ray equipment (Asahi Roentgen Co. Ltd., Kyoto, Japan) at 70-80 kVp, 12 mA, and 15 seconds, and a flat-bed scanner (ES-8000; Epson, Tokyo, Japan) was used to digitize the images at a resolution of 300 dpi. Screens of speed group 200 (HG-M; Fuji Photo Film Co., Tokyo, Japan) and film (UR-2; Fuji Photo Film Co., Tokyo, Japan) were used. The 100 original panoramic radiographs for the assessment consisted of one set of duplicate films (MI- Dup; Fuji Photo Film Co., Tokyo, Japan) processed with an automatic film processor (Cepros M; Fuji Photo Film Co., Tokyo, Japan). The appearance of the inferior cortex of the mandible was clear in the radiographs bilaterally.
Measurement of cortical width
The measurement system of Kavitha et al13for MCW measurement between the upper and lower boundaries of the cortical bone in the region of interest involves various image processing algorithms. Briefly, in this approach, the
area (300×300 pixels) forming the lower border of the inferior cortex below the mental foramen, cropped man- ually on the right and left sides was selected as the region of interest (ROI) (Fig. 1). In order to distinguish cortical bone from trabecular tissue and the background, pre-pro- cessing of the images is conducted. This included the typi- cal histogram equalization method for a new enhanced image, a thresholding algorithm for classifying image pixels into objects and background,9and high-pass filter- ing20for sharpening the boundary along the cortical bone.
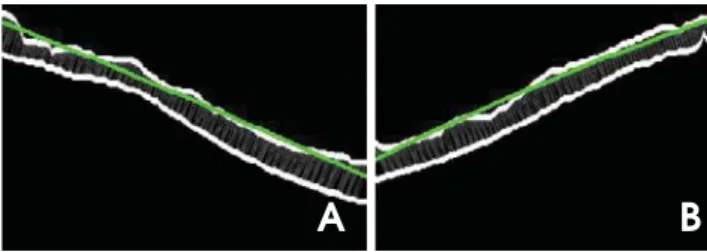
In this approach, the cortical margin segmentation is con- sidered a challenging task because x-ray images of the skeleton are complex in nature. We attempted to over- come this problem using the eight neighbourhood distance function (ENDF) and dynamic programming. The former technique estimates the diameter of the cortical bone and the latter produces the optimal path, thereby estimating the pixel locations of the central axis.13The cortical mar- gins were finally obtained as the envelope of the disc, which was outlined by each pixel on the trace whose radius equalled the pixel value. Finally, we measured the distance between the boundaries of the cortex using a second-order polynomial function (Fig. 2).
Histogram-based automatic clustering (HAC) algorithm
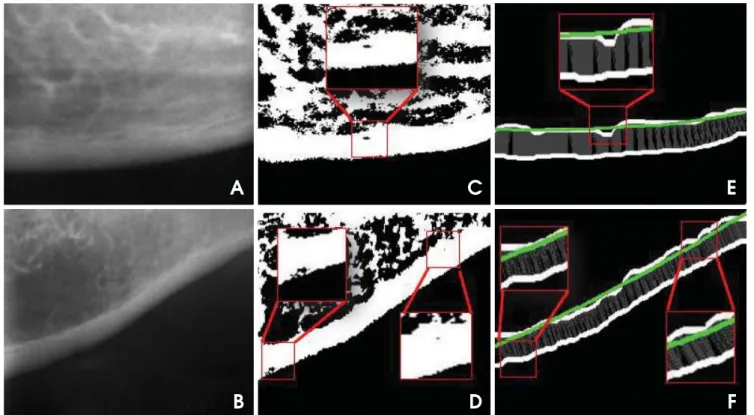
The cortical bone image is sometimes affected by irre- movable noises or objects that can arise inside the corti- cal bone between the upper and lower boundaries, as shown in Figure 3. It is difficult to predict the location of noise.
Places in which noise occurs make the cortical bone region appear thinner than its normal or original structure. This kind of variation in thickness of the cortical bone could decrease or affect the continuous measurement results and accuracy of the diagnostic system. In order to improve the precision of MCW measurement in the presence of noise, we developed a cluster number optimization method in which the ratio of element numbers between the largest and the second-largest cluster is adopted as the criterion.
Despite the fact that conventional cluster number optimi- zation methods that consider variance or the Akaike Infor- mation Criterion (AIC) value between clusters21,22 work well on the majority of noise-free images, they did not work well in this application. With regard to this problem, a method based on the k-means clustering algorithm23was adopted. We assumed that the cluster with the most ele- ments in the histogram would be regarded as the most desirable cluster for accurate MCW measurement. In this
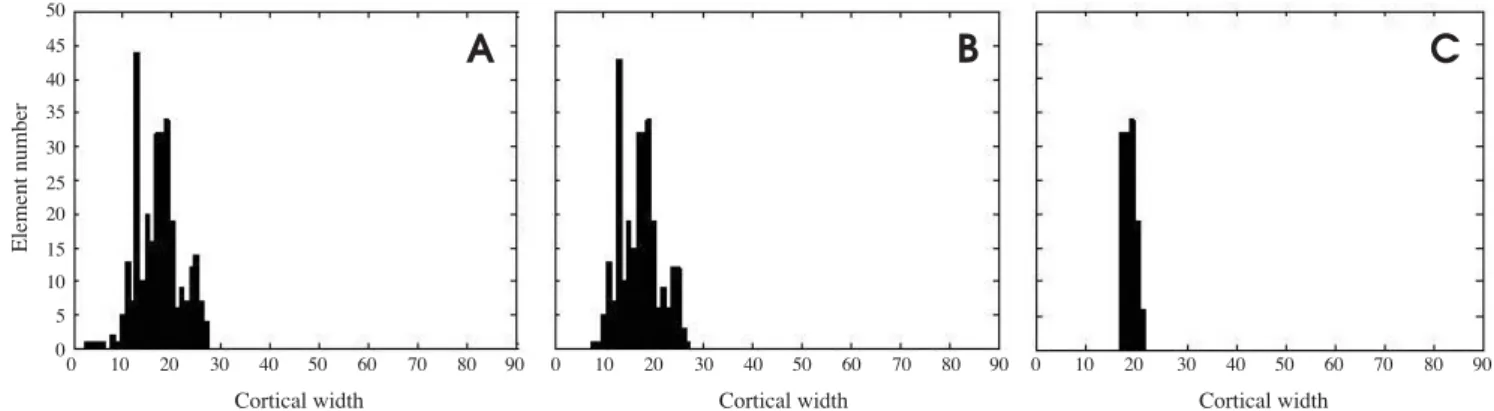
algorithm, the optimum number of clusters k is required to be decided automatically. The aim of this application was to preserve the cluster with the most elements and remove the cluster with fewer elements instead of making clusters with less variance, as shown in Figure 4C (right side) and in Figure 5C (left side). To avoid the border effect, eight measures were removed from both the left and right sides before the clustering procedure, as shown in Figure 4B (right side) and in Figure 5B (left side).
The proposed algorithm for MCW measurement was described by the following procedure:
1. Repeat steps 2, 3, and 4 with varying k cluster number from 1 to 10.
2. Cluster the histogram into k clusters.
3. Calculate the element number in each cluster.
4. Calculate the ratio of element numbers between the larg- est and second largest cluster:
Rk==Ckmax/ Cksec,
Rk==optimum number of clusters
Ckmax==element number of the largest cluster
Fig. 1. A panoramic radiograph shows two boxes corresponding to the lower border of the inferior cortex below the mental foramen on the right and left sides of the mandible. Boxes represent the sel- ected region of interest (ROI).
Fig. 2. A second-order polynomial function used to carry out the distance measurements between the boundaries of the cortical bone on the right (A) and the left (B) sides.
A B
Cksec==element number of the second largest cluster 5. The k producing the largest Rk is regarded as the opti-
mum number of clusters.
The average value estimated from the optimum number of clusters is considered to be an estimate of the cortical width.
SVM classification
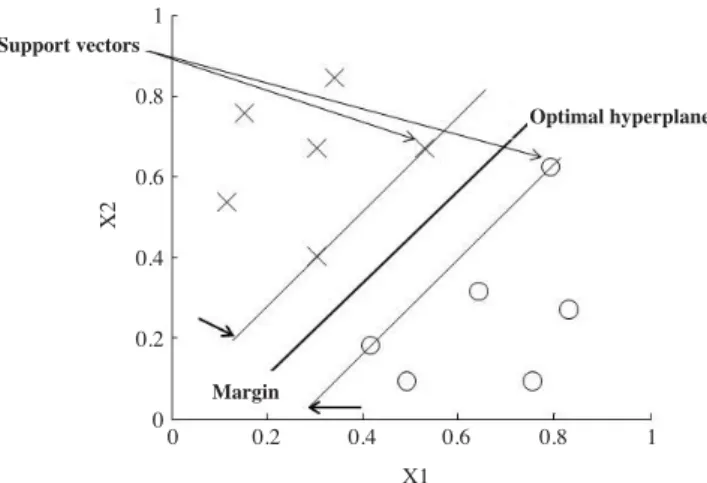
In this study, we treated osteoporosis detection as a two- class pattern classification problem. We applied a SVM classifier to refer to women with low BMD or osteoporo- sis and normal BMD as the two classes. SVM is based on the idea of minimizing the generalization error when the classifier is applied to test samples that do not exactly match any training sample used to train the classifier (cf., details on the algorithm24and details on its implementa- tion, optimization, training and testing25). A typical two class problem as the one illustrated in Figure 6 shows the simplest case in which the data vectors (marked by ‘X’s and ‘O’s) can be separated by a hyperplane. In such a case, there may exist many separating hyperplanes. Among them, the SVM classifier seeks the separating hyperplane that produces the largest separation margin.
In the more general case in which the sets are linearly non-separable in the input space, a nonlinear transforma- tion is used to map the original space into a high-dimen- sional space (called feature space), presumably making the separation easier in that space. In brief, both positive and negative examples in a dataset were represented by feature vectors Xi(i==1, 2, …, N) with corresponding bina- ry labels yiε{++1, -1}. The SVM algorithm classifies the positive and negative examples by training a classifier that uses a kernel function to map the input samples onto a high-dimensional space that best differentiates the two classes with a maximal margin and a minimal error.26,27 The data that lie on the hyperplane margins are support vectors. The discrimination function for SVM classifica- tion of unseen examples is given as:
m
f (x)==sgn ·»αiyi∙K(x,xi)++b‚ (1)
i==1
where ‘K(x, xi)’ is the kernel function, ‘b’ is the intercept constant, ‘sgn’ is the sign indicator (++or -), ‘m’ is the number of support vectors and ‘αi’ are constants determin- ed by maximization
N 1 N N
»αi-mm » »αiαjyiyjK(xi∙xj) (2)
i==1 2 i==1 j==1
under the conditions
Fig. 3. Mandibular cortical bone images show the left cortex affected by noise (boxes in red), also shown in enlarged view. Original images of the left region of interest (A and B), after the high-pass filter (C and D), and after the second order polynomial functions (E and F).
A C E
B D F
»αN iyi==0 and 0‹αi‹C (3)
i==1
In this study, we mainly used a non-linear SVM with a radial basis kernel as a classifier.
-||xi-xj||2
K(xi,xj)==exp·mmmmmmmmm‚ (4)
2γ2
Two parameters are required to optimize the RBF kernel of the SVM classifier γ that determines the capacity of the RBF kernel and C, the regularization parameter. The moment-based features are used as inputs in the SVM classifier for distinguishing women with low BMD or osteoporosis from those with normal BMD.
Back propagation (BP) neural network
Neural networks have been successfully used in many applications.28,29 These highly interconnected structures
consist of many simple processing elements or neurons, capable of performing experimental knowledge for data representation.30 In this study we applied the most com- monly used feed forward network BP algorithm. It has been widely used in approximating a complicated nonlin- ear function. The network model in this study is trained with one hidden layer and one output layer by giving four inputs. Figure 7 shows the typical configuration of a BP used in this study for modeling the diagnostic process.
The network transfer function log-sigmoid was used. The mathematical equation of each layer can be written as
YO==Φ(»WiOXi-θO) (5)
where YOis the output of the neuron o, WiOindicates the weight increments between i and o, Xiis the input signal, θOis the bias term and Φ is the non-linear activation func- tion, which is assumed to be a sigmoid function, specifi- cally,
Fig. 4.Histogram-based automatic clustering (HAC) algorithm shows the results of the right mandibular cortical bone. A. Original histo- gram. B. After border effect removal. C. The most desirable cluster for mandibular cortical width measurement (MCW) (optimized k cluster number 4).
50 45 40 35 30 25 20 15 10 5
00 10 20 30 40 50 60 70 80 90
Cortical width
0 10 20 30 40 50 60 70 80 90
Cortical width
0 10 20 30 40 50 60 70 80 90
Cortical width
Element number
A B C
Fig. 5. Histogram-based automatic clustering (HAC) algorithm shows the results of the left mandibular cortical bone. A. Original histogram.
B. After border effect removal. C. The most desirable cluster for mandibular cortical width measurement (MCW) (optimized k cluster number 2).
50 45 40 35 30 25 20 15 10 5
00 10 20 30 40 50 60 70 80 90
Cortical width
0 10 20 30 40 50 60 70 80 90
Cortical width
0 10 20 30 40 50 60 70 80 90
Cortical width
Element number
A B C
Φ(X)==1/(1++e-x) (6) for the continuous and differential process.
Statistical analyses
The mean values of the MCW, variance, skewness and kurtosis of both sides of the jaw were used in this study.
Receiver operating curve (ROC) analysis was used to mea- sure the diagnostic accuracy of the MCW measurement system in identifying women with low skeletal BMD (R statistical software version 2.15.2, The R Foundation for Statistical Computing). The 100 DPRs (75 healthy and 25 ill, based on lumbar spine BMD, 76 healthy and 24 ill based on femoral neck BMD) were randomly divided into five groups. We set the first group as a testing group and the remaining four groups to train the SVM classifier.
Then we set the second group as a testing group and the
remaining four groups to train the classifier. This proce- dure was repeated until each of the five groups had been set as the testing group. The average results of these five classification performances were considered to be the overall performance of the SVM classifier model. Quad- ratic programming was used to optimize the combination of parameters. The parameters were set to γ ==2 and C==1.
The RBF parameter and weighting factors were determin- ed by experimentation on the training samples. To com- pare the performance of our proposed method, we used a BP neural network classifier. The parameters were set to its learning rate η at 0.01, the maximum number of itera- tions at 1000, and the epochs between showing the pro- cess at 50. We employed a data analysis framework written in MATLAB, which incorporates freely available SVM tools and neural network tools for MATLAB that were implemented by31,32 to perform classification. The risk- index range that corresponded to a sensitivity of approxi- mately 90% was chosen to determine the optimal cut-off threshold. The sensitivity, specificity, positive predictive value (PPV), negative predictive value (NPV), accuracy and likelihood ratio for the positive (LR++) results were calculated.
Results
To determine the accuracy of diagnosing low spinal BMD and femoral neck BMD, it was found that the areas under the ROCs (AUCs) were 0.871 (95% CI: 0.804-0.936) and 0.886 (95% CI: 0.816-0.944), respectively. For the training sets, the data were classified into an osteoporotic and a normal group, which were labelled as either ‘0’ or
‘1’, corresponding to positive and negative examples in classifiers training (Table 1). The SVM with RBF kernel predictions for the diagnostic classification of postmeno- pausal women had an accuracy of 93%, sensitivity of 95.8%, specificity of 86.6%, PPV of 76.8% and NPV of
Fig. 7.Structure of typical back propagation neural network model shows four inputs with one hidden layer and one output layer.
Mean
Variance
Skewness
Kurtosis
Output layer Hidden layer
Input layer
Table 1.Classification of osteoporosis or low bone mineral den- sity (BMD) using support vector machine (SVM) and back propaga- tion (BP) neural network on panoramic radiograph
SVM BP
Normal Low Normal Low
Lumbar spine BMD
Normal 64TN 2FN 62TN 3FN
Low 11FP 23TP 13FP 22TP
Femoral neck BMD
Normal 63TN 1FN 62TN 2FN
Low 13FP 23TP 14FP 22TP
TN==True-Negative, FN==False-Negative, FP==False-Positive, TP==True- Positive
Fig. 6. Support vector machine classification with a linear optimal hyperplane that maximizes the separating margin between the two classes marked as O and X.
Support vectors
Margin 1
0.8
0.6
0.4
0.2
00 0.2 0.4 0.6 0.8 1
X1
X2
Optimal hyperplane
98.5%, evaluated on the basis of the lumbar spine BMD, and an accuracy of 89%, sensitivity of 96.0%, specificity of 84.0%, PPV of 66.7% and NPV of 98.4% on the basis of the femoral neck BMD. The comparison of the perfor- mance of the SVM with that of the BP neural network is given in Table 2.
The BP neural network predictions for the diagnostic classification of postmenopausal women had an accuracy of 91%, sensitivity of 93.3%, specificity of 83.2%, PPV of 75.5% and NPV of 98.2% on the basis of the lumbar spine BMD, and an accuracy of 86%, sensitivity of 93.8%, specificity of 82.0%, PPV of 66.3% and NPV of 98.0%
on the basis of the femoral neck BMD. We also compared the training time for the SVM and the BP neural network and found that the SVM was much less time consuming, with a training time of only 1 second compared with 47 seconds for the BP neural network.
Discussion
We used our newly-developed HAC-SVM method com- bined with our previously proposed CAD system to gene- rate reliable and improved measurement results of MCW on DPRs and thus diagnose women with low BMD or osteoporosis. Our results showed that the sensitivity and specificity estimated by the HAC-SVM method were better than those estimated by other previous methods9,10 at identifying women with low skeletal BMD (Table 2). In the OSTEODENT project,33the sensitivity was almost to the same as our study, but the specificity (9.8% to 23.7%) was very low. Roberts et al12reported a moderate sensiti- vity and specificity, although the backgrounds of their subjects were different. In the trimmed mean method13for MCW measurement, both the sensitivity and specificity were lower than those of our new method; they were 90%
and 75%, respectively, on the basis of lumbar spine BMD, and 81.8% and 69.2%, respectively, on the basis of femo- ral neck BMD. Furthermore, the trimmed mean method was found to have low accuracy (79%) and also required setting prior thresholds, which is not suitable for all types of noisy images. However, in this study, the accuracy (93%) was high, and in addition, this method could be used to directly assess the most desirable cortical bone region for MCW measurement, which could also decrease measurement errors.
The ROC value (AUC==0.886) was found to be high and appeared promising on the basis of the femoral neck BMD in this study. A previous study on an automatic method of measuring cortical width from 132 subjects reported a low ROC value (AUC==0.66-0.71).11Likewise, in another study on the manual measurement of cortical thickness in 653 subjects, the ROC value was found to be low (AUC==0.71- 0.78).33Lee et al15estimated the mandibular inferior cor- tex manually using a calliper in 100 subjects measured by four observers, and they reported low ROC values of 0.768 and 0.770 in the lumbar spine and femoral neck, respec- tively. The high ROC value in this study supports our sug- gestion that our proposed system could prove a useful tool for the diagnosis of osteoporosis.
According to Tuceryan and Jain,34 tonal or extracted features such as the mean, variance, skewness and kurto- sis can be used to analyse local properties of the image region as well as to improve the rate of correct classifica- tion. On this basis, in our previous study,35we utilized trim- med mean results using an SVM model employing only the mean and variance, and the sensitivity and specificity were 90.9% and 69.6-83.8%, respectively. However, in our newly proposed HAC-SVM method, we employed all four extracted features of the MCW and found that the sensitivity and specificity were 95.8% and 86.6%, respec-
Table 2. Diagnostic performance of the proposed method using support vector machine (SVM) and back propagation (BP) neural network classification for identifying postmenopausal women with lumbar spine and femoral neck BMDs at 95% confidence interval
Identifying site Sensitivity % Specificity % Positive Negative
Accuracy % Likelihood predictive value % predictive value % ratio (++) % SVM classification
Lumbar spine 95.8 86.6 76.8 98.5 93.0 7.2
(91.9-99.7) (79.9-93.3) (68.5-5.1) (96.1-100) (88.0-98.0) (6.3-8.1)
Femoral neck 96.0 84.0 66.7 98.4 89.0 6.0
(92.2-99.8) (76.8-91.2) (57.5-5.9) (95.9-100) (82.9-95.1) (5.4-6.9) BP neural network classification
Lumbar spine 93.3 83.2 75.5 98.2 91.0 6.9
(88.0-98.0) (75.6-90.4) (66.5-3.4) (95.0-100) (85.4-96.6) (5.9-7.8)
Femoral neck 93.8 82.0 66.3 98.0 86.0 5.9
(89.0-98.0) (74.5-89.5) (56.7-5.3) (95.3-100) (79.2-92.8) (4.9-6.8)
tively, when based on lumbar spine BMD; these values were 96.0% and 84.0%, respectively, when based on femo- ral neck BMD (Table 2). The improved specificity infers that the results of measurement using our proposed sys- tem could have excellent accuracy. Furthermore, we could conclude from the similarity of the extracted features that the values in healthy women were highly skewed (mean skewness== 1.25 pixels) and kurtotic (mean kurtosis==4.01 pixels) compared with those in osteoporotic patients (mean skewness==0.68 pixels; mean kurtosis==1.05 pixels). This approach enabled using this image feature as an additional tool to assist in the diagnosis of osteoporosis.
In some previous studies from Japan, the same 100 sub- jects were used for manual assessment of MCW or shape, resulting in low and moderate diagnostic efficacies in osteoporosis screening. Nakamoto et al14 evaluated the appearance of the mandibular inferior cortex on DPR and showed a low mean sensitivity and specificity of 77%
and 40%, respectively, in the lumbar spine and 75% and 39%, respectively, in the femoral neck. It was also report- ed that the mean sensitivity and specificity for classifying the cortical erosion accuracy in identifying women at risk of developing osteoporosis among a group of observers were 82.5% and 46.2%, respectively.16In another study,9 the authors measured MCW using a semi-automatic sys- tem, and achieved sensitivity and specificity of 88.0%
and 58.7%, respectively, in the lumbar spine, and 87.5%
and 56.3%, respectively, in the femoral neck. By compar- ing our experimental results with these previous studies, we concluded that our newly-proposed method has very acceptable sensitivity and specificity. A recent automated method of measuring MCW36showed measurement results similar to their own manual measurement. This might be due to their restricted measurement method, which was restricted to the region of the mental foramen, where the hyoid bone image sometimes overlaps the inferior cortex of the mandible below the mental foramen and could adverse- ly affect measurement results.13,37However, our proposed continuous measurements of MCW between the mental foramen and the angle of the mandible using the HAC algorithm along with the SVM method could decrease such measurement errors.
In this study, we compared the diagnostic efficacy of the SVM classifier with the BP neural network model. We found that the diagnostic efficacy of the SVM model was relatively higher than the BP neural network. Further, the SVM required only 1 second in training the data while the BP neural network needed 47 seconds, this showed that the SVM is up to 47 times faster. Hence, HAC-SVM can
be considered a more suitable combination to our proposed CAD system than BP neural networks.
Some limitations were also noted in this study. First, the number of subjects was relatively small, and the subjects could be considered healthy because we used rigid exclu- sion criteria. Second, our measurement results evaluated in this study were obtained only from postmenopausal Japanese women. It would be necessary to validate the proposed system in different populations to produce results in a more generalized form. Third, the moment-based fea- tures of the classifiers were applied to evaluate the perfor- mance of the proposed diagnostic system. Using additional features of texture and shape to analyse the accuracy and efficiency of the CAD system would improve the evalua- tion.
In this study, we proposed a histogram-based clustering algorithm combined with a support vector machine as the HAC-SVM method; it was applied on DPRs in identify- ing and classifying women with low BMD or osteoporo- sis. Our results revealed that the radiographic moment based features extracted by using the HAC algorithm for SVM model would be capable of improving the accuracy and efficiency of the diagnostic system. We suggest that the proposed CAD system with the combination of the HAC-SVM method will prove reliable and beneficial, and will allow dentists to perform early detection and diag- nosis in populations who might not otherwise have access to diagnostic procedures, either because they were initial- ly deemed low risk, or because of lack of access to DXA.
References
1. Osteoporosis prevention, diagnosis and therapy. NIH Consen- sus Statement 2000; 17: 1-45.
2. Johnell O, Kanis JA. An estimate of the worldwide prevalence, mortality and disability associated with hip fracture. Osteopo- ros Int 2004; 15: 897-902.
3. Horner K, Devlin H. The relationship between mandibular bone mineral density and panoramic radiographic measure- ments. J Dent 1998; 26: 337-43.
4. Klemetti E, Kolmakov S, Kröger H. Pantomography in assess- ment of the osteoporosis risk group. Scand J Dent Res 1994;
102: 68-72.
5. Hildebolt CF. Osteoporosis and oral bone loss. Dentomaxillo- fac Radiol 1997; 26: 3-15.
6. White SC, Rudolph DJ. Alterations of the trabecular pattern of the jaws in patients with osteoporosis. Oral Surg Oral Med Oral Pathol Oral Radiol Endod 1999; 88: 628-35.
7. White SC, Taguchi A, Kao D, Wu S, Service SK, Yoon D, et al. Clinical and panoramic predictors of femur bone mineral density. Osteoporos Int 2005; 16: 339-46.
8. Devlin H, Karayianni K, Mitsea A, Jacobs R, Lindh C, van der
Stelt P, et al. Diagnosing osteoporosis by using dental panora- mic radiographs: the OSTEODENT project. Oral Surg Oral Med Oral Pathol Oral Radiol Endod 2007; 104: 821-8.
9. Arifin AZ, Asano A, Taguchi A, Nakamoto T, Ohtsuka M, Tsuda M, et al. Computer-aided system for measuring the mandibular cortical width on dental panoramic radiographs in identifying postmenopausal women with low bone mineral density. Osteoporos Int 2006; 17: 753-9.
10. Devlin H, Allen PD, Graham J, Jacobs R, Karayianni K, Lindh C, et al. Automated osteoporosis risk assessment by dentists:
a new pathway to diagnosis. Bone 2007; 40: 835-42.
11. Allen PD, Graham J, Farnell DJ, Harrison EJ, Jacobs R, Nico- polou-Karayianni K, et al. Detecting reduced bone mineral density from dental radiographs using statistical shape models.
IEEE Trans Inf Technol Biomed 2007; 11: 601-10.
12. Roberts M, Yuan J, Graham J, Jacobs R, Devlin H. Changes in mandibular cortical width measurements with age in men and women. Osteoporos Int 2011; 22: 1915-25.
13. Kavitha MS, Samopa F, Asano A, Taguchi A, Sanada M. Com- puter-aided measurement of mandibular cortical width on dental panoramic radiographs for identifying osteoporosis. J Investig Clin Dent 2012; 3: 36-44.
14. Nakamoto T, Taguchi A, Ohtsuka M, Suei Y, Fujita M, Tani- moto K, et al. Dental panoramic radiograph as a tool to detect postmenopausal women with low bone mineral density: untrain- ed general dental practitioners’ diagnostic performance. Osteo- poros Int 2003; 14: 659-64.
15. Lee K, Taguchi A, Ishii K, Suei Y, Fujita M, Nakamoto T, et al. Visual assessment of the mandibular cortex on panoramic radiographs to identify postmenopausal women with low bone mineral densities. Oral Surg Oral Med Oral Pathol Oral Radiol Endod 2005; 100: 226-31.
16. Taguchi A, Asano A, Ohtsuka M, Nakamoto T, Suei Y, Tsuda M, et al. Observer performance in diagnosing osteoporosis by dental panoramic radiographs: results from the osteoporosis screening project in dentistry (OSPD). Bone 2008; 43: 209- 13.
17. World Health Organization. Assessment of fracture risk and its application to screening for postmenopausal women osteo- porosis. Geneva: World Health Organization; 1994.
18. Fujiwara S, Kasagi F, Masunari N, Naito K, Suzuki G, Fuku- naga M. Fracture prediction from bone mineral density in Japanese men and women. J Bone Miner Res 2003; 18: 1547- 53.
19. Orimo H, Hayashi Y, Fukunaga M, Sone T, Fujiwara S, Shi- raki M, et al. Diagnostic criteria for primary osteoporosis: year 2000 revision. J Bone Miner Metab 2001; 19: 331-7.
20. Gonzalez RC, Woods RE. Digital image processing. Engle- wood Cliffs: Addison-Wesley Pub; 1992.
21. Ketchen DJ, Shook CL. The application of cluster analysis in
strategic management research: an analysis and critique. Strat Mgmt J 1996; 17: 441-58.
22. Manning CD, Raghavan P, Schütze H. Introduction to infor- mation retrieval. New York: Cambridge University Press;
2008.
23. Hartigan JA. Clustering algorithms: probability & mathema- tical statistics. New York: Wiley; 1975.
24. Wee LJ, Tan TW, Ranganathan S. SVM-based prediction of caspase substrate cleavage sites. BMC Bioinformatics 2006; 7 Suppl 5: S14.
25. Burges CJ. A tutorial on support vector machines for pattern recognition. Data Min Knowl Discov 1998; 2: 121-67.
26. Vapnik VN. The nature of statistical learning theory. New York: Springer; 1995.
27. Vapnik VN. Statistical learning theory. New York: Wiley;
1998.
28. Ciesielski K, Sacha JP, Cios K. Synthesis of feedforward net- works in supremum error bound. IEEE Trans Neural Netw 2000; 11: 1213-27.
29. Back AD, Chen T. Universal approximation of multiple non- linear operators by neural networks. Neural Comput 2002; 14:
2561-6.
30. Aleksander I, Morton H. An introduction to neural computing.
London: Chapman and Hall; 1990.
31. Schölkopf B, Smola AJ. Learning with kernels. Cambridge:
MIT Press; 2002.
32. Haykin S. Neural networks: a comprehensive foundation. 2nd ed. Englewood Cliffs: Prentice Hall; 1999.
33. Karayianni K, Horner K, Mitsea A, Berkas L, Mastoris M, Jacobs R, et al. Accuracy in osteoporosis diagnosis of a com- bination of mandibular cortical width measurement on dental panoramic radiographs and a clinical risk index (OSIRIS): the OSTEODENT project. Bone 2007; 40: 223-9.
34. Tuceryan M, Jain AK. Texture analysis. In: Chen CH, Pau LF, Wang PS. The handbook of pattern recognition and computer vision. Singapore: World Scientific Publishing Co.; 1998. p.
207-48.
35. Kavitha MS, Asano A, Taguchi A, Kurita T, Sanada M. Diag- nosis of osteoporosis from dental panoramic radiographs using the support vector machine method in a computer-aided sys- tem. BMC Med Imaging 2012; 12: 1.
36. Muramatsu C, Matsumoto T, Hayashi T, Hara T, Katsumata A, Zhou X, et al. Automated measurement of mandibular cor- tical width on dental panoramic radiographs. Int J Comput Assist Radiol Surg (in press).
37. Yosue T, Brooks SL. The appearance of the mental foramina on panoramic and periapical radiographs. II. Experimental evaluation. Oral Surg Oral Med Oral Pathol 1989; 68: 488- 92.