ISSN 2287-4623 (Online)
J Kor Soc Fish Technol, 50 (4), 567―582, 2014 http://dx.doi.org/10.3796/KSFT.2014.50.4.567
<Original Article>
한국 동해 울진 연안어업의 생태계 기반 자원평가
윤상철⋅장창익
1⋅서영일
*⋅김장근
국립수산과학원 자원관리과,
1부경대학교 해양생산시스템관리학부
Ecosystem-based resource assessment on coastal fisheries of Uljin in East Sea of Korea
Sang-Chul Y OON , Chang-Ik Z HANG
1, Young-Il S EO
*and Zang-Geun K IM
Fisheries Resources Management Division, National Fisheries Research and Development Institute, Busan, 619-705, Korea
1
Division of Marine Production System Management, Pukyong Nationl University, Busan 608-737, Korea
Coastal fisheries in Korean waters have highly complexity with a variety of fishing gears, and scale of those fisheries is smaller than that of offshore fisheries. As a result, important spawning and nursery grounds for many species of fish has been destroyed. The pragmatic ecosystem-based approach was developed for the assessment of fisheries resources in Korean waters by Zhang et al. (2009; 2010). As for the species risk index (SRI), common squid caught by coastal gillnet in the Uljin region had the highest risk. As for the fisheries risk index (FRI), coastal gillnet in the Uljin coastal waters had the highest risk. For the common squid which had the highest SRI, resources management strategies must be established such as catch prohibition of length and period with TAC. For the coastal gillnet in the Uljin region which had the highest FRI, it is judged to need management plans for conserving biodiversity as reducing the catch of non-target species and discards.
Also to protect existing habitat, illegal fishery should be prohibited, and fishing gears should be designed in the environmental-friendly way considering when fishing gears lost.
Keywords: Coastal fisheries, Ecosystem-based resource assessment, East Sea, Coastal gillnet, Coastal jigging
*Corresponding author: [email protected], Tel: 82-51-720-2296, Fax: 82-51-720-2337
서 론
우리나라의 다양한 수산자원관리 정책에도 불구하고 수산자원량은 여전히 낮은 상태에 머물러 있는데, 이는 어획노력량 규제의 비효과적 관리로 자원관리 효과가 미비하고, 어선마력 등 어획노력량 증대 및 고비용 어 업구조 고착화로 자원왜곡 현상이 심각하며, 자원남획, 연안환경 오염 등으로 인해 자원량은 쉽사리 과거 수준
을 회복하지 못하고 있다. 이것은 수산자원관리 정책의 근간이 아직 단일종에 대한 자원관리 정책이나 어업관 리 방식에 머물러 있기 때문이며, 이를 해결하기 위해 서는 전통적인 단일종의 자원평가를 탈피한 통합적인 자원평가 생태계 기반 자원평가에 의한 자원관리가 필 요한 실정이다 (Yoon, 2014).
국내에서도 이러한 필요성에 따라 생태계 기반 자원
관리에 대한 연구가 진행되었는데 생태계 차원에서의 어업자원관리 방안에 관한 연구 (Zhang, 2006), 생태계 위험도를 평가하는 생태계 기반 자원평가 기법 (Zhang et al., 2009), 바다목장 생태계에 적합한 목표, 지표, 기 준점 개발에 관한 연구 (Zhang et al., 2010), 생태계 기 반 자원평가 기법을 활용한 남해 어장생태계의 위험도 분석 연구 (Seo, 2011)등이 수행된 바 있다. 기술한 연 구 결과는 광역해양생태계 혹은 장기간에 걸쳐 대상생 태계에 대한 충분한 조사결과가 뒷받침된 해역을 대상 으로 연구된 결과이므로, 상대적으로 생태계 기반 자원 평가를 위한 자료가 갖춰져 있지 않고, 가용한 정보의 수준도 낮은 연안어업에 대한 평가를 위해서는 기존의 연구결과를 바탕으로 연안어업의 특성을 고려한 방법 론의 개발과 이에 따른 새로운 평가방법의 적용이 필요 하게 되었다.
궁극적으로는 기존에 개발된 생태계 기반 자원평가 모델 중에서 과학적이고 객관적인 정량적 분석 모델에 의한 자원평가를 수행하고, 이에 따른 관리방안을 제시 하는 것이 바람직하다고 할 수 있으나, 연안어업은 과 학적인 자료나 정보가 부족한 실정이므로 정성적 분석 모델을 사용하여 생태계 기반 자원평가를 수행하는 것 이 현실적인 방안으로 판단된다. 정성적 분석 모델에 의한 생태계 기반 자원평가가 현재 우리나라의 연안어 업에서 어획되는 수산자원에 적용되고 있는 단일종에 대한 자원평가 보다는 더 효과적이고 포괄적인 자원관 리 방안을 제시할 수 있을 것이다.
본 연구에서는 연안어업에 적합한 생태계 기반 자원 평가 방법의 개발을 통해 한국 동해의 울진연안생태계 와 해당 생태계에서 조업이 이뤄지고 있는 3개 연안어 업의 위험도를 평가하여 연안어업의 생태계 기반 관리 를 위한 연안생태계와 연안어업 관리방안을 제시하고 자 한다.
재료 및 방법
분석방법
분석 방법 및 모델
대상해역, 대상어업 및 대상종 선정
본 연구에서 대상해역, 대상어업 및 대상종을 선정한 원칙은 평가대상어업은 각 어업별 어획량의 합이 평가 대상 연안생태계 전체 어획량의 75%를 상회하고, 평가
대상 어종은 각 어종별 어획량의 합이 평가대상 연안생 태계 전체 어획량의 50%를 상회하도록 2개 이상의 종 과 2개 이상의 어업을 선정하여 종위험도 (Species risk index, SRI)로부터 어업위험도를 평가하는 어업위험도 지수 (Fisheries risk index, FRI)와 어업위험도지수로부 터 추정되는 생태계위험도지수 (Ecosystem risk index, ERI)가 대상생태계의 특징을 객관적으로 반영할 수 있 도록 하였다.
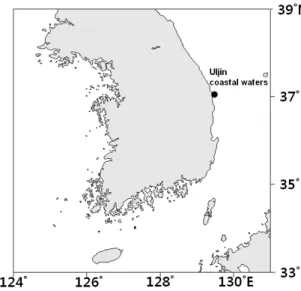
국립수산과학원에서는 우리나라 주요하구해역 및 만 에 해당하는 연안 생태계의 구조 기능의 변화와 어업 자원 변동을 평가하기 위해 2007~2011년간 9개 해역에 대한 조사를 실시하였는데 (NFRDI, 2013), 본 연구에 서는 연안어업의 생태계 기반 평가를 위해 국립수산과 학원에서 조사한 해역 결과를 바탕으로 동해안의 경북 울진연안을 평가 대상해역으로 선정하였다 (Fig. 1).
Fig. 1. A map showing the target ecosystem for this study.
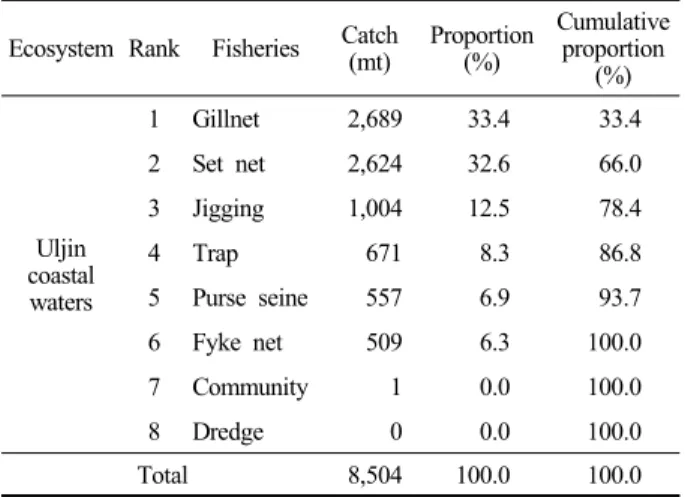
2007~2011년간 동해 울진연안의 연안어업의 어업별
평균어획량과 평가대상어업 선정 원칙 (>75%)에 따라
어업별 누적어획량이 울진연안 연안어업 평균어획량의
78.4%를 이루는 연안자망, 정치망, 연안채낚기 어업을
평가대상어업으로 선정하였다 (Table 1). 평가대상종은
선정된 평가대상 연안어업의 어종별 어획량에서 평가
대상종 선정 원칙 (>50%)에 따라 울진연안 연안어업
평균 어획량인 8,504톤의 50%인 4,027톤을 상회하는
어종별 어획량의 합계 (4,155톤, 103.2%)를 고려하여
연안자망어업에서 대게, 살오징어, 대구 등 3종, 정치망 어업에서 살오징어, 고등어, 전갱이 등 3종, 연안채낚기 어업에서 살오징어 1종 등 총 7종을 평가대상종으로 선 정하였다 (Table 2).
Table 1. Average catch of coastal fisheries in the Uljin coastal waters from 2007 to 2011
Ecosystem Rank Fisheries Catch
(mt) Proportion (%)
Cumulative proportion
(%)
Uljin coastal waters
1 Gillnet 2,689 33.4 33.4
2 Set net 2,624 32.6 66.0
3 Jigging 1,004 12.5 78.4
4 Trap 671 8.3 86.8
5 Purse seine 557 6.9 93.7
6 Fyke net 509 6.3 100.0
7 Community 1 0.0 100.0
8 Dredge 0 0.0 100.0
Total 8,504 100.0 100.0
Table 2. Average catch of species by coastal fisheries in the Uljin coastal waters from 2007 to 2011
Fisheries Rank Species name Catch
(mt) % to 50%
catch % to total catch
Gillnet
1 Snow crab 557 13.8 6.9
2 Common squid 414 10.3 5.1
3 Pacific cod 302 7.5 3.7
Sub total 1,273 31.6 15.8
Set net
1 Common squid 930 23.1 11.5
2 Chub mackerel 759 18.9 9.4
3 Horse mackerel 226 5.6 2.8
Sub total 1,915 47.5 23.8
Jigging 1 Common squid 968 24.0 12.0
Sub total 968 24.0 12.0
Total 4,155 103.2 51.6
생태계 기반 자원평가 모델
본 연구의 자원평가 대상이 되는 연안어업은 아직까 지 자원평가를 위한 정량적 자료가 결핍되어 있어 정성 적 분석 모델을 선택하여 생태계 기반 자원평가를 실시 하였다.
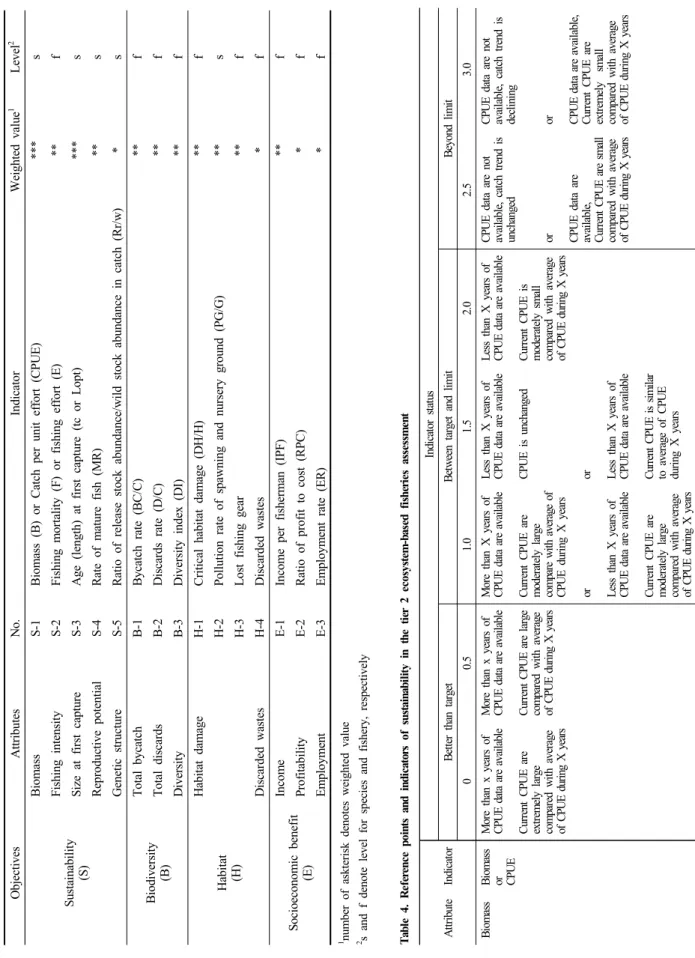
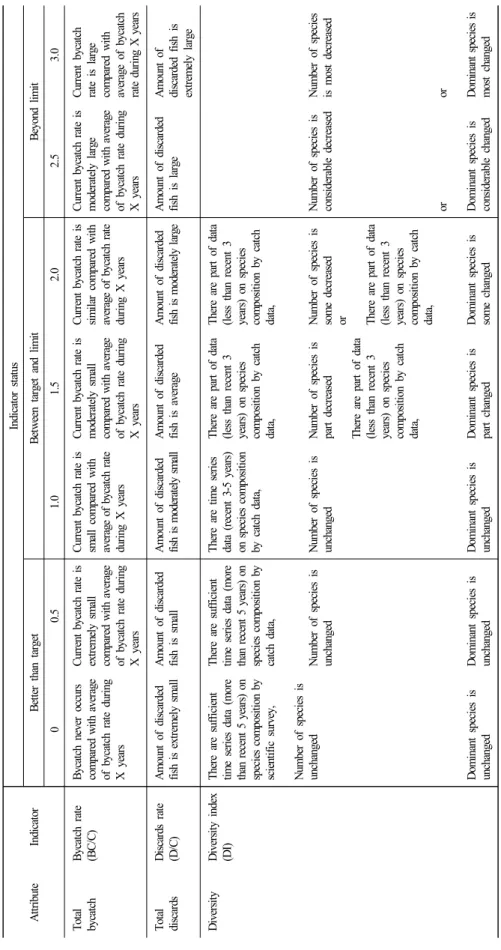
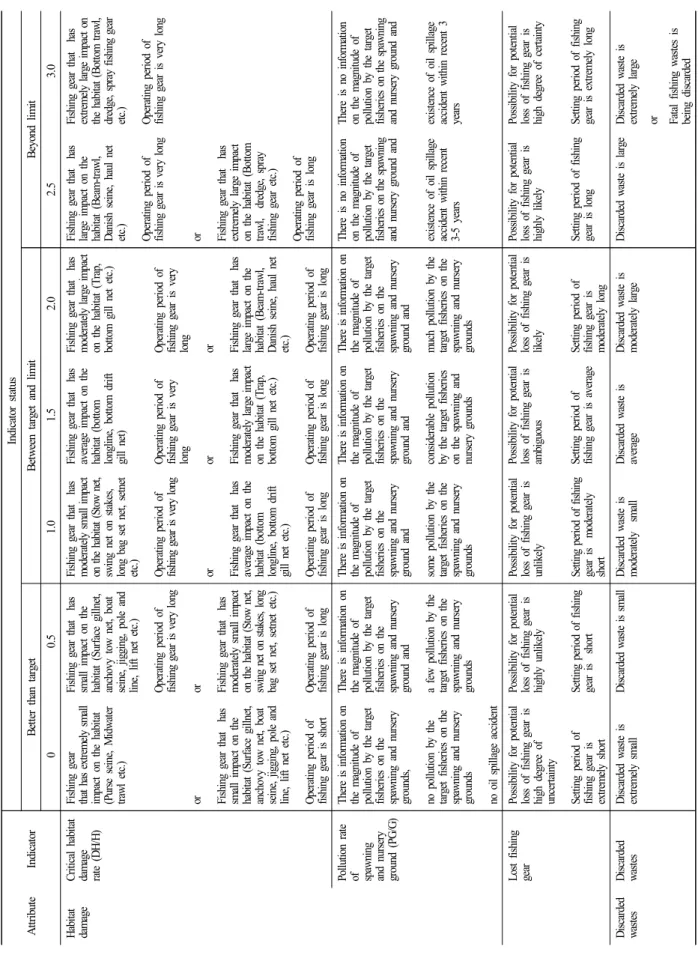
정성적 분석 모델 (tier 2)의 지표별 기준점은 Zhang et al. (2010)과 Seo (2011)에 제시된 내용을 연안어업의
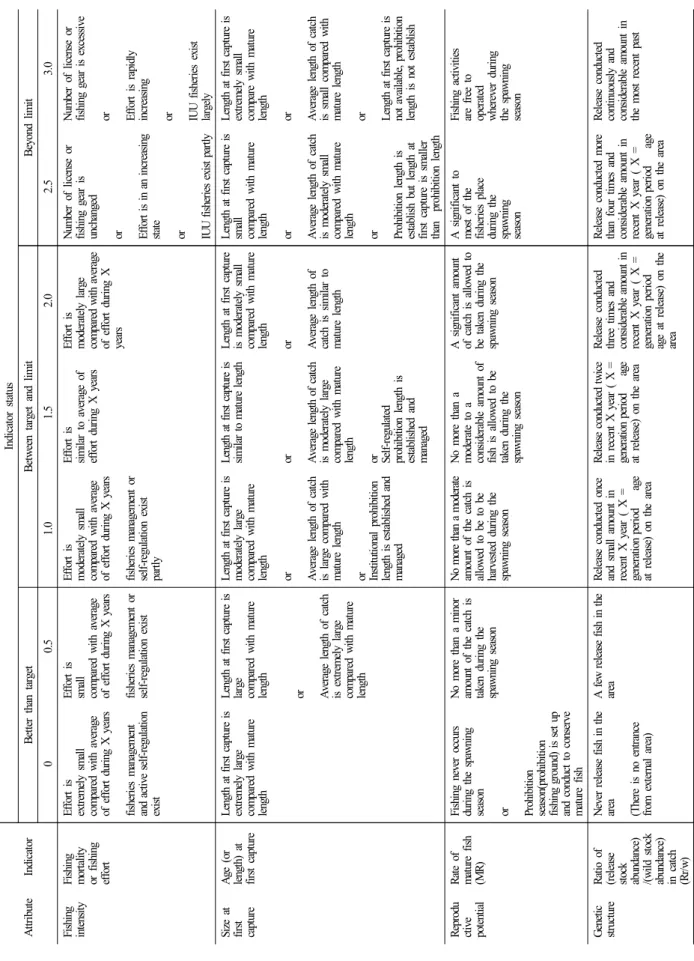
특성에 맞게 개선시켜 새롭게 정립하였는데, 지속성 유 지 (Sustainability) 목표에서는 생체량, 어획강도, 어획 개시크기, 잠재재생산, 유전적 구조의 5가지 특성 하에 고려된 지표는 생체량 (단위노력당 어획량), 어획사망 계수(어획노력량), 어획개시연령 (어획개시체장), 성숙 어 비율, 어획물 내 자연어 및 방류어 비율 등 5개였고, 생물다양성 유지 (Biodiversity) 목표에서는 총 혼획율, 총 폐기량, 다양성 등 특성 하에 혼획율, 폐기량, 종다 양도 지수 등 3개의 지표를 고려하였다. 서식처 보존 (Habitat) 목표에서는 서식처 훼손, 쓰레기 폐기량 등 2 개 특성 하에 고려된 지표는 서식처 훼손율, 산란장과 성육장 내 오염율, 어구 유실, 쓰레기 폐기량 등 4개의 지표를 고려하였다. 사회경제적 혜택 (Socio-economic benefit) 목표에서는 수입, 수익성, 고용 등 3개 특성하 에 어업인 당 소득, 비용 당 이윤비, 고용율 지표 등 3 개의 지표를 고려하였다 (Table 3). 대부분의 기준점은 생태계 기반 위험도 분석방법을 개선시킨 Park (2013) 의 연구에서 제시되었던 기준점을 고려하였지만, 생체 량 지표의 기준점에서 현재 우리나라 연안어업에서 어 획되는 대부분의 어종에 대한 표준화된 CPUE가 존재 하지 않음으로 본 연구에서는 우리나라 연안어업 특성 에 맞게 생체량 (단위노력당 어획량) 지표의 기준점을 수정하였다 (Tables 4~7). 또한, 각 지표별 위험도에 따 른 평가기준은 Table 4~7에서 제시된 기준과 Table 8에 제시된 기준에 따라 각 지표의 위험도를 평가하였다.
위험도를 평가할 때 Table 3에 제시된 바와 같이 지 속성 유지 목표의 지표는 어획사망계수 (어획노력량)를 제외한 모든 지표가 종 수준의 지표여서 각 종마다 해 당종의 특성에 따라 위험도를 각각 평가하였고, 생물다 양성 유지, 서식처 보존 및 사회경제적 혜택 목표의 각 지표는 서식처 보존 목표의 산란장 및 성육장 내 오염 율 지표를 제외하고 모든 지표가 어업 수준의 지표여서 동일한 어업의 평가대상종에 대해서는 동일한 위험도 로 평가하였다.
목표 위험도 지수 (ORI, Objective Risk Index), 종위
험도지수 (SRI, Species Risk Index), 어업위험도지수
(FRI, Fisheries Risk Index) 및 생태계위험도지수 (ERI,
Ecosystem Risk Index)는 Yoon (2014)에 제시된 방법
에 따라 추정하였다.
T ab le 3 . O bj ec tiv es a nd i nd ic at or s fo r t he t ie r 2 eco sy st em -b as ed fis he ri es a ssess m en t i n t hi s s tu dy O bje ctiv es A ttrib utes N o. Ind ic ator W eig hted v alue
1Lev el
2Su sta in ab ility (S)
B iom as s S-1 Biom as s (B ) or C atch per unit effort (C PU E) *** s Fi shin g inte nsity S-2 Fi sh in g m orta lity (F ) or fish in g effort (E ) ** f Size at fi rst capture S-3 A ge (length) at firs t capture (tc or L opt) *** s R epro du ctiv e p oten tial S-4 R ate of m ature fish (M R ) ** s G enetic s tructure S-5 R atio of release s tock abu ndance/w ild stock abundance in catch (R r/w ) * s B iod iv ersity (B )
T otal bycatch B-1 B ycatch rate (B C /C ) ** f T otal di scards B-2 D iscards rate (D /C ) ** f D iv ersity B -3 D iversity in de x (D I) ** f H abita t (H )
H abita t d am ag e H -1 C ritica l h ab itat d am ag e (D H /H ) ** f H -2 Pollution rate of spaw ning and nursery ground (P G /G ) ** s H -3 L ost fi shing gear ** f Di sc ar de d wa st es H- 4 D is ca rd ed wa st es * f So ci oeconom ic benef it (E )
Incom e E-1 Incom e per fisherm an (IP F) ** f Pr ofita bility E -2 R atio of profit to cost (R PC ) * f E m ploym ent E-3 E m ploym ent rate (E R ) * f
1num ber of as kt er is k denotes w eighted value
2s and f denot e level f or s peci es and f is her y, r es pect iv el y T ab le 4 . R ef ere nc e p oi nt s an d i nd ic at ors o f s us ta in ab ili ty i n t he t ier 2 e co sy st em- ba se d f is heri es a ss es sme nt A ttr ib ut e Indi cat or Indi cat or s tat us B ette r th an ta rg et B etw ee n ta rg et a nd lim it B ey on d lim it 0 0. 51 .01 .5 2. 02 .5 3. 0 Bi om as s Bi om as s
or CP U E
M or e t ha n x year s of C PU E d ata a re a va ila bl e Cu rr en t CP U E a re ext rem el y l ar ge co m par ed w ith aver age of C PU E dur ing X year s
M or e t han x year s of C PU E dat a ar e av ai la bl e Cu rr en t CP U E a re l ar ge co m par ed w ith av er ag e of C PU E dur ing X year s
Mo re t ha n X y ea rs o f C PU E dat a ar e av ai la bl e Cu rr en t CP U E a re m od er ate ly la rg e com par e w ith aver age of C PU E dur ing X year s or Les s t han X year s of C PU E dat a ar e av ai la bl e Cu rr en t CP U E a re m od er ate ly la rg e com par ed w ith aver ag e of C PU E dur ing X year s
Les s t han X year s of C PU E d ata a re a va ila bl e C PU E i s unchange d or Les s t han X year s of C PU E d ata a re a va ila bl e C ur re nt C PU E is s im ila r to av er ag e o f C PU E dur ing X year s
Le ss t ha n X y ea rs o f C PU E dat a ar e av ai la bl e Cu rr en t CP U E i s m od er ate ly s m al l co m par ed w ith av er ag e of C PU E dur ing X year s
C PU E dat a ar e not avai labl e, cat ch t rend i s unchange d or CP U E d at a a re avai labl e, C ur rent C PU E ar e sm al l com par ed w ith aver ag e of C PU E dur ing X year s
C PU E dat a ar e not av ai la bl e, cat ch t rend i s de cl in in g or C PU E d at a ar e avai la bl e, Cu rr en t CP U E a re ext rem el y s m al l co m par ed w ith aver age of C PU E dur ing X yea rs
Ta bl e 4 . C on tin ue d A ttr ib ut e Indi cat or Indi cat or s tat us B et ter t han t ar get B et w een t ar get and l im it B eyond l im it 0 0.5 1.0 1.5 2.0 2.5 3.0 Fi sh in g in te ns ity Fi sh in g mo rta lit y or f is hi ng effo rt
Effo rt i s ex trem el y s m al l co m par ed w ith av er ag e of e ff or t dur ing X ye ar s fis he rie s ma na ge me nt and a ct ive s el f- re gul at io n ex is t
Effo rt i s sm al l co m par ed w ith av er ag e of e ff or t dur ing X ye ar s fis he rie s ma na ge me nt o r se lf- re gul at io n e xi st
Effo rt i s mo de ra te ly s ma ll co m par ed w ith av er ag e of e ff or t dur ing X ye ar s fis he rie s ma na ge me nt o r se lf- re gul at io n e xi st pa rtly
Effo rt i s si m ila r t o av er ag e of effo rt d uri ng X y ea rs
Effo rt i s m od er ate ly la rg e co m par ed w ith av er ag e of e ffo rt d uri ng X year s
N um be r o f lic en se o r fis hi ng ge ar i s unc ha nge d or Ef fo rt is in a n in cr ea sin g st at e
or IU U f ish er ie s e xis t p artly
N um be r of l ice ns e or fis hi ng ge ar i s e xc es si ve
or Effo rt i s ra pi dl y in cr ea si ng or IU U fis he rie s e xis t la rg el y Si ze at firs t cap tu re
Ag e ( or le ngt h) a t fir st c apt ur e
Le ngt h a t f irs t ca pt ur e i s ex trem el y l ar ge co m pa re d w ith m atu re le ngt h
Le ngt h a t f irs t ca pt ur e i s la rg e co m pa re d w ith m atu re le ngt h or A ver ag e l eng th of cat ch is ex trem el y l ar ge co m pa re d w ith m atu re le ngt h
Le ngt h a t f irs t ca pt ur e i s m od er ate ly la rg e co m pa re d w ith m atu re le ngt h or A ver ag e l eng th of cat ch is l ar ge co m par ed w ith m atu re le ng th or In stitu tio na l p ro hib itio n le ngt h i s e st abl is he d a nd ma na ge d
Le ngt h a t f irs t c apt ur e i s si m ila r to m atu re le ng th or A ver ag e l en gt h o f cat ch is m od er ate ly la rg e co m pa re d w ith m atu re le ngt h
or Se lf-re gu la te d pr ohi bi tion l engt h i s es ta bl is he d a nd ma na ge d
Le ngt h a t f irs t c apt ur e is m od er ate ly s m al l co m par ed w ith m at ur e le ngt h or A ve ra ge l engt h of ca tc h is s im ila r to m atu re le ng th
Le ngt h a t f irs t c apt ur e i s sm al l co m pa re d w ith m atu re le ngt h or A ve ra ge l engt h of c at ch is m od er ate ly s m al l co m pa re d w ith m atu re le ngt h or Pr oh ib itio n le ng th is es ta bl is h but l engt h a t fir st c apt ur e i s s m al le r tha n pr ohi bi tion l engt h
Le ngt h a t f irs t c apt ur e i s ex trem el y sm al l co m par e w ith m at ur e le ngt h or A ve ra ge l engt h of c at ch is s m all c om pa re d w ith m at ur e l engt h or Le ngt h a t f irs t c apt ur e i s no t a va ila bl e, p ro hib itio n le ngt h i s not e st abl is h R epr odu ctiv e pot ent ia l
Ra te o f m at ure fi sh (M R )
Fi sh in g ne ve r oc cu rs dur ing t he s pa w ni ng se aso n or Pr ohi bi tion se as on (p ro hib itio n fis hi ng gr ound) i s s et up an d c onduc t t o c ons er ve m at ure fi sh
No m or e t ha n a m in or am ou nt o f t he cat ch i s ta ke n dur ing t he sp aw ni ng s eas on
N o m or e t han a m od er at e am ou nt o f t he cat ch i s allo w ed to b e to b e ha rv es te d dur ing t he sp aw ni ng s eas on
No m or e t ha n a mo de ra te t o a co ns id er ab le a m ount of fis h is a llo w ed to b e ta ke n dur ing t he sp aw ni ng s eas on
A s igni fic ant a m ount of c atc h is a llo w ed to be t ake n dur ing t he sp aw ni ng s eas on
A s igni fic ant t o mo st o f t he fis he rie s p la ce dur ing t he sp aw ni ng se aso n
Fi sh in g a ctiv itie s ar e f ree t o oper at ed w her ev er du rin g th e s paw ni ng se as on Ge ne tic st ru ct ur e R atio o f (r el eas e st oc k ab unda nc e) /(w ild s to ck ab unda nc e) in cat ch (R r/w )
N ev er r el ease f is h i n t he ar ea (T he re i s n o e nt ra nc e fr om ex te rn al ar ea)
A fe w re le as e fi sh i n t he ar ea R el ea se c onduc te d onc e and s m al l am ou nt i n re ce nt X ye ar ( X = ge ne ra tion pe riod ag e at r el eas e) o n t he ar ea
R el ea se c onduc te d t w ic e in r ecen t X y ear ( X = ge ne ra tion pe riod ag e at r el eas e) o n t he ar ea
R el ease co nd uc te d th re e tim es a nd cons id er abl e a m ount i n re ce nt X ye ar ( X = ge ne ra tion pe riod ag e at r el eas e) on t he ar ea
R el ea se c onduc te d m or e th an fo ur tim es a nd co ns id er ab le a m ount i n re ce nt X ye ar ( X = ge ne ra tion pe riod ag e at r el eas e) o n t he ar ea
R ele as e c on du cte d cont in uous ly a nd cons id er ab le a m ount i n th e m os t r ec ent pa st
T abl e 5 . R ef er en ce p oin ts a nd in di ca to rs o f b iod iv er sity in t he t ie r 2 e co sy st em -b as ed f ish er ie s a ss es sm en t A ttr ibut e Indi cat or
Indi cat or s tat us B et ter t han t ar get B et w ee n t ar get a nd l im it B eyond l im it 0 0. 51 .01 .5 2. 02 .5 3. 0 To ta l bycat ch B yc atc h ra te (B C /C ) B yca tc h ne ve r oc cu rs co m par ed w ith av er ag e of bycat ch r at e dur ing X y ea rs
C ur re nt b yc atc h r ate is ext rem el y s m al l co m par ed w ith aver age of bycat ch r at e dur ing X year s
C ur rent by cat ch r at e i s sm al l co m par ed w ith av er ag e of by cat ch r at e dur ing X year s
C ur re nt bycat ch r at e i s m od er ate ly s m al l co m par ed w ith av er ag e of bycat ch r at e dur ing X y ea rs
C ur re nt b yc atc h r ate is si m ila r com par ed w ith aver age of bycat ch r at e dur ing X year s
C ur rent by cat ch r at e i s m od er ate ly la rg e com par ed w ith av er ag e of by cat ch r at e dur ing X year s
C ur rent by cat ch ra te is la rg e com par ed w ith aver ag e of bycat ch ra te dur ing X year s To ta l di sc ar ds D is car ds r at e (D /C ) A m ount of di scar ded fis h i s ext rem el y s m al l A m ount of di sc ar ded fish i s s m al l A m ount of di scar de d fis h i s m od era te ly s m al l A m ount of di scar ded fis h i s av er ag e A m ount of di sc ar ded fis h is m od er ate ly la rg e A m ount of di scar de d fis h i s l arg e A m ount of di scar ded f is h i s ext rem el y l ar ge D iv er sity D iv er si ty in de x (D I) Th er e ar e s uf fici ent tim e s eri es d at a (m ore th an r ecent 5 y ear s) on sp ec ie s c om po si tio n b y sc ie nt ific s ur ve y, N um ber of s peci es i s un ch an ge d D om inant s peci es i s un ch an ge d
Th er e ar e s uf fici ent tim e s er ie s d ata (m or e th an r ecen t 5 year s) on sp eci es com pos iti on by ca tc h d ata , N um ber of s peci es i s unchange d D om inant s peci es i s unchange d
Th er e ar e t im e s er ies dat a ( recent 3- 5 year s) on s pe cie s c om po sitio n by cat ch dat a, N um be r o f sp ec ie s i s unchanged D om in an t sp ec ie s i s unchanged
Th er e ar e par t of dat a (les s t han r ecent 3 ye ar s) o n sp ec ie s com pos iti on by cat ch dat a, N um ber of s peci es i s par t decr eas ed Th er e ar e par t of dat a (les s t han r ecent 3 ye ar s) o n sp ec ie s com pos iti on by cat ch dat a, D om inant s peci es i s par t c ha nged
Th er e a re par t of dat a (le ss t ha n re ce nt 3 yea rs ) on s peci es com pos iti on by cat ch dat a, N um ber of s peci es i s so m e decr eas ed or Th er e a re par t of dat a (le ss t ha n re ce nt 3 yea rs ) on s peci es com pos iti on by cat ch dat a, D om inant s peci es i s so m e ch an ge d
N um be r o f sp ec ie s i s cons id er ab le dec reas ed or D om in an t sp ec ie s i s cons id er ab le changed
N um ber of s peci es is m os t d ec re as ed or D om in an t sp ec ie s i s m os t ch an ge d
T abl e 6 . R ef er en ce p oin ts a nd in di ca to rs o f h ab ita t in t he t ie r 2 e co sy st em -b as ed f ish er ie s a ss es sm en t A ttr ibut e Indi cat or In di cat or s tat us B ette r th an ta rg et B etw ee n ta rg et a nd lim it B ey on d lim it 0 0.5 1. 0 1.5 2. 0 2.5 3. 0 H abi ta t da m age C rit ic al habi ta t dam age ra te ( DH/ H)
Fi sh ing gear that has ext rem el y s m al l im pact on t he habi ta t (P ur se s ei ne, M idw at er traw l et c. ) or Fi shi ng gear t hat has sm al l i m pact on t he habi ta t ( Sur fa ce gi llnet , anchovy t ow net , boat se in e, j iggi ng, pol e and lin e, lift n et e tc .) O per at ing per iod of fis hi ng gear i s s hor t
Fi sh in g gear t hat has sm al l i m pact on t he habi ta t ( Sur fa ce gi llnet , anchovy t ow net , boat se in e, j iggi ng, pol e and lin e, l ift n et et c. ) O per at ing per iod of fis hi ng ge ar i s ve ry l ong or Fi sh in g gear t hat has m oder at el y s m al l i m pact on th e h ab ita t (S to w n et, sw in g net on s takes , l ong bag s et net , s et net et c. ) O per at ing per iod of fis hi ng gear i s l ong
Fi shi ng gear t hat has m oder at el y s m al l i m pact on th e h ab ita t ( Sto w n et, sw in g n et o n st akes , long bag s et net , s et net et c. ) O per at ing per iod of fis hi ng gear is ver y l ong or Fi shi ng gear t hat has aver age i m pact on t he ha bi ta t ( bo tto m longl in e, bot to m dr ift gi ll ne t e tc .) O per at ing per iod of fis hi ng gear i s l ong
Fi shi ng gear t hat has aver age i m pact on t he ha bi ta t ( bo tto m longl in e, bot to m dr ift gi ll ne t) O per at ing per iod of fis hi ng gear i s ver y long or Fi shi ng gear t hat has m oder at el y l ar ge i m pact on t he ha bi ta t ( Tr ap , bot tom gi ll ne t e tc .) O per at ing per iod of fis hi ng gear i s l ong
Fi sh in g gear t hat has m oder at el y l ar ge i m pact on t he habi ta t ( Tr ap, bo tto m g ill n et e tc .) O per at ing per iod of fis hi ng gear i s ver y long or Fi sh in g gear t hat has la rg e im pa ct o n th e habi ta t ( B eam -tr aw l, D ani sh s ei ne, haul net et c. ) O per at ing per iod of fis hi ng gear i s l ong
Fi sh ing g ear t hat h as la rg e im pa ct o n th e ha bi ta t (B ea m -tra w l, D ani sh s ei ne, haul net et c. ) O per at ing per iod of fis hi ng gear i s ver y l ong or Fi sh ing g ear t hat h as ext rem el y l ar ge i m pact on t he habi ta t ( Bot to m traw l, dr edge, s pr ay fis hi ng gear et c. ) O per at ing per iod of fis hi ng gear i s l ong
Fi shi ng gear t hat has ext rem el y l ar ge i m pact on th e h ab ita t ( Bo tto m tr aw l, dr edge, s pr ay f ishi ng gear et c. ) O per at ing per iod of fis hi ng gear i s ver y l ong Po llu tio n r ate of sp aw ni ng and nur ser y gr ound ( PG /G )
Th er e i s i nf or m at io n on th e m agni tude of pol lut ion by t he t ar get fish er ie s o n t he sp aw ni ng and nur se ry gr ounds , no pol lut ion by t he tar get f is her ie s on t he sp aw ni ng and nur se ry gr ounds no oi l spi lla ge acci dent
Ther e i s i nf or m at ion on th e m agni tude of pol lu tion by t he t ar get fis her ie s on t he sp aw ni ng and nur se ry gr ound and a f ew pol lut ion by t he ta rg et fis he rie s o n th e sp aw ni ng and nur se ry gr ounds
Th er e is in fo rm atio n o n th e m agni tude of pol lut ion by t he t ar get fish er ie s o n t he sp aw ni ng and nur se ry gr ound and so m e p ol lu tio n b y th e tar get f is her ie s on t he sp aw ni ng and nur se ry gr ounds
Th er e i s i nf or m at io n on th e m agni tude of pol lut ion by t he t ar get fish er ie s o n t he sp aw ni ng and nur se ry gr ound and cons ider abl e pol lut ion by t he t ar get f is her ie s on t he spaw ni ng and nur ser y gr ounds
Th er e i s i nf or m at io n on th e m agni tude of pol lu tion by t he t ar get fis her ie s on t he sp aw ni ng and nur se ry gr ound and m uch pol lut ion by t he ta rg et fis he rie s o n th e sp aw ni ng and nur se ry gr ounds
Th er e is n o in fo rm at io n on t he m agni tude of po llu tio n b y th e ta rg et fis her ies on t he s paw ni ng and nur se ry gr ound and exi st ence of oi l s pi llage acci dent w ith in r ecent 3- 5 y ear s
Th er e is n o in fo rm atio n on t he m agni tude of pol lut ion by t he t ar get fisher ie s o n t he spaw ni ng and nur se ry gr ound and ex is te nc e o f o il s pilla ge acci dent w ith in r ecent 3 year s Lo st fi sh in g gear Po ss ib ility f or p ot en tia l los s of f is hi ng gear i s hi gh degr ee of un ce rta in ty Se tti ng per iod of fis hi ng gear i s ext rem el y shor t
Po ssi bi lit y fo r p ot en tia l lo ss o f fi sh in g g ea r i s hi ghl y unl ikel y Se tti ng per iod of f is hi ng gear i s s hor t
Po ss ib ility f or p ot en tia l los s of f is hi ng gear i s unl ike ly Se ttin g p er io d o f f ish in g ge ar is m od er ate ly shor t
Po ss ib ility f or p ot en tia l los s of f is hi ng gear i s am bi guous Se tti ng per iod of fishi ng gear i s aver age
Po ssi bi lit y fo r p ot en tia l lo ss o f fi sh in g g ea r i s lik ely Se tti ng per iod of fis hi ng gear i s m oder at el y l ong
Po ss ib ility fo r p ote ntia l lo ss of f is hi ng gear i s hi ghl y l ik el y Set ting per iod of f is hi ng gear i s l ong
Po ss ib ility f or p ot en tia l los s of f is hi ng gear i s hi gh degr ee of cer tai nt y Se tti ng per iod of f is hi ng gear i s ext rem el y l ong Di sc ar de d wa ste s D is car ded wa ste s D is car ded w as te i s ext rem el y s m al l D iscar ded w ast e i s s m al l D is car ded w ast e is m oder at el y s m al l D is car ded w as te i s aver age D is car ded w as te i s m od er ate ly la rg e D is car ded w as te i s l ar ge D is car ded w as te is ext rem el y l ar ge or Fa ta l f is hin g w as te s is bei ng d iscar ded
T abl e 7 . R ef er enc e po in ts a nd i ndi ca to rs o f s oc io -e conom ic be ne fi t i n t he t ie r 2 e co sy st em -b as ed f is he ri es as se ss m en t A ttr ibut e Indi cat or
Indi cat or s tat us B et ter t han t ar get B et w een t ar get and l im it B eyond l im it 0 0.5 1. 0 1.5 2.0 2.5 3. 0 In com e In com e per fis he rm an (I PF)
In com e f or r ecent X year s i s ext rem el y la rg er th an th e m ini m um l ivi ng c os t In com e i s i ncr eas in g or st abl e
In co m e fo r re ce nt X year s i s l ar ger t han th e mi ni mu m l iv in g cos t In co m e i s i ncr eas in g or s tabl e
In com e f or r ecent X yea rs i s m oder at el y la rg er th an th e m ini m um l ivi ng cos t In co m e i s i nc re asi ng or s tabl e
In com e f or r ecent X ye ar s is s im ila r to th e m ini m um l ivi ng c os t In com e i s s tabl e
In co m e f or r ecent X year s i s m oder at el y sm alle r th an th e m ini m um l ivi ng cos t In co m e i s st ab le
In com e f or r ecen t X year s is s m alle r th an th e mi ni mu m l iv in g c os t In com e i s s tabl e or dec reas ing
In co m e fo r re ce nt X ye ar s i s ex trem el y sm alle r th an th e m in im um liv in g c os t In com e i s decr eas in g Pr of ita bi lity R atio o f pr of it t o co st (R PC )
Pr of it b y ta rg et fis her ie s ( pr oduct ion val ue- cos t) i s ext rem el y l ar ge
Pr of it by t ar get fis he rie s ( pr oduct ion va lu e- co st ) is la rg e
Pr of it by t ar get fish er ie s (p ro du ct io n va lu e- co st ) is m od er ate ly la rg e
Pr of it b y ta rg et fis her ie s ( pr oduct ion val ue- cos t) i s aver age
Pr of it by t ar get fis he rie s ( pr oduct ion va lu e- co st ) is m od er ate ly s m al l
Pr of it b y ta rg et f is he rie s (p ro du ct io n v al ue -c os t) i s sm al l
Pr of it b y ta rg et f is he rie s (p ro du ct io n v al ue -c ost ) is ext rem el y s m al l Em pl oym ent Em pl oym ent ra te (E R ) Index of f is he rie s em pl oym ent (num ber of fis her m an× nu m ber of fish in g v esse ls) f or re ce nt X y ea rs is ext rem el y l ar ge
Index of f is her ie s em pl oym en t (num ber of fis he rm an×num ber of f ish in g v esse ls) fo r r ecent X year s i s la rg e
In de x o f fi sh er ie s em pl oym ent (n um be r o f fis her m an×num ber of f is hi ng ves sel s) fo r r ecen t X year s i s m od er ate ly la rg e
Index of f is he rie s em pl oym ent ( num ber of f is her m an×num ber of f ish in g v esse ls) fo r re ce nt X y ea rs is av er ag e
Index of f is her ie s em pl oym en t ( num ber of f is her m an× nu m ber of f is hi ng ves sel s) f or recent X year s i s m od er ate ly s m al l
In de x o f fi sh er ie s em pl oym ent ( num be r of fis her m an×num ber of fish in g v esse ls ) f or r ec en t X year s i s s m al l
In de x o f fi sh er ie s em pl oym ent ( num ber of fis her m an×num ber of fis hi ng ves sel s) f or re ce nt X year s i s ext rem el y sm al l T ab le 8 . C ri te ri a o f r is k s ta tes fo r t he t ie r 2 eco sy st em -b as ed fis he ri es a ssess m en t M agni tude A bundance C ondi tion Li kel ihood Ri sk score R ange (% ) E xt rem ely s m all N ever or N one O ptim al, Bes t H igh degree of uncert aint y 0 <5% Sm all Part or a few N egligi ble H ighly unlikely 0.5 5-20% M od erate ly sm al l Som e M inor U nlik ely 1.0 20 -40 % A verage C onsiderable or A ver age M oderat e A m biguous 1.5 40-60% M oderately large M any or M ajor M ajor L ikely 2.0 60-80% L arge M ost Severe H ighly l ikely 2.5 80-95% E xtrem el y larg e A ll C atastrop hic, W orst H ig h degree of certai nt y, evident 3.0 >95%
자료
목표별 지표위험도 평가를 위한 자료 지속성 유지 (Sustainability)
어획량 자료는 해당 연안생태계에서 조업중인 어업 인에 대한 청취조사를 통해 파악한 해당수협 어획량 자 료를 통계청에 요청하여 어업별, 어종별 어획량을 분석 하였다. CPUE 추정을 위한 대상어업의 어선척수 자료 는 해양수산부에서 제공하는 어업별 허가척수 통계자 료를 사용하였다 (MOF, 2007~2011). 평가대상종의 체 장자료는 국립수산과학원에서 조사된 자료를 사용하였 다. 대상해역의 종묘방류실적 자료는 울진군을 통해 울진군의 연도별 어종별 종묘방류 실적자료를 수집하 였다.
생물다양성 유지 (Biodiversity)
혼획율, 종다양도 지수 추정을 위한 자료는 해당 수 협의 연도별 어종별 어획량 자료를 분석하였으며, 폐 기량은 대상어업의 어업인 청취조사 자료를 사용하였 고, 위험도를 평가하는 기준은 FAO (2005)를 참고하 였다.
서식처 보존 (Habitat)
서식처 훼손율 추정을 위해 대상 연안어업에서 사용 하고 있는 어구의 종류와 어구부설 기간을 어업인 청취 조사로부터 파악하였고, 산란장과 성육장 내 오염율, 어구 유실 자료는 대상어업의 어업인으로부터 청취조 사한 자료를 사용하였으며, 쓰레기 폐기량은 울진군의 해양 쓰레기 처리량 자료를 수집하였다.
사회경제적 혜택 (Socio-economic benefit)
사회경제적 혜택 목표의 각 지표인 어업인 당 소득 지표를 평가하기 위한 자료는 도시가구 4인기준 월평 균소득 (KOSIS, 2011) 자료와 청취조사로부터 파악한 연간 소득자료를 사용하였다. 비용 당 이윤비 자료는 통계청에서 제공한 수협 위판실적 상 대상어업의 어업 별 위판금액 자료와 어업인 청취조사로부터 수집한 비 용자료를 사용하였다. 고용율 자료는 해당 연안어업의 연도별 허가척수자료와 청취조사로
부터 파악한 해당어업의 조업인원수 자료 등을 사용 하여 분석하였다.
결 과
목표별 및 지표별 위험도 지수
지속성 유지
생체량 (단위노력당 어획량)
2007~2011년 연안자망어업에서 어획된 살오징어의 평균 CPUE에 비해 2011년 CPUE는 83% 감소하여 Table 4에 제시된 단위노력당 어획량 지표의 기준점인 CPUE 자료가 있으나, 현재 CPUE가 x년간 평균 CPUE 보다 극히 작아짐에 따라 위험도 (RS)는 3.0으로 평가 되었다. 대게의 5년 평균 CPUE에 비해 2011년 CPUE 는 8% 증가한 것으로 나타나 Table 4에 따라 위험도는 1.5로 평가되었다. 대구의 5년 평균 CPUE에 비해 2011 년 CPUE는 57% 감소한 것으로 나타나 Table 4에 따라 위험도는 2.5로 평가되었다 (Table 9).
2007~2011년 정치망어업에서 어획된 살오징어의 평 균 CPUE에 비해 2011년 CPUE는 90%가 감소하여 Table 4에 따라 위험도는 3.0으로 평가되었다. 고등어 는 평균 CPUE에 비해 2011년 CPUE는 52% 감소하여 위험도는 2.5로 평가되었다. 전갱이는 평균 CPUE에 비 해 2011년 CPUE는 91%가 감소하여 위험도는 3.0으로 평가되었다 (Table 10).
2007~2011년 연안채낚기어업에서 어획된 살오징어 는 평균 CPUE에 비해 2011년 CPUE가 83% 감소하여 위험도는 3.0으로 평가되었다 (Table 11).
어획사망계수 (어획노력량)
연안자망어업의 어획노력량 지표에서 어업인 청취조 사 결과 연안자망에서는 사용이 금지된 삼중자망 어구 를 사용하는 것이 일부 존재하는 것으로 조사됨에 따라, Table 4에 제시된 어획노력량의 기준점인 불법 어업이 일부 존재하는 경우로 판단되어 위험도는 2.5로 평가되 었고, 어획노력량 지표는 어업 수준의 지표여서 평가대 상종 간에 동일한 위험도를 적용하였다 (Table 9).
2007~2011년 정치망의 평균 허가척수에 비해 2011 년 허가척수는 3%가 줄어들어 Table 4에 따라 위험도 는 1.5로 평가되었고, 어획노력량 지표는 어업 수준의 지표여서 평가대상종 간에 동일한 위험도를 적용하였 다 (Table 10).
2007~2011년 연안채낚기어업의 평균 허가척수에 비
해 2011년 허가척수는 16%가 줄어들어 Table 4에 따라
위험도는 1.5로 평가되었다 (Table 11).
어획개시연령 (어획개시체장)
연안자망어업에서 어획된 살오징어의 어획개시체장 자료가 없었고, 현재 살오징어에 대해서는 금지체장도 설정되어 있지 않아 Table 4에 따라 위험도는 3.0으로 평가되었다. 2011년 연안자망어업에서 어획된 대게의 최소갑폭은 91.6 mm였고, 대게의 성숙갑폭은 63.9 mm (NFRDI, 2008)이고 어획개시체장이 성숙체장보다 커 서 위험도는 1.0으로 평가되었다. 2011년 대구의 어획 개시체장은 31.0 cm였고, 대구의 성숙체장은 56.3 cm (Cha et al., 2007)로 2011년 어획개시체장은 성숙체장 의 55% 수준으로 Table 4에 따라 위험도는 2.0으로 평 가되었다 (Table 9).
Table 9. Risk scores (RS), objectives risk index (ORI) and species risk index (SRI) for the tier 2 EBFA of coastal gillnet fisheries in the Uljin coastal waters, 2011
Objectives
1Indicator
2Risk score of coastal gillnet Common
squid Snow
crab Pacific cod
Sustainability (S)
S-1 3.0 1.5 2.5
S-2 2.5 2.5 2.5
S-3 3.0 1.0 2.0
S-4 2.5 1.5 0.5
S-5 0.0 0.0 0.0
Biodiversity (B)
B-1 2.5 2.5 2.5
B-2 3.0 3.0 3.0
B-3 1.5 1.5 1.5
Habitat (H)
H-1 2.0 2.0 2.0
H-2 2.0 2.0 2.0
H-3 3.0 3.0 3.0
H-4 2.0 2.0 2.0
Socio-economic benefit (E)
E-1 2.5 2.5 2.5
E-2 2.0 2.0 2.0
E-3 1.5 1.5 1.5
ORI_S 2.5 1.4 2.0
ORI_B 2.3 2.3 2.3
ORI_H 2.3 2.3 2.3
ORI_E 2.1 2.1 2.1
SRI 2.4 1.9 2.2
1
ORI_S, B, H and E denote objectives risk index of sustainability, biodiversity, habitat and socio-economic benefit, respectively
2
Abbreviations of indicator are presented in Table 3
2011년 정치망에서 어획된 살오징어의 어획개시체장 은 8.4 cm였고, 살오징어의 성숙체장은 20.0 cm (NFRDI, 2010a)로써 어획개시체장은 성숙체장의 42% 수준이므
로 위험도는 2.0으로 평가되었다. 2011년 고등어의 어획 개시체장은 18.0 cm였고, 성숙체장은 28.6 cm (NFRDI, 2010a)로써, 2011년 어획개시체장은 성숙체장의 63%
수준이었으므로 위험도는 2.0으로 평가되었고, 2011년 울진연안 정치망에서 어획된 전갱이의 어획개시체장은 13.0 cm, 성숙체장은 19.9 cm (NFRDI, 2010a)로 2011 년 어획개시체장은 성숙체장의 65% 수준으로 위험도 는 2.0으로 평가되었다 (Table 10).
2011년 연안채낚기어업에서 어획된 살오징어의 어획 개시체장은 11.2 cm였고, 살오징어의 성숙체장은 20 cm (NFRDI, 2010a)로써 어획개시체장은 성숙체장의 44%
수준이므로 위험도는 2.0으로 평가되었다 (Table 11).
성숙어 비율
살오징어의 산란기는 춘계군 1~3월, 여름군 6~8월 및 동계군 9~11월 (NFRDI, 2010a)이고, 2009~2011년 연안자망어업에서 어획된 살오징어의 산란기 어획비율 의 합계는 91.1%로써 Table 4에 따라 위험도는 2.5로 평가되었다 (Table 10). 대게의 산란기인 2~3월과 6~8 월 (NFRDI, 2008)간 대게의 산란기 어획비율 합계는 40.1%로써 위험도는 1.5로 평가되었다. 대구의 산란기 인 11~2월 (Cha et al., 2007)간 대구의 산란기 어획비 율의 합계는 10.0%로 위험도는 0.5로 평가되었다 (Table 9).
정치망에서 어획된 살오징어의 산란기의 어획비율은 94.0%로 추정되어 위험도는 2.5로 평가되었다. 고등어 의 산란기인 3~7월 (NFRDI, 2010a)간 어획비율은 0.4%로 위험도는 0으로 평가되었다. 전갱이의 산란기 인 1~5월 (NFRDI, 2010a)간 어획비율의 합은 1.5%로 위험도는 0으로 평가되었다 (Table 10).
살오징어의 산란기 시 연안채낚기어업에서 어획된 살오징어의 어획비율의 합계는 86%로 위험도는 2.5로 평가되었다 (Table 11).
어획물 내 자연어 및 방류어 비율
2004~2011년간 울진군 연안의 종묘방류 실적 자료로
부터 대상해역 내에 연안자망어업의 평가대상종인 살오
징어, 대게, 대구와 정치망의 평가대상종인 살오징어, 고
등어, 전갱이 및 연안채낚기의 평가대상종인 살오징어의
종묘방류는 전혀 이루어지지 않았으므로 Table 4에 따라
위험도는 0으로 평가되었다 (Table 9, 10 and 11).
Table 10. Risk scores (RS), objectives risk index (ORI) and species risk index (SRI) for the tier 2 EBFA of set net fisheries in the Uljin coastal waters, 2011
Objectives
1Indicator
2Risk score of set net Common
squid Chub
mackerel Horse mackerel
Sustainability (S)
S-1 3.0 2.5 3.0
S-2 1.5 1.5 1.5
S-3 2.0 2.0 2.0
S-4 2.5 0.0 0.0
S-5 0.0 0.0 0.0
Biodiversity (B)
B-1 3.0 3.0 3.0
B-2 1.5 1.5 1.5
B-3 1.0 1.0 1.0
Habitat (H)
H-1 1.0 1.0 1.0
H-2 2.0 2.0 2.0
H-3 0.5 0.5 0.5
H-4 1.0 1.0 1.0
Socio-economic benefit (E)
E-1 1.0 1.0 1.0
E-2 2.0 2.0 2.0
E-3 1.5 1.5 1.5
ORI_S 2.1 1.5 1.6
ORI_B 1.8 1.8 1.8
ORI_H 1.1 1.1 1.1
ORI_E 1.4 1.4 1.4
SRI 1.7 1.5 1.5
1
ORI_S, B, H and E denote objectives risk index of sustainability, biodiversity, habitat and socio-economic benefit, respectively
2
Abbreviations of indicator are presented in Table 3
생물다양성 유지 혼획율
평가 대상연안어업의 어종별 어획량에서 각 대상어 업의 평가 대상종을 제외하고 2011년의 어종별 어획량 상위 5개종의 어획비율의 합을 혼획율로 정의하여 분 석하였다 (Park, 2013). 연안자망어업의 2007~2011년 평균 혼획율에 비해 2011년 혼획율은 36%가 증가하여, Table 5에 따라 위험도는 2.5로 평가되었다 (Table 9).
정치망어업에서 2007~2011년 평균 혼획율에 비해 2011년 혼획율은 118%가 증가하여 Table 5에 따라 위 험도는 3.0으로 평가되었다 (Table 10).
2011년 연안채낚기어업 살오징어의 2007~2011년 평 균혼획율에 비해 2011년의 혼획율은 141%가 증가하여, Table 5에 따라 위험도는 3.0으로 평가되었다 (Table 11).
Table 11. Risk scores (RS) of tier 2 ecosystem-based fisheries assessment approach for the coastal jigging fisheries in the Uljin coastal waters, 2011
Objectives
1Indicator
2Risk score of coastal jigging Common squid
Sustainability (S)
S-1 3.0
S-2 1.5
S-3 2.0
S-4 2.5
S-5 0.0
Biodiversity (B)
B-1 3.0
B-2 0.5
B-3 0.5
Habitat (H)
H-1 0.5
H-2 2.0
H-3 2.5
H-4 2.5
Socio-economic benefit (E)
E-1 2.5
E-2 3.0
E-3 2.0
ORI_S 2.1
ORI_B 1.3
ORI_H 1.8
ORI_E 2.5
SRI 1.9
1
ORI_S, B, H and E denote objectives risk index of sustainability, biodiversity, habitat and socio-economic benefit, respectively
2
Abbreviations of indicator are presented in Table 3
폐기량
FAO (2005)에 따르면 자망어업의 어획물의 평균 폐
기율은 0.5%이고 연안자망어업의 청취조사 결과 울진
연안 연안자망어업의 어획물의 폐기량은 15~20%로 나
타나 FAO (2005)에서 제시한 평균 폐기율에 비해 높았
고 Table 5에 따라 위험도는 3.0으로 평가되었다 (Table
9). 정치망어업의 폐기율은 정치망어업의 어종별 평균
어획비율에서 1% 미만인 어종별 어획량의 어획비율의
합을 폐기율로 정의하여 분석한 결과, 평균폐기율에 비
해 2011년 폐기율은 13%가 증가하였다. 따라서, Table
5에 따라 위험도는 1.5로 평가되었다 (Table 10). 울진
연안 연안채낚기어업의 경우 낚시를 이용하여 야간에
살오징어를 대상으로 주로 조업하는 어구이고 어획폐
기물이 거의 없으며 청취조사 결과에서도 폐기량은 거
의 없음으로 조사되어 Table 5에 따라 위험도는 0.5로
평가되었다 (Table 11).
종다양도 지수
연안자망어업의 어업인 청취조사 결과 울진연안에서 연안자망에서 어획되던 임연수어 등은 최근 거의 어획 되지 않는다고 조사되어 Table 5에 따라 출현종수가 일 부감소한 것으로 판단되어 위험도는 1.5로 평가되었다 (Table 9). 정치망어업은 평균 어종수에 비해 2011년 어 종수가 10% 증가하여 위험도는 1.0으로 평가되었다 (Table 11). 연안채낚기어업의 평균 어종수에 비해 2011 년 어획 어종수는 71% 증가하여 위험도는 0.5로 평가 되었다 (Table 11).
서식처 보존 서식처 훼손율
연안자망어업의 청취조사 결과 주 사용어구는 저자망 어업으로 서식처에 영향을 많이 미치고 어구 부설 기간 도 10~15일로 긴 것으로 나타나 Table 6에 따라 위험도 는 2.0으로 평가되었다 (Table 9). 정치망어업은 Table 6 에 따라 위험도는 1.0으로 평가되었다 (Table 10). 울진 연안 연안채낚기어업은 Table 6에 따라 위험도는 0.5로 평가되었다 (Table 11).
산란장과 성육장 내 오염율
서식처 훼손율 지표에서 제시된 연안자망어업의 청취 조사 결과와 Table 6에 따라 위험도는 2.0으로 평가되었 다 (Table 9). 정치망어업은 서식처에 영향이 어느 정도 있는 어구 (안강망, 주목망, 낭장망, 정치망 등)에 해당 되어 위험도는 1.0으로 평가되었다 (Table 10). 울진연 안 연안채낚기어업의 경우 어업인 청취조사 결과 하루 조업에 자동조상기 10틀 중 1~2틀이 유실된다는 조사 결과에 따라 위험도는 2.0으로 평가되었다 (Table 11).
어구 유실
연안자망어업의 청취조사 결과 연안자망어업의 어구 유실 비율은 20~30%로 조사되었고, 어구 설치 기간이 평균 10~15일로 어구의 설치 기간이 매우 긴 것으로 나타나 Table 6에 따라 위험도는 3.0으로 평가되었다 (Table 9). 정치망어업은 수중에 어구를 고정시켜 어획 하는 어법으로 어구유실가능성이 크게 없어 위험도는 0.5로 평가되었다 (Table 10). 울진연안 연안채낚기어업 의 청취조사에서 조사된 어구유실율 (1~2틀/1일)을 고 려하여 위험도는 2.5로 평가되었다 (Table 11).
쓰레기 폐기량
청취조사에서 조사된 연안자망어업의 어구유실율을 고려하여 위험도는 2.0으로 평가되었다 (Table 9). 정치 망어업의 쓰레기 폐기량은 대상어업에 의한 쓰레기 폐 기량 정보 자료를 구할 수가 없어 울진군 해양쓰레기 처리량 결과를 참고하여 (Yoon, 2014) 위험도는 1.0으 로 평가하였다 (Table 10). 울진연안 연안채낚기어업은 어구유실율을 고려하여 위험도는 2.5로 평가하였다 (Table 11).
사회경제학적 혜택 어업인 당 소득
어업인 당 소득 지표의 위험도를 평가하기 위해 Park (2013)에서 제시된 방법에 따라 도시가구 월평균소득자 료 (KOSIS, 2011)와 청취조사 결과로부터 각 어업의 연간 소득 자료를 수집하였다.
2011년 도시가구 4인 가구 기준의 연간소득은 약 5,546만원이었고, 청취조사를 통해 파악된 울진연안자 망어업 어업인의 연간 평균소득은 3,000만원으로 도시 가구 소득의 54% 수준에 불과하여 Table 7에 따라 위 험도는 2.5로 평가되었다 (Table 9).
정치망어업의 소득은 4억 7천 5백만원이었고, 어업비 용은 3억 9천 1백만원이었으며, 따라서 어업이익은 8천 4백만원으로 (NFRDI, 2010b) 도시가구 4인 가구 기준 의 연간 소득에 비해 51% 높은 수준으로 위험도는 1.0 으로 평가되었다 (Table 10).
청취조사를 통해 파악된 울진연안채낚기어업 어업인의 연간 평균소득은 2,000만원으로 도시가구 소득의 36%
수준에 불과하여 위험도는 2.5로 평가되었다 (Table 11).
비용 당 이윤비
비용 당 이윤비 지표의 위험도를 평가하기 위해 2007~ 2011년의 평가대상어업의 위판금액 자료와 청취 조사 결과로부터 비용자료를 수집하였다. 2007~2011년 연안자망어업의 평균 위판금액에 비해 2011년 위판금액 은 14% 증가하였으나 청취조사 결과 비용은 평균 40%
증가된 것으로 나타나 위험도는 2.0으로 평가되었다
(Table 9). 2007~2011년 정치망어업의 평균 위판금액에
비해 2011년 위판금액이 31% 감소한 것으로 나타나 위
험도는 2.0으로 평가되었다 (Table 10). 2007~2011년 연
안채낚기어업의 평균 위판금액에 비해 2011년 위판금액
이 59% 감소한 나타났고, 청취조사 결과 비용은 평균 50% 증가되어 위험도는 3.0으로 평가되었다 (Table 11).
고용율
고용율 지표의 위험도를 평가하기 위해 평가대상어 업의 허가척수 자료와 청취조사로부터 조업인원수 자 료를 분석하였다. 2007~2011년 연안자망어업의 평균고 용인원수와 2011년 고용인원수는 거의 같아 위험도는 1.5로 평가되었다 (Table 9). 2007~2011년 정치망어업 의 평균고용인원수에 비해 2011년 고용인원수는 3%
감소한 것으로 분석되어 위험도는 1.5로 평가되었다 (Table 10). 2007~2011년 연안채낚기어업의 평균고용 인원수에 비해 2011년 고용인원수는 16% 감소한 것으 로 분석되어 위험도는 2.0으로 평가되었다 (Table 11).
종위험도지수 (SRI), 어업위험도지수 (FRI), 생태계위 험도지수 (ERI)
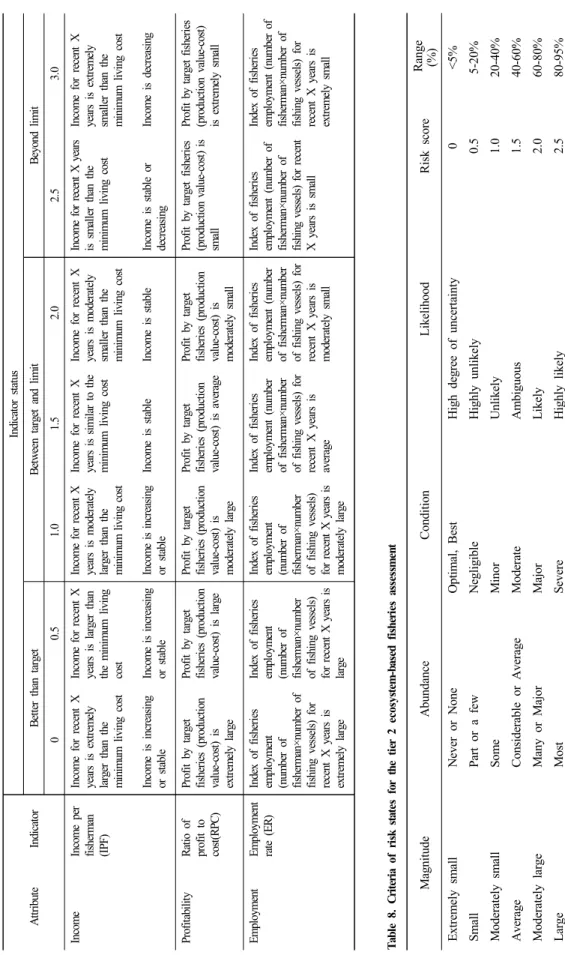
연안자망어업의 살오징어의 목표위험도지수 (ORI)는 지속성 유지 2.5, 생물다양성 유지 2.3, 서식처 보존 2.3, 사회경제적 혜택 2.1이었고 (Table 9 및 Fig. 2), 목 표위험도지수로부터 살오징어의 종위험도지수 (SRI)는 2.4로 추정되었다. 대게의 목표위험도지수는 지속성 유 지 1.4, 생물다양성 유지 2.3, 서식처 보존 2.3, 사회경 제적 혜택 2.1이었고, 대게의 종위험도지수는 1.9로 추 정되었다. 대구의 목표위험도지수는 각각 2.0, 2.3, 2.3, 2.1로 추정되었고, 종위험도지수는 2.2로 추정되었다.
울진연안 연안자망어업에서 어획되는 살오징어, 대게 및 대구의 목표위험도지수를 살펴보면 대게의 지속성 유지 목표위험도 지수 1.4를 제외하고 모두 고위험도로 나타났다. 살오징어의 지속성유지 목표에서 2011년 CPUE는 평균에 비해 83%나 줄어들어 단위노력당어획 량 지표가 고위험도로 추정되었고, 사용이 금지된 삼중 자망 어구를 사용하는 것이 일부 존재하는 것으로 조사 됨에 따라 노력량 지표도 고위험도로 추정되었으며, 금 지체장도 설정되어 있지 않아 고위험도로 추정되었다.
또한, 산란기에 어획이 대부분이 이루어져 성숙어비율 도 고위험도를 나타냈다. 생물다양성 유지 목표에서도 연안자망어업은 비목표종의 어획물이 극히 많고, 어획 물의 폐기량도 FAO (2005)에서 제시한 자망의 평균 폐 기율보다 훨씬 높은 것으로 나타났다. 서식처 보존 목 표에서도 서식처에 영향이 많이 있는 저자망 어구를 사
용하고, 최근 불법조업으로 인한 어구 유실이 많으며, 어구유실율도 20~30%로 높고, 어구설치기간도 10~15 일로 매우 길어 어구 유실로 인한 폐기된 쓰레기량도 높은 것으로 분석되었다. 사회경제적 혜택 목표에서도 소득은 4인 도시가구 월평균소득에 비해 적어 고위험 도로 평가되어 살오징어의 종위험도는 2.4로 고위험도 를 나타냈다 (Table 9).
울진연안 정치망어업의 살오징어의 목표위험도지수 는 지속성 유지 2.1, 생물다양성 유지 1.8, 서식처 보존 1.1, 사회경제적 혜택 1.4였고 (Table 10 및 Fig. 2), 살 오징어의 종위험도지수는 1.7로 추정되었다. 고등어의 목표위험도지수는 지속성 유지 1.5, 생물다양성 유지 1.8, 서식처 보존 1.1, 사회경제적 혜택 1.4였고, 고등어 의 종위험도지수는 1.5로 추정되었다. 전갱이의 목표위 험도지수는 각각 1.6, 1.8, 1.1, 1.4로 추정되었고, 종위 험도지수는 1.5로 추정되었다.
울진연안 정치망어업에서 어획되는 살오징어, 고등어 및 전갱이의 목표위험도지수를 살펴보면 살오징어의 지속성 유지 목표위험도 지수 2.1을 제외하고 모두 중 위험도로 나타났다. 살오징어의 지속성유지 목표에서 2011년 CPUE는 평균에 비해 90%나 줄어들어 단위노 력당어획량 지표가 고위험도로 추정되었고, 어획개시 체장은 성숙체장보다 작았고, 산란기에 어획이 대부분 이 이루어져 성숙어비율도 고위험도를 나타냈다 (Table 10). 나머지 지표들은 대부분 중위험도를 나타내어 연 안자망어업의 목표위험도지수와 비교하여 낮은 위험도 를 나타냈다.
연안채낚기어업의 살오징어의 목표위험도지수는 지
속성 유지 2.1, 생물다양성 유지 1.3, 서식처 보존 1.8,
사회경제적 혜택 2.5이었고 (Table 11 및 Fig. 2), 살오
징어의 종위험도지수는 1.9로 추정되었다. 살오징어는
지속성 유지 목표와 사회경제적 혜택 목표에서 고위험
도를 나타냈는데, 이는 지속성 유지 목표의 단위노력당
어획량 지표에서 최근 CPUE가 평균 CPUE에 비해
83%나 감소하였고, 어획개시체장 지표에서도 어획개시
체장이 성숙체장보다 작아 고위험도로 평가되었으며,
산란기에 어획이 집중되어 성숙어비율 지표에서도 고
위험도를 나타냈다. 사회경제적 혜택 목표의 어업인 당
소득 지표에서 평균소득이 도시가구 월평균 소득의
36%에 불과하여 고위험도를 나타냈고, 2011년 위판금
액도 평균 위판금액에 비해 41% 수준에 불과하고 비용
(A)
(B)
(C)
Fig. 2. Diagram showing objectives risk index for coastal gillnet fisheries (A), set net fisheries (B) and coastal jigging fisheries (C) using tier 2 EBFA in the Uljin coastal waters, 2011. CS, SC, PC, CM and HM denote common squid, snow crab, Pacific cod, chub mackerel and horse mackerel, respectively.
도 증가하여 고위험도를 나타냈으며, 조업고용지수도 작아지고 있는 것으로 나타났다 (Table 11).
울진연안 평가대상종인 7종의 종위험도지수에서는 연 안자망의 살오징어가 2.4로 가장 높은 종위험도를 보였 고, 다음으로 연안자망의 대구 2.2, 연안자망의 대게 및 연안채낚기의 살오징어 1.9의 순으로 종위험도가 높았다 (Table 12). 울진연안 연안자망어업의 어업위험도지수 (FRI)는 각 목표위험도지수와 2011년 대상종별 CPUE에 따라 2.0으로 추정되었고, 정치망어업과 연안채낚기어업 의 어업위험도지수는 각각 1.5, 1.9로 추정되어 연안자망 은 고위험도, 정치망과 연안채낚기는 중위험도를 나타냈 고, 각 어업위험도지수와 2011년 각 어업의 어획량 가중 치로부터 울진연안 생태계위험도지수 (ERI)는 1.8로 고 위험도에 가까운 높은 중위험도를 나타냈다 (Table 12).
Table 12. Species risk index (SRI), fishery risk index (FRI) and ecosystem risk index (ERI) of coastal fisheries in the Uljin coastal waters, 2011
Fisheries Species Risk index
SRI FRI ERI
Coastal gillnet
Common squid 2.4
2.0
1.8
Snow crab 1.9
Pacific cod 2.2 Set net
Common squid 1.7
1.5 Chub mackerel 1.5
Horse mackerel 1.5
Coastal jigging Common squid 1.9 1.9
고 찰