532 Corresponding author: [email protected]
✽동해안 중북부 대진 해역의 해조상 및 군집구조
김영대✽・공용근1・전창영2・송홍인3・박미선・이채성・유현일・김영환4
국립수산과학원 동해수산연구소,
1국립수산과학원 해조류바이오연구센터,
2
국립수산과학원 남서해수산연구소,
3국립수산과학원,
4충북대학교 생물학과
Marine Algal Flora and Community Structure in Daejin on the Mid-East Coast of Korea
Young Dae Kim*, Yong Gun Gong
1, Chang Yeong Jeon
2, Hong In Song
3, Mi Seon Park, Chae Sung Lee, Hyun Il Yoo and Young Hwan Kim
4East Sea Fisheries Research Institute, Kangneung, NFRDI 210-860, Korea
1
Seaweed Research Institute, NFRDI, Mokpo 530-831, Korea
2
Southwest Fisheries Research Institute, NFRDI, Incheon 400-420, Korea
3
National Fisheries Research & Development Institute, Busan 619-705, Korea
4
Department of Biology, Chungbuk National University, Cheongju 361-763
Seaweed biomass was estimated in the rocky subtidal zone of Daejin on the mid-east coast of Korea using a destructive sampling method from February to November 2007. Monthly sampling was conducted at depths of 5, 10 and 15 m using 50 × 50 cm quadrats. A total of 73 species, including 5 chlorophytes, 25 phaeophytes, 43 rhodophytes and one seagrass were identified. Average seaweed biomass was 2,852.3 g wet wt. m-2 and biomass values varied monthly from 1,189.8 g to 7,523.7 g. The species dominant in biomass were Laminaria japonica (481.7 g), Sargassum confusum (470.85 g), Undaria pinnatifida (422.57 g), Costaria costata (282.16 g), Odonthalia corymbifera (174.46 g), S. sagamianum (163.22 g) and S.
horneri (122.18 g). The vertical distribution of algae was characterized by S. confusum and U. pinnatifida
at 5 m, L. japonica and U. pinnatifida at 10 m, and O. corymbifera and L. japonica at 15 m depth. The C/P, R/P and (R+C)/P values were 0.20, 1.72 and 1.92, respectively.Key words: Algal flora, Community, Daejin, Diversity, Marine forest
서 론
우리나라의 동해 중부에 위치하는 강원도 연안은 북한 한류 와 동한 난류가 교차하는 해역으로 남․서해안에 비해 수심이 깊고, 파도가 강할 뿐만 아니라 해저 지형의 특수성으로 해류 와 조류는 물론 해황의 변동이 지금까지 알려진 것 보다 매우 복잡한 변화를 보이고 있다 (Kim and Kim, 1983). 이러한 해양 환경의 특수성으로 인해 강원 연안에는 다양한 해조류가 조간 대부터 조하대 수심 30 m까지 생육하고 있다 (NFRDI, 2005;
2006; 2007). 해조류는 해양생태계에서 1차 생산자로서의 역 할 뿐만 아니라, 연안에 생육하는 다양한 어․패류에게 산란장, 서식지 및 은신처 (Lindstrom, 2009)를 제공하여 연안 어장의 자원 증대에도 크게 기여한다. 이외에도 식용, 의약품, 사료 등으로 이용되고 있다 (Worm et al., 2000). 최근에는 이산화탄 소 저감 (Gao and McKinley, 1994) 및 바이오에너지원 (Chunhan, 1987; Horn et al., 2000)으로써 해조류 이용에 대한 연구가 진행되고 있다. 고착성 해조류는 해양환경의 변화에 따라 출현종 및 군집 구성이 변화하는 특징 때문에 장기적인 환경 변화를 모니터링하는 생물지표 (bio-indicator)로 활용이 가능하다. 뿐만 아니라, 해조류의 종조성과 군집구조의 분석 은 연안 생태계의 다양성과 생산성을 평가하는 중요한 기준으
로 활용될 수 있다. 특히 높은 생물량과 종다양성을 나타내는 조하대 해조류 군집의 연구결과는 해양환경 보전을 위한 필수 분야로써 해수온 상승과 갯녹음 확산 등에 의해 황폐화되어가 는 연안의 환경복원을 위한 기초 자료로 활용이 가능하다.
한편, 동해안의 갯녹음은 1999년에 평균 16.1%로 동해 중부 해역에서는 갯녹음이 발견되지 않았으나 2004년에는 동해 중부 강릉해역 (강원도)이 7.0%, 동해 남부 (경북) 해역이 31.0%로 갯녹음이 동해 북부 해역으로 점차 확산되고 있으며, 남부지방은 심화되고 있는 것으로 확인되고 있다 (NFRDI.
2004). 이에 대한 대책으로 국립수산과학원에서는 2009년부 터 전국 연안에 대규모 바다숲을 조성하고 있다 (NFRDI, 2009).
우리나라 연안의 해조류에 대한 연구는 Okamura (1892) 에
의해 시작되었으며, 이후 Kang (1966)은 수온, 조류 등의 해역
환경에 따른 해조류의 분포를 논하며 우리나라 해역을 5개
구역 (동해안 북부, 동해안 중남부, 남해안, 서해안 및 제주도)
으로 구분하였고, 총 414종의 해조류를 보고하였다. 동해안의
해조류에 대하여 그간 많은 연구가 수행되었으나, 대부분이
접근이 용이한 조간대를 대상으로 이루어졌으며 (Boo and Lee,
1986; Boo, 1987; Lee and Lee, 1988; Lee et al., 1993; Lee
and Kim, 1999), 조하대 해조상 연구는 비교적 드물다
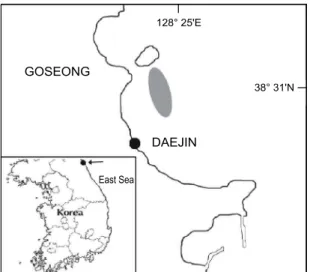
Fig. 1. The map showing sampling sites in Daejin of Korea.
(Chung et al., 1991; Shin et al., 2008a, b; Choi et al., 2009).
특히 고성군 대진해역에 대한 연구는 Shin et al. (2008a, b)의 연구만이 수행되었을 뿐 생태학적 특성에 대한 연구가 부족하다.
또한, 갯녹음이 진행된 해역에서 바다숲 조성 후 종조성, 생물량 및 군집구조 등이 갯녹음 진행 이전의 상태로 복구되 었는지를 비교분석 및 평가를 위해서는 갯녹음 진행이전의 연구가 반드시 필요하다. 따라서 본 연구는 아직까지 자연상 태의 풍부한 생물량을 보이는 동해 중부 대진해역의 해조상 및 군집구조 분석을 통하여 환경상태를 파악하고 수심별 생물 량, 종다양도, 우점도 분석을 통해 바다숲 조성을 위한 대상종 과 조성 수심 선정에 기초자료로 활용하고, 바다숲 조성 이후 평가를 위한 객관적인 자료를 확보하기 위해 수행되었다.
재료 및 방법
채집방법
해조상 및 군집조사는 동해 중북부 대진 연안 (38˚30' N, 128˚25' E)에서 2007년 2월부터 11월까지 10개월간 월별로 실시되었다 (Fig. 1). 생물량 (Biomass) 측정을 위한 정량 조사 는 조하대 5, 10, 15 m 수심에서 10 cm × 10 cm로 구획된 방형구 (50 cm × 50 cm)를 각각 4개씩 설치하고, 방형구 내에 출현하는 해조류를 끌칼을 이용하여 모두 채집하였다. 채집된 재료는 현장에서 10% 포르말린-해수 용액으로 고정시켜 실험 실로 운반하여 검경 및 동정하였으며, 출현종의 목록 및 국명 은 Lee and Kang (2002)에 따랐다. 생물량은 방형구별로 채집 된 분류군 중에서 피도값이 2% 이상인 해조류를 담수로 깨끗 이 씻어서 모래 등의 이물질을 제거한 후 0.1 g 수준까지 각 종별로 습중량 (wet weight in gram, g)을 측정하였고, 이 자료를 단위면적당 생물량 (g wet wt. m
2)으로 환산하여 계산하였다.
조사 해역의 해조류 군집의 생태학적 지수를 측정하기 위하 여 종조성 및 생물량 자료를 기초로 하여 풍도 지수 (richness index, R; Margalef, 1958), 다양도 지수 (diversity index, H';
Shannon, 1948)와 균등도 지수 (evenness index, E; Pielou,
1969), 우점도 지수 (dominance index; McNaughton, 1967)를 계산하였다. 우점도 지수 (dominance index)는 다음 계산식에 의해 산출되었다.
우점도 지수(DI)= (n1 + n2) / N
(n1= 제 1 우점종 생물량, n2= 제 2 우점종 생물량, N = 방형구내 총 생물량)
군집분석은 PRIMER version 6 (Clarke and Gorley, 2006)를 이용하였으며, 지역해조상의 특성을 파악하는 지표로는 R/P (Feldmann, 1937), C/P (Segawa, 1956), (R+C)/P (Cheney, 1977) 를 이용하였다.
조사지 개황
강원 연안의 조석간만의 차이는 최대 45 cm 내외로 남ㆍ서 해 연안에 비해 작으나, 조류는 최대 0.5 m/sec 이상으로 비교 적 강한 흐름을 보이고, 수온은 동해 저층냉수의 변동에 따라 계절적으로 온도차가 매우 크며, 특히 표ㆍ저층 간의 수온 차이가 크다 (NFRDI, 2008; 2009). 저질은 대부분 암반과 모래 로 이루어져 있다. 조사 해역은 외해와 연결되어 있어 해류의 흐름이 원활하며 저층은 암반 및 암초 지역이 잘 발달되어 있어 미역, 다시마, 모자반류 등이 갈조류가 풍부하게 생육하 고 있다.
결 과
종조성
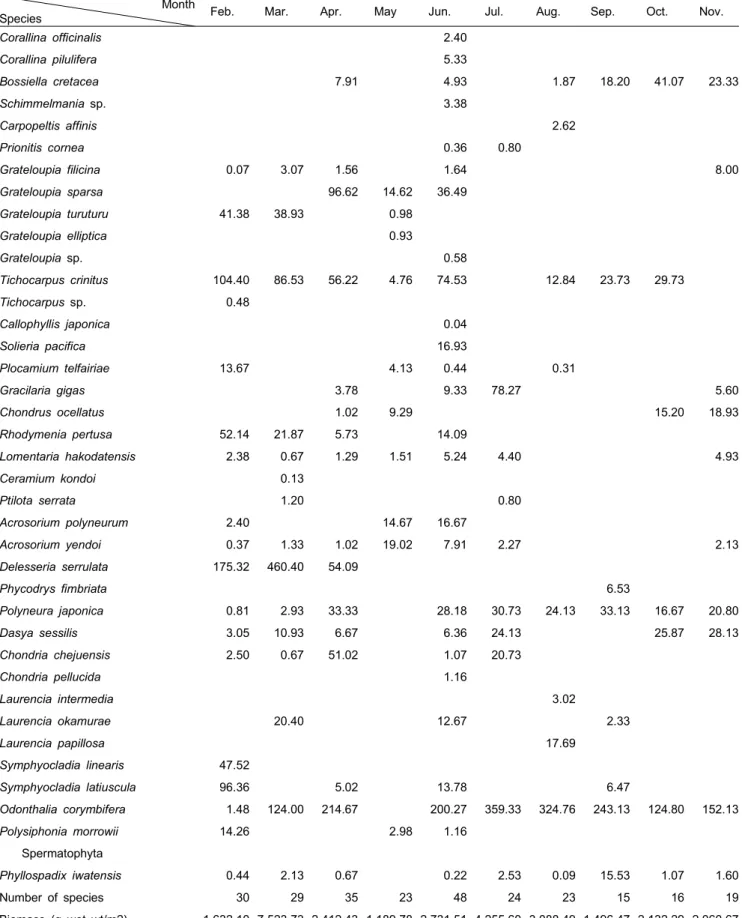
대진 해역에서 출현한 해조류는 녹조류 5종, 갈조류 25종, 홍조류 43종으로 총 73종이 출현하였으며 (Table 1), 그밖에 현화식물 1종이 출현하였다. 분류군별로는 녹조류 6.85%, 갈 조류 34.25%, 홍조류가 58.90%를 차지하여, 홍조류의 출현비 율이 가장 높았다. 월별 출현종수는 14-47종으로 6월에 최대였 고 9월에 최저였으며, 분류군별로는 녹조류가 0-4종, 갈조류 가 5-16종, 홍조류가 7-28종으로 나타나 갈조류 및 홍조류가 녹조류에 비해 많이 출현하였다. 또한 현화식물인 새우말 (Phyllospadix iwatensis)이 5월을 제외한 모든 조사기간 동안 출현하였다. 분류군별 출현종의 비율은 홍조류가 45-66%로 7 월을 제외한 모든 조사기간 동안 가장 높은 비율로 출현하였으 며, 갈조류는 31-52%, 녹조류는 0-17%의 비율로 출현하였다.
조사기간 동안 매월 출현한 종은 갈조류 큰잎알쏭이모자반 (Sargassum confusum) 1종 뿐 이었지만, 갈조류 다시마 (Laminaria japonica), 홍조류 참나무잎아재비 (Polyneura japonica)와 참빗풀 (Odonthalia corymbifera)은 5월을 제외한 모든 달에 출현하였다 (Table 1).
수심에 따른 출현종수는 수심 5 m에서 총 59종 (녹조 4종,
갈조 21종, 홍조 34종)의 해조류가 출현하여 가장 많았고, 수심
10 m에서는 47종 (녹조 2종, 갈조 22종, 홍조 23종), 그리고
수심 15 m에서는 38종 (녹조 3종, 갈조 16종, 홍조 19종)의
해조류가 출현하여 수심이 깊어질수록 출현종 수가 감소하는
것으로 나타났다 (Fig. 2).
Table 1. Marine algal list and biomass(g wet wt/m
2) at the study site in Daejon, eastern coast of Korea from February to November 2007
Month
Species Feb. Mar. Apr. May Jun. Jul. Aug. Sep. Oct. Nov.
Chlorophyta
Ulva pertusa 2.00 7.73 15.47 58.09 24.16 29.07
Ulva japonica 1.49 1.20 0.53 1.69
Bryopsis sp. 15.60 6.44
Codium arabicum 2.80
Codium fragile 18.27 0.36 1.02 44.67 45.60 45.60
Phaeophyta
Leathesia difformis 29.24
Colpomenia sinuosa 3.91 17.56 0.53
Cutleria cylindrica 226.00
Desmarestia ligulata 4.20 10.67 44.27 0.80
Desmarestia viridis 0.76
Undaria pinnatifida 186.56 843.33 629.38 444.18 592.62 869.47 324.40 335.73
Agarum clathratum 180.22 36.53 246.13 117.67 54.27 27.20 30.80 28.27
Costaria costata 417.72 1,848.40 173.40 221.82 160.27
Laminaria japonica 65.38 1,301.87 48.71 262.18 410.67 748.09 500.53 682.67 796.40
Dictyopteris divaricata 482.80 220.98 71.73 109.91
Dictyopteris undulata 121.16
Dictyota dichotoma 21.33 9.38 19.42 345.07 17.87
Dictyota linearis 0.98 0.33
Dictyota sp. 19.16 39.40
Dilophus okamurae 2.13 41.16 76.36
Spatoglossum pacificum 73.00 37.73
Pachydictyon coriaceum 57.38 25.60
Coccophora langsdorfii 84.58
Sargassum confusum 187.96 1,905.47 49.47 483.02 40.40 257.07 707.29 356.13 475.60 246.13
Sargassum pallidum 47.20 87.82 23.07
Sargassum thunbergii 3.24 1.60 12.53 0.44 135.78 616.73 194.93 256.53
Sargassum nigrifolium 21.88 118.80 55.47 27.24 1.40
Sargassum patens 237.29
Sargassum coreanum 129.11
Sargassum sagamianum 40.49 151.60 99.60 321.91 828.60 190.00
Rhodophyta
Porphyra sp. 0.80
Scinaia okamurae 2.44
Galaxaura falcata 17.02 0.49
Bonnemaisonia hamifera 12.95 42.93 288.80 40.31 2.93
Gelidium amansii 10.03 2.36 71.20 56.40 119.69 122.80 62.00 39.47
Amphiroa anceps 3.29
Table 1. continued
Month
Species Feb. Mar. Apr. May Jun. Jul. Aug. Sep. Oct. Nov.
Corallina officinalis 2.40
Corallina pilulifera 5.33
Bossiella cretacea 7.91 4.93 1.87 18.20 41.07 23.33
Schimmelmania sp. 3.38
Carpopeltis affinis 2.62
Prionitis cornea 0.36 0.80
Grateloupia filicina 0.07 3.07 1.56 1.64 8.00
Grateloupia sparsa 96.62 14.62 36.49
Grateloupia turuturu 41.38 38.93 0.98
Grateloupia elliptica 0.93
Grateloupia sp. 0.58
Tichocarpus crinitus 104.40 86.53 56.22 4.76 74.53 12.84 23.73 29.73
Tichocarpus sp. 0.48
Callophyllis japonica 0.04
Solieria pacifica 16.93
Plocamium telfairiae 13.67 4.13 0.44 0.31
Gracilaria gigas 3.78 9.33 78.27 5.60
Chondrus ocellatus 1.02 9.29 15.20 18.93
Rhodymenia pertusa 52.14 21.87 5.73 14.09
Lomentaria hakodatensis 2.38 0.67 1.29 1.51 5.24 4.40 4.93
Ceramium kondoi 0.13
Ptilota serrata 1.20 0.80
Acrosorium polyneurum 2.40 14.67 16.67
Acrosorium yendoi 0.37 1.33 1.02 19.02 7.91 2.27 2.13
Delesseria serrulata 175.32 460.40 54.09
Phycodrys fimbriata 6.53
Polyneura japonica 0.81 2.93 33.33 28.18 30.73 24.13 33.13 16.67 20.80
Dasya sessilis 3.05 10.93 6.67 6.36 24.13 25.87 28.13
Chondria chejuensis 2.50 0.67 51.02 1.07 20.73
Chondria pellucida 1.16
Laurencia intermedia 3.02
Laurencia okamurae 20.40 12.67 2.33
Laurencia papillosa 17.69
Symphyocladia linearis 47.52
Symphyocladia latiuscula 96.36 5.02 13.78 6.47
Odonthalia corymbifera 1.48 124.00 214.67 200.27 359.33 324.76 243.13 124.80 152.13
Polysiphonia morrowii 14.26 2.98 1.16
Spermatophyta
Phyllospadix iwatensis 0.44 2.13 0.67 0.22 2.53 0.09 15.53 1.07 1.60
Number of species 30 29 35 23 48 24 23 15 16 19
Biomass (g wet wt/m2) 1,632.10 7,523.73 2,412.43 1,189.78 2,731.51 4,255.60 3,088.49 1,496.47 2,132.29 2,060.67
Fig. 2. Biomass (g wet wt./m
2) and number of species of green, brown and red seaweeds at the different water depth in Daejin.
Fig. 3. Monthly variations of biomass (g wet wt./m
2) at the different water depth in Daejin from February to November 2007.
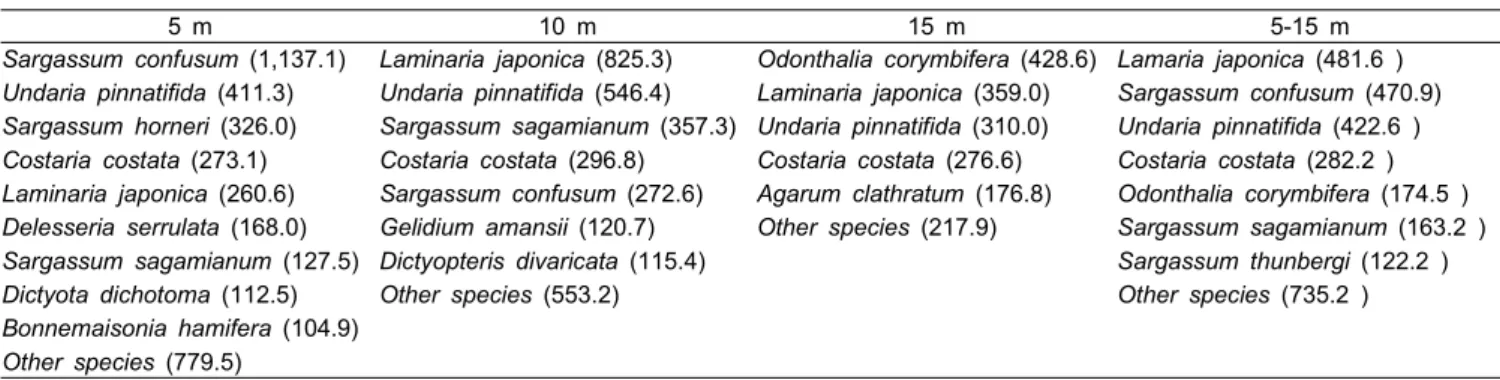
Table 2. Mean biomass (g wet wt/m2) of dominant seaweeds at the different water depth in Daejin of Korea
5 m 10 m 15 m 5-15 m
Sargassum confusum (1,137.1) Undaria pinnatifida (411.3) Sargassum horneri (326.0) Costaria costata (273.1) Laminaria japonica (260.6) Delesseria serrulata (168.0) Sargassum sagamianum (127.5) Dictyota dichotoma (112.5) Bonnemaisonia hamifera (104.9) Other species (779.5)
Laminaria japonica (825.3) Undaria pinnatifida (546.4) Sargassum sagamianum (357.3) Costaria costata (296.8) Sargassum confusum (272.6) Gelidium amansii (120.7) Dictyopteris divaricata (115.4) Other species (553.2)
Odonthalia corymbifera (428.6) Laminaria japonica (359.0) Undaria pinnatifida (310.0) Costaria costata (276.6) Agarum clathratum (176.8) Other species (217.9)
Lamaria japonica (481.6 ) Sargassum confusum (470.9) Undaria pinnatifida (422.6 ) Costaria costata (282.2 ) Odonthalia corymbifera (174.5 ) Sargassum sagamianum (163.2 ) Sargassum thunbergi (122.2 ) Other species (735.2 )
생물량 및 수직분포
대진 조하대 해역의 월별 생물량 (g wet wt. ㎡)은 1,189.8-7,523.7 g으로 3월에 최대값을, 5월에 최저값을 보였으 며, 전체 생물량은 28,523.0 g이었다. 생물량이 가장 높은 해조 류는 다시마 (L. japonica)로 평균 481.7 g으로 전체 생물량의 16.9%를 차지하는 우점종이었다. 그 다음은 큰잎알쏭이모자 반 (S. confusum)이 470.9 g (16.5%)으로 준우점종이었다. 이외 에도 미역 (Undaria pinnatifida, 422.6 g, 14.8%), 쇠미역 (Costaria costata, 282.2 g, 9.8%), 참빗풀 (O. corymbifera, 174.5 g, 6.1%), 비틀대모자반 (Sargassum sagamianum, 163.2 g, 5.7%)과 괭생이모자반 (Sargassum horneri, 122.2 g, 4.3%)이 조하대 전역에서 높은 생물량을 보였다 (Table 2).
수심별 생물량은 5 m에서 1,612.2-9,164.4 g (평균 3,700.2 g), 10 m에서 1,420.9-7,246.4 g (평균 3,087.8 g), 그리고 15 m에서 150.5 -6,160.4 g (평균 1,768.9 g)순으로 나타났다 (Fig.
3). 생물량은 모든 수심에서 3월에 최대값을 보였으나 최소값 은 5 m 수심에서는 9월에, 10 m와 15 m 수심에서는 5월에 최소값을 나타냈다. 수심 10 m에서는 특히 7월에 비틀대모자 반 (S. sagamianum), 미역 (U. pinnatifida), 다시마 (L, japonica) 등의 갈조류가 1,000 g 이상의 생물량을 보이면서 수심 5 m 보다 풍부한 것으로 확인되었다 (Fig. 3). 8월에는 수심 10
m에서 이들 갈조류들이 대부분 사라지면서 수심이 깊어짐에 따라 생물량이 감소하는 일반적인 추세를 보였다.
수심에 따른 분류군별 생물량은 (Fig. 3), 수심 5 m에서는 갈조류 3,003.1±647.1 g (Mean±SE), 홍조류 602.8±175.2 g, 녹 조류 87.8±29.2 g 순이었으며, 수심 10 m에서는 갈조류가 2,708.7±626.9 g 으로 가장 많은 생물량을 보였고, 홍조류 (375.1±74.2 g)와 녹조류 (3.4±2.5 g) 순이었다. 수심 15 m에서 도 수심 5 m와 10 m와 마찬가지로 갈조류 (1221.8±528.6 g), 홍조류 (541.7±109.9 g), 녹조류 (5.3±4.6 g) 순으로 확인되었다.
갈조류의 생물량 비율은 10 m에서 87.7%로 가장 높은 값을 보였고, 그 다음은 5 m (81.3%), 15 m (69.1%) 순으로 나타났다.
홍조류는 15 m에서 30.6%로 생물량이 가장 높았고, 그 다음은 5 m (16.3%), 10 m (12.2%) 순으로 나타났다. 녹조류는 전체 생물량의 0.1-2.4%의 비율로 전 수심에서 차지하는 비율이 가장 작은 분류군이었다.
한편, 생물량에 기초하여 우점종 (dominant species)의 수직 분포를 분석한 결과, 수심 5 m에서는 큰잎알쏭이모자반 (S.
confusum, 1,137.1 g, 30.7%), 미역 (U. pinnatifida, 411.3 g,
11.1%), 괭생이모자반 (S. horneri, 326.0 g, 8.8%), 쇠미역 (C.
costata, 237.1 g, 7.4%), 다시마 (L. japonica, 260.6 g, 7.0%)
등의 갈조류가 우점하고, 수심 10 m에서도 다시마 (L.
japonica, 825.3 g, 26.7%), 미역 (U. pinnatifida, 546.4 g, 17.7%),
비틀대모자반 (S. sagamianum, 357.3 g, 11.6%), 쇠미역 (C.
costata, 296.8 g, 9.6%), 큰잎알쏭이모자반 (S. confusum, 272.6
g, 8.8%) 등의 갈조류가 우점하였다. 반면, 수심 15 m에서는 참빗풀 (O. corymbifera, 428.6 g, 24.2%), 다시마 (L. japonica, 359.0 g, 20.3%), 미역 (U. pinnatifida, 310.0 g, 17.5%), 쇠미역 (C. costata, 276.6 g, 15.6%), 야키시리구멍쇠미역 (Agarum
clathratum, 176.8 g, 10.0%) 등의 갈조류와 한해성 홍조류가주요 우점종으로 출현하였다 (Table 2).
군집지수
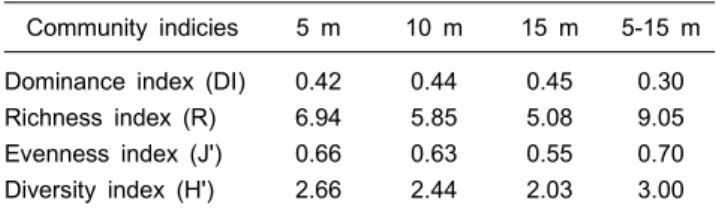
해조류의 출현종수와 생물량을 바탕으로 산출한 다양한 군집지수를 살펴보면 Table 3과 같다. 전체 생물량에 대한 우점종과 준우점종의 합의 비인 우점도 지수 (DI)는 0.42-0.45 의 범위로 우점종과 준우점종의 생물량이 45%를 차지한 수심 15 m에서 최대이고 수심이 낮아질수록 우점도지수도 낮아지 는 것이 확인되었다. 출현종수와 관련된 풍도 지수 (R)는 5.08-6.94로 59종의 해조류가 출현한 수심 5 m가 최대, 38종의 수심 15 m에서 최소였다 (Table 3). 균등도 지수 (J')는 0.55-0.66 으로 우점도 지수와 반대로 수심이 깊어질수록 낮아지는 것으 로 나타났으며, 풍도와 균등도 지수를 근거로 산출된 다양도 지수 (H')는 수심 5 m에서 2.66으로 가장 높았으며, 수심 15 m에서 2.03으로 가장 낮았다 (Table 3).
한편, 해조상의 지역별 특징을 나타내는 C/P값은 0.20을, R/P값은 1.72를, (R+C)/P값은 1.90을 나타내었다 (Table 4).
Table 3. Various community indices for mean biomass (g wet wt/m2) at the different water depth in Daejin of Korea
Community indicies 5 m 10 m 15 m 5-15 m Dominance index (DI)
Richness index (R) Evenness index (J') Diversity index (H')
0.42 6.94 0.66 2.66
0.44 5.85 0.63 2.44
0.45 5.08 0.55 2.03
0.30 9.05 0.70 3.00
Table 4. Comparisons of flora characteristics ratio among the previous studies at the eastern coast of Korea
Sites Flora characteristics
References C/P R/P (R+C)/P
Daejin 0.39 2.30 2.68 Shin et al.(2008a) Uljin 0.38 1.62 2.00 Choi et al.(2006) Ilkwang bay 0.59 4.47 5.06 Kang et al.(2008) Yongil bay 0.90 5.05 5.95 Nam et al.(1996) Daejin 0.20 1.72 1.90 This study
고 찰
우리나라 최북단에 위치한 강원도 고성군 대진 해역은 자연 군락이 잘 발달된 지역으로 알려져 있다. 본 연구에서는 녹조 5종, 갈조 25종, 홍조 43종 등 총 72종의 해조류가 출현하였으
며, 현화식물인 새우말 (Phyllospadix iwatensis)이 출현하였다.
이러한 출현종수는 Shin et al. (2008b)이 대진 해역의 4계절 조사를 통해 보고한 94종 (녹조 11, 갈조 26, 홍조 57종), Boo and Lee (1986)가 속초 연안에서 보고한 96종 (녹조 14종, 갈조 28종, 홍조 54종), Chung et al. (1991)이 갈남 해역에서 보고한 91종 (녹조 8, 갈조 21, 홍조 61종), Choi et al. (2006)이 울진에 서 보고한 87종 (녹조 11종, 갈조 29종, 홍조 47종) 보다 출현 종수가 적은 것으로 나타났으나, 주요 출현종의 조성에서는 큰 차이를 보이지 않았다. 이러한 종수의 차이는 조사 지역, 수심 및 시기, 그리고 미세 사상형 해조류의 기재 유무에 기인 한 것으로 판단되었다.
출현종의 분류군별 출현 비율을 살펴보면, 본 연구에서는 녹조 6.9%, 갈조 34.3%, 홍조 58.9%로 출현 비율은 홍조류가 가장 높고, 녹조류가 가장 낮았다. 반면 Kim and Kim (1991)은 울진 연안에서 녹조 12.4%, 갈조 25.6%, 홍조 53.6%를 보고하 였으며, Lee and Kim (1999)은 동해 장호 연안에서 녹조 11.7%, 갈조 25.2%, 홍조 63.1%를 보고하였고, Choi et al. (2006)은 울진 해역에서 녹조 12.6%, 갈조 33.3%, 홍조 54.0%를 보고하 여, 이를 이용하여 평가한 결과 대진의 녹조류 출현비율은 기존 조사의 11.7-12.6%에서 6.9%로 떨어진 것으로 나타났다.
이러한 녹조류의 출현 비율 감소는 조간대와 수심 1 m 이내에 생육하는 홑파래, 잎파래, 가시파래 및 대마디말류 등이 채집 되지 않았기 때문으로 해석되었다. 동해 중남부 연안에서 녹 조류의 출현비율이 10.0% 이하로 출현한 예는 Kim and Ahn (2005)이 울진 원자력발전소에서 9년간의 연구에서 녹조류가 1% 이내로 출현한다고 보고하였으며, 이외에 Boo (1987)와 Chung et al. (1991)이 각각 9.9% 및 8.6%로 보고한 바가 있다.
지역 해조상의 분포론적 특성에 대한 논의는 Segawa (1956)
가 갈조류에 대한 녹조류의 비 (C/P)로서 한대지역(0.4)과 아
열대지역 (1.5)으로 구분하면서 학술적 관심의 대상이 되었고,
Feldmann (1937)은 갈조류에 대한 홍조류의 비(R/P)를 이용하
여 한ㆍ온대 지역 (1.1)과 열대지역 (4.3)을, Cheney (1977)는
갈조류에 대한 홍조류와 녹조류의 합의 비인 (R+C)/P를 이용
하여 그 값이 3보다 작을 때는 온대 내지 한대성 해조상을,
6 이상이면 열대성 해조상을 그리고 그 중간 값이면 혼합성
해조상으로 구분하였다. 본 연구결과 대진 해역의 C/P값은
0.20을, R/P값은 1.72를, (R+C)/P값은 1.92를 나타내 한해성
해조상의 특성을 나타냈다. 이를 선행 연구의 결과와 비교해
보면, 동해안 중부의 대진과 울진 지역의 C/P값은 0.38-0.39를,
R/P값은 1.62-2.30을, (R+C)/P값은 2.00-2.68를 보여 본 연구보
다 다소 높은 값을 나타냈으나 마찬가지로 한해성 해조상의
특징을 나타내는 것으로 확인되었다. 본 연구에서 각 값이
선행연구보다 낮게 나타난 이유는 조간대에 대한 조사가 이루
어지지 않은 결과로 판단된다. 이러한 결과는 동해 남부인
영일만과 일광만의 결과와 뚜렷한 차이를 보이는 것으로써
(Table 4), Kang (1966)은 이러한 해조류 분포의 특징을 바탕으
로 동해를 중남부와 북부의 두 개 지역으로 구분하였는데, 본
연구에서는 동해중부인 대진 해역에서 C/P 0.20, R/P 1.72,
(R+C)/P 1.90을 나타내 남부지역인 영일만 (C/P, 0.90; R/P, 5.05;
(R+C)/P, 5.95) 및 일광만 (C/P, 0.59 R/P, 4.47; (R+C)/P, 5.06)과 뚜렷한 차이를 보이는 것으로 확인되어 동해안 중부와 남부는 해조상에 의한 지역이 구분되어야 할 것으로 판단된다.
대진 해역의 평균 생물량 (g wet wt. m
2)은 2,852.3 g으로 강릉 안인 조하대의 700-2,000 g에 비해 높았으며, 연곡 연안 조하대의 446-1,089 g에 비해서도 매우 높은 생물량을 보여 본 연구지역인 대진 해역은 매우 풍부한 해조류 자원량을 갖는 것으로 판단되었다 (Kim et al., 1983; Kim et al., 2000).
또한 생물량에 따른 우점종과 준우점종은 다시마 (Lamaria
japonica)와 큰잎알쏭이모자반 (Sargassum confusum)으로 나타나, 대진 해역의 4계절 조사에서 조하대 5-10 m지역에서 모자반류가 주요종이라 보고한 Shin et al. (2008a)의 연구결과 와도 잘 일치하였다. 본 연구에서도 수심 5 m에서는 큰잎알쏭 이모자반 (S. confusum)과 미역 (Undaria pinnatifida)이, 수심 10 m에서는 다시마 (L. japonica)와 미역 (U. pinnatifida)이, 수심 15 m에서는 참빗풀 (Odonthalia corymbifera)과 다시마 (L. japonica)가 각각 우점종과 준우점종으로 확인되어 이들 갈조류가 생물량의 대부분을 차지하였다.
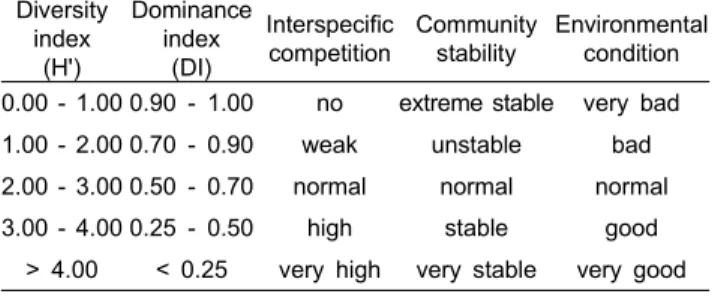
Table 5. Evaluation of community stability and environmental condition according to various community indices obtained by seaweed biomass
Diversity index
(H')
Dominance index
(DI)
Interspecific competition
Community stability
Environmental condition 0.00 - 1.00 0.90 - 1.00 no extreme stable very bad 1.00 - 2.00 0.70 - 0.90 weak unstable bad 2.00 - 3.00 0.50 - 0.70 normal normal normal 3.00 - 4.00 0.25 - 0.50 high stable good
> 4.00 < 0.25 very high very stable very good
식물상의 종간경쟁, 군집 안정도 및 환경상태는 우점도와 다양도지수로 판단할 수 있으며, 해조류 군집에서도 적용이 가능하다 (Ludwig and Reynolds, 1988; Park et al., 2006; Yoo et al., 2007). 우점도 지수와 다양도 지수는 반비례적인 관계를 보이며, 종간경쟁, 군집안정도 및 환경상태는 Table 5와 같다.
이에 따라 대진해역의 환경상태를 평가해 보면, 대진의 조하 대는 우점도 지수 (0.30)에서 종간경쟁이 높고 (high), 군집은 안정 (stable)되어 있으며, 환경상태는 양호 (good)한 것으로 평가되었으며, 다양도 지수 (3.00)에서는 세 항목 모두 보통 (normal)이었다. 군집 지수는 수심에 따라 차이는 존재하였으 나 환경평가에 있어 변화는 나타나지 않았다. Yoo et al. (2007) 에 따르면 단 두 종의 자료 (피도, 생물량)를 활용한 우점도 지수 보다 모든 출현종수 및 풍도자료로 산출된 다양도 지수 가 군집특성을 더욱 잘 반영한다고 하였다. 따라서 본 연구 해역의 환경상태는 보통 (normal)으로 판단된다.
참고문헌