Ⅰ. 서 론
68Ga 방사성 핵종은 사이클로트론에서 생산되는 18F, 11C,
13N, 15O등과 같은 PET에서 이용하는 양전자 방출핵종과는 달리 68Ge/68Ga 발생기에서 생산되는 양전자 방출핵종으로 낮은 비용으로 생산할 수 있는 장점이 있다[1,2]. 68Ge의 반 감기는 270.8일로 평균 1∼2년 사용할 수 있으며, 68Ga은 67.6분의 적당한 반감기를 가지고 있어 PET 진단용 방사성 의약품으로 한계를 보이고 있는 기존 비금속성 핵종들의 대 안으로 주목받고 있다. 하지만 아직 방사성 의약품이 많이 개발되어 있지는 않다[2.3]. 최근 핵의학 분야에서는 금속
성 핵종인 68Ga 방사성 핵종에 신경내분비종에 특이적으로 결합하는 소마토스틴 계열 펩타이드를 결합하여 신경내분 비 종양진단과 전립선 특이 막 항체(Prostate Specific Membrane Antigen; PSMA)를 결합하여 전립선암 진단에 이용하고 있으며, 68Ga 방사성 핵종에 결합한 표지화합물을 베타선을 방출하는 핵종에 결합하여 종양을 치료하는 연구 가 활발히 진행되고 있다[2,4].
68Ga 방사성 핵종의 물리적 특성은 붕괴과정에서 88.9%
의 β+붕괴와 11.1%의 전자포획으로 붕괴되며, β+붕괴과정 에서 최대 1899 keV의 양전자를 방출한다.
PET검사에서 주로 이용하고 있는 18F 방사성 핵종의 물
<원저>
PET/CT에서 Phantom을 이용한 Fluorine-18, Gallium-68 방사성 핵종의 PET 영상 평가
윤석환
서울대학교병원 핵의학과
Evaluation of PET Image for Fluorine-18 and Gallium-68 using Phantom in PET/CT
Yoon Seok-Hwan
Department of Nuclear Medicine, Seoul National University Hospital
Abstract The purpose of this study is to compare PET imaging performance with Fluorine-18 (18F) and Gallium-68 (68Ga) for influence of physical properties of PET tracer. Measurement were performed on a Siemens Biograph mCT64 PET/CT scanner using NEMA IEC body phantom and Flangeless Esser PET phantom containing filled with 18F and 68Ga. Emission scan duration(ESD) was set to 1, 2, 3, 4 and 5min/bed for 68Ga and 1min/bed for 18F. The PET image were evaluated in terms of contrast, spatial resolution. Under same condition, The percentage of contrast recovery measured in the phantom ranged from 16.88% to 72.56% for 68Ga and from 27.51% to 74.43% for 18F and The FWHM value to evaluate spatial res- olution was 10.96 ㎜ for 68Ga and 9.19 ㎜ for 18F. For this study, 18F produces better image contrast and spatial reso- lution than 68Ga due to higher positron yield and lower positron energy (18F: 96.86%, 633.5 keV, 68Ga: 88.9%, 1899 keV), The physical properties of PET tracer effect on the PET image. 68Ga image applying ESD of 3, 4, 5min/bed were showed similar to 18F image with ESD of 1min/bed. This study suggests that increasing ESD for acquiring 68Ga PET image seem to be similar to 18F image.
Key Words : 18F, 68Ga, PET, Contrast Recovery, FWHM
중심 단어 : 18F, 68Ga, 양전자방출단층촬영, 대조도회복계수, 반치폭
Corresponding author: Seok-Hwan Yoon, Department of Nuclear Medicine, Seoul National University Hospital, 101, Daehak-ro Jongno-gu, Seoul 03080, Korea / Tel: +82-10-9695-7399 / E-mail: [email protected]
Received 23 July 2018; Revised 09 August 2018; Accepted 19 August 2018 Copyright ⓒ2018 by The Korean Journal of Radiological Science and Technology
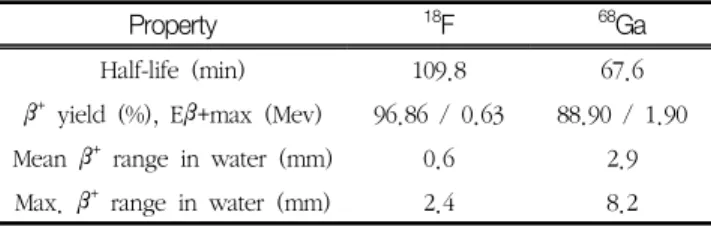
리적 특성은 96.86%의 β+붕괴와 최대 633.5 keV의 양전자 를 방출한다(Table 1).
본 연구의 목적은 물리적 특성이 다른 두 동위원소의 phantom 실험을 통한 PET영상을 비교 평가하여 PET검사 시 68Ga 방사성 핵종의 적정한 영상 획득시간을 알아보고자 하였다.
Ⅱ. 대상 및 방법
1. Phantom
NEMA(National Electrical Manufactures Association) IEC(International Electechnical Commission) body phantom 에 FDG PET and PET/CT: EANM guidelines의 phantom 을 이용한 영상 평가 방법을 기준으로 10 ㎜, 13 ㎜, 17 ㎜, 22 ㎜, 28 ㎜, 37 ㎜ 6개의 sphere와 background에 방사능 의 비율이 10:1이 되도록 18F, 68Ga 방사성 동위원소를 희석 하여 phantom의 sphere와 background에 각각 20 kBq/ml, 2 kBq/ml 방사능 농도가 되도록 주입하였다[5], (Fig. 1).
Flangeless Esser PET phantom에는 18F, 68Ga 방사성 동위 원소를 방사능 농도가 50 kBq/ml이 되도록 각각 phantom에 주입하였다(Fig. 2).
2. 영상획득
SIEMENS Biograph mCT64 PET/CT (Siemens medical
system, Germany) 기기를 이용하였으며, IEC body phantom과 Flangeless Esser PET phantom의 PET영상 획 득을 위해 18F-FDG 검사에 이용되는 본원의 임상 프로토콜 을 적용하여 phantom을 FOV(Field of view) 중앙에 위치시 킨 후 18F 동위원소가 채워진 팬텀에서는 axial FOV(Field of view; 216 ㎜) 1분 영상을 획득하였으며, 68Ga 동위원소가 채워진 phantom에서도 동일한 조건으로 1분, 2분, 3분, 4분, 5분 영상을 획득하였다. CT영상은 관전압 120 kVp, 관전류 50 mA, 0.5 s/rotation, Pitch factor 0.8을 이용하여 CT영 상을 획득하였다.
3. 영상재구성
Phantom의 PET영상은 Matrix size 200×200, Voxel size 4.07×4.07×3.00, Slice thickness 3 ㎜로 OSEM3D+
T OF+PSF (iteration, 2; subset, 21), Gaussian filter FWHM(Full width half maximum) 5 ㎜를 적용하여 PET 영상을 동일하게 재구성 하였으며, CT영상을 이용하여 PET 영상 재구성 시 감쇠보정과 산란보정을 하였다.
4. 영상 평가
PET 영상의 분석 방법은 Syngo.via (Siemens medical system, Germany) 프로그램과 Freeware Amide 프로그램 을 이용하였다. 두 방사성 핵종 phantom의 PET영상과 CT영 상을 융합한 후 CT영상에서 phantom의 sphere와 cylinder 및 background 영역에 ROI(Region of interest)를 설정하여 PET영상의 pixel 당 counts 값을 측정하였으며, sphere에 VOI(Volume of interest)를 설정하여 최대 방사능 농도 값을 측정하였다(Fig. 3).
NEMA standard NU 2-2012 기준에 따라 IEC body phantom영상에서 Contrast recovery (Hot) (Eqs. 1), Background variability (Eqs. 3), SNR(Signal to noise ratio) (Eqs. 4), CNR(Contrast to noise ratio) (Eqs. 5)을 측정하여 영상의 대조도를 평가하였으며, Amide 프로그램 에서 IEC body phantom의 크기가 가장 작은 10 ㎜ sphere 에 profile line을 수직, 수평하게 그린 후 Gaussian fitting하여 FWHM, FWTM(Full width tenth maximum) 을 측정하여 해상력을 평가하였다[6-10].
그리고 6개의 sphere에 실제 투여한 방사능의 농도(20 kBq/ml)와 VOI를 설정하여 측정된 최대 방사능 농도를 비 교하여 Recovery coefficient (Eqs. 6) 값을 산출한 후 두 동위원소의 부분용적 효과에 대하여 비교 평가 하였다[11].
Flangeless Esser PET phantom 영상에서는 3개의 물질
Property 18F 68Ga
Half-life (min) 109.8 67.6
β+ yield (%), Eβ+max (Mev) 96.86 / 0.6388.90 / 1.90 Mean β+ range in water (mm) 0.6 2.9 Max. β+ range in water (mm) 2.4 8.2 Table 1 Physical properties of 18F and 68Ga
Fig. 1 NEMA IEC Body phantom
Fig. 2 Flangeless Esser PET phantom
로 구성된 Bone, Water, Air 물질로 이루어진 cylinder에 서 Contrast recovery (Cold) (Eqs. 2)를 측정하였으며, phantom의 rod 영역의 PET 영상을 5명의 방사선사를 대상 으로 Blind test를 시행하여 육안으로 공간해상력을 평가하 였다.
The percentage contrast recovery (Ideal case = 100%) Hot sphere j :
(Eqs. 1)
CH,j = average counts in the ROI for sphere j CB,j = average counts in the background ROI for
sphere j
aH = activity concentration in the hot spheres aB = activity concentration in the background
Cold cylinder j :
(Eqs. 2)
Cc,j = average counts in the ROI for cold cylinder j CB,j = average of all background ROI counts for cold
cylinder j
Percentage background variability Nj
(Eqs. 3)
SDj = standard deviation of the background ROI counts for sphere j
CB,j = average of all background ROI counts for sphere j
Signal to noise ratio (SNR)
(Eqs. 4)
Signalj = average counts in the ROI for sphere j SDj = standard deviation of the ROI counts for
sphere j
Contrast to noise ratio (CNR)
(Eqs. 5)
Lesionlj = average counts in the ROI for sphere j Background = average counts in a ROI placed in a
uniform area outside the spheres SDLj = standard deviation of the ROI counts for
sphere j
SDB = standard deviation of the background ROI counts, corresponding to noise in the image
Recovery coefficient (RC)
(Eqs. 6)
Measured ACj = Measured activity concentration of the VOI for sphere j
Actual ACj = Actual activity concentration for sphere j
Ⅲ. 결 과
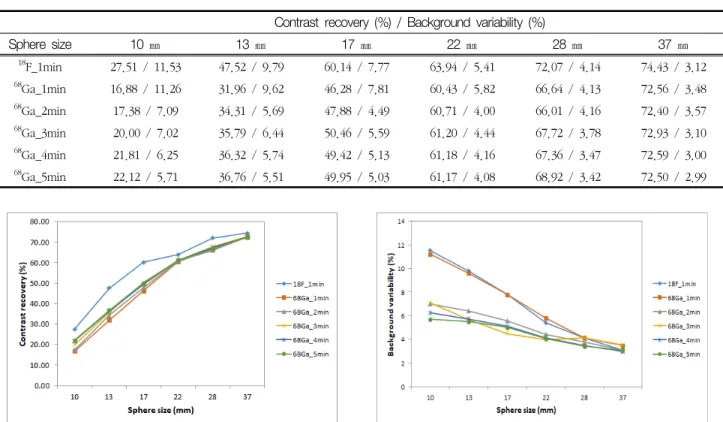
1. Contrast recovery, background variability 평가 IEC body phantom을 이용한 Contrast recovery (Hot) 평가결과 1분 획득한 18F phantom영상에서 6개 sphere의 Contrast recovery 값은 68Ga의 1분, 2분, 3분, 4분, 5분 획득한 phantom 영상 보다 높은 Contrast recovery 값을 보였다(Table 2), (Fig. 4).
실제 sphere와 background 방사능 비율과 재구성한 영상 에서 측정한 계수의 비율을 대조도로 나타냄으로서 18F PET 영상이 68Ga PET 영상보다 대조도가 높게 평가 되었다.
Flangeless Esser PET phantom의 Bone, Water, Air 물 질로 채워진 cylinder의 Contrast recovery (Cold) 결과는
18F 영상에서 각각 81.21%, 77.46%, 75.02% 68Ga phantom 영상에서 81.33%, 74.73%, 71.13%의 값을 보였다.
Bone 물질에 대해서는 두 방사성핵종의 Contrast recovery 값은 비슷한 결과를 보였으나 Water, Air 물질로 채워진 cylinder에서는 68Ga 영상이 18F 영상보다 낮은 대조도 값을 Fig. 3 Region of interest(ROI) placed over the sphere
and background in NEMA IEC Body phantom
보여 Bone 물질보다는 Water, Air 물질에서 대조도의 차이 가 크게 나타났다
Background variability 평가 결과는 IEC body phantom 6개의 sphere에서 18F phantom 1분 영상은 3.12 에서 11.53
68Ga phantom 1분 영상에서는 3.48 에서 11.20 값을 나타내어 두 방사성핵종의 1분 영상에서는 비슷한 Background variability 값을 보였다
하지만 68Ga 영상에서 영상획득시간이 증가 할수록 배경 잡음이 균일해져 Background variability 값은 감소하였다 (Table 2), (Fig. 5).
2. SNR, CNR 평가
IEC body phantom을 이용한 SNR 값은 10 ㎜, 13 ㎜, 17
㎜ sphere에서 18F 1분 영상은 각각 2.57, 2.35, 2.28 68Ga 1분 영상은 각각 2.84, 2.63, 2.66 으로 68Ga 1분 영상이 18F 1분 영상보다 높게 측정되었으며, 22 ㎜, 28 ㎜, 37 ㎜ sphere에서는 68Ga 1분 영상은 각각 2.54, 2.81, 3.31 18F 1분 영상은 각각 2.82, 2.96, 3.31 으로 낮게 측정 되었다.
68Ga의 영상 획득 시간이 증가 할수록 17 mm이하의 sphere 에서 SNR은 감소하였으며, 22 ㎜ 이상의 sphere에서 SNR 은 증가하였다(Table 3).
CNR 평가 결과, 68Ga 1~5분 영상의 13 ㎜이하의 sphere 에서 18F 1분영상보다 낮은 CNR을 보였으며, 22 ㎜ 이상의 sphere에서 68Ga의 영상획득 시간이 증가할수록 CNR은 18F 1분 영상과 차이가 감소하였다(Table 3).
PET 영상의 부분용적 효과로 인하여 sphere 크기에 따라 신호와 대조도 잡음의 차이가 나타났지만 68Ga의 영상 획득 시간이 증가할수록 영상의 신호는 증가하고, 잡음은 감소하 여 SNR과 CNR은 향상된 결과를 보였다.
3. Resolution 평가
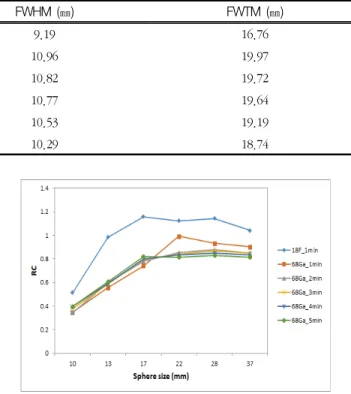
IEC body phantom 10 ㎜ sphere의 18F, 68Ga의 1분 영 상에서 FWHM / FWTM 값은 각각 9.19 ㎜ / 16.76 ㎜, 10.96 ㎜ / 19.97 ㎜ 값을 보였으며, 18F 1분 영상에서 FWHM, FWTM 값은 68Ga 1~5분 영상보다 낮게 측정되어 영상획득 시간에 관계없이 18F의 1분 영상의 해상력이 우수 하였다(Table 4).
Flangeless Esser PET phantom의 Cold rod의 영상 평 가에서 Blind test를 통해 5명의 방사선사 모두 68Ga의 3분 이상의 영상이 18F 1분 영상과 육안으로 비슷한 영상이라고 답하였다(Fig. 6).
Contrast recovery (%) / Background variability (%)
Sphere size 10 ㎜ 13 ㎜ 17 ㎜ 22 ㎜ 28 ㎜ 37 ㎜
18F_1min 27.51 / 11.53 47.52 / 9.79 60.14 / 7.77 63.94 / 5.41 72.07 / 4.14 74.43 / 3.12
68Ga_1min 16.88 / 11.26 31.96 / 9.62 46.28 / 7.81 60.43 / 5.82 66.64 / 4.13 72.56 / 3.48
68Ga_2min 17.38 / 7.09 34.31 / 5.69 47.88 / 4.49 60.71 / 4.00 66.01 / 4.16 72.40 / 3.57
68Ga_3min 20.00 / 7.02 35.79 / 6.44 50.46 / 5.59 61.20 / 4.44 67.72 / 3.78 72.93 / 3.10
68Ga_4min 21.81 / 6.25 36.32 / 5.74 49.42 / 5.13 61.18 / 4.16 67.36 / 3.47 72.59 / 3.00
68Ga_5min 22.12 / 5.71 36.76 / 5.51 49.95 / 5.03 61.17 / 4.08 68.92 / 3.42 72.50 / 2.99 Table 2 Contrast recovery and Background variability values in % for each sphere of IEC Body Phantom
Fig. 4 Contrast recovery (%) of hot sphere Fig. 5 Background variability (%)
4. Recovery coefficient 평가
IEC body phantom에서 6개 sphere의 Recovery coefficient 값은 18F 1분 영상에서 0.51 에서 1.04 값을 보였으며, 68Ga
1분 영상에서는 0.34 에서 0.90 범위의 값을 나타내었다.
68Ga 2∼5분 영상의 6개 sphere에서는 0.34 에서 0.85 범 위의 일정한 Recovery coefficient 값이 측정되었다. 부분 용적 효과를 평가하기 위한 Recovery coefficient 결과
68Ga의 1~5분 영상에서 Recovery coefficient 값은 18F 1분 영상 보다 모두 낮게 측정되었다(Fig. 7).
부분용적 효과는 PET의 분해능에 비해 작은 구조물에서 발생하며, 영상의 감도와 해상력에 영향을 받게 된다. 실험
결과 18F 영상에 비해 68Ga 영상에서 부분용적 효과의 영향 이 크게 나타났다
Ⅳ. 고 찰
본 연구의 목적은 물리적 특성이 다른 18F, 68Ga 두 방사 성핵종에 대하여 phantom 실험을 통한 PET 영상의 Contrast recovery, Background variability, SNR, CNR, 방사능 농도의 Recovery coefficient, FWHM, FWTM을 비 교 평가하여 68Ga 방사성 핵종을 이용한 PET 검사 시 적정 Table 3 SNR / CNR values for each sphere of IEC body phantom
SNR / CNR
Sphere size 10 ㎜ 13 ㎜ 17 ㎜ 22 ㎜ 28 ㎜ 37 ㎜
18F_1min 2.57 / 1.83 2.35 / 1.73 2.28 / 1.80 2.82 / 2.21 2.96 / 2.38 3.31 / 2.64
68Ga_1min 2.84 / 1.71 2.63 / 1.60 2.66 / 1.89 2.54 / 1.98 2.81 / 2.22 3.31 / 2.62
68Ga_2min 2.87 / 1.74 2.48 / 1.60 2.51 / 1.84 2.79 / 2.19 2.90 / 2.29 3.38 / 2.67
68Ga_3min 2.59 / 1.67 2.57 / 1.67 2.50 / 1.86 2.83 / 2.17 2.96 / 2.35 3.38 / 2.68
68Ga_4min 2.54 / 1.68 2.58 / 1.69 2.44 / 1.81 2.82 / 2.19 3.01 / 2.38 3.38 / 2.67
68Ga_5min 2.53 / 1.68 2.56 / 1.69 2.43 / 1.82 2.87 / 2.22 3.05 / 2.40 3.40 / 2.69
Radioisotope FWHM (㎜) FWTM (㎜)
18F_1min 9.19 16.76
68Ga_1min 10.96 19.97
68Ga_2min 10.82 19.72
68Ga_3min 10.77 19.64
68Ga_4min 10.5319.19
68Ga_5min 10.29 18.74
Table 4 FWHM and FWTM values of 18F and 68Ga
Fig. 6 Image quality in difference emission scan time of Flangeless Esser PET phantom with 18F and 68Ga
Fig. 7 RCmax distribution with spheres of different sizes in 18F and 68Ga IEC body phantom image
한 영상 획득시간을 알아보고자 하였다.
PET에서 가장 많이 이용하고 있는 18F 방사성핵종과 양 전자를 방출하는 다양한 핵종들의 PET 영상 평가에 대한 선 행 연구의 결과들이 많이 보고되고 있다[12-14].
이 연구의 실험 결과에서도 동일한 영상획득 조건에서
18F 방사성핵종의 PET 영상이 68Ga 방사성 핵종의 PET 영 상보다 대조도와 해상력을 평가하는 항목에서 우수하였다.
즉 두 동위원소의 물리적 특성의 차이가 PET 영상에서 대조도와 해상력 차이의 요인이 되었다. 방출되는 양전자 수율은 PET 영상의 감도에 영향을 끼치며, 방출되는 양전 자 에너지에 의한 비정의 길이는 양전자가 방출되는 위치와 전자와 만나 소멸복사선이 발생되는 위치에 차이가 생겨 PET 영상의 해상력에 영향을 미치게 되고 영상의 해상력은 대조도에도 영향을 미치는 사실을 알 수 있었다[7,15]. 또한 두 방사성핵종의 영상을 비교 평가한 결과를 바탕으로 18F 영상과 정량적, 정성적으로 유사한 영상을 구현하기 위한
68Ga 영상의 적정한 영상 획득시간 알 수 있었다
PET영상의 해상력의 한계로 인하여 발생되는 부분용적 효과도 68Ga에서 18F보다 효과가 크게 나타나 PET의 반정량 지표인 표준섭취계수에도 영향을 미칠 수가 있다[16-18].
임상에서 68Ga 방사성 핵종과 18F 방사성핵종을 이용하여 PET검사에 사용하는 추적자는 섭취기전이 상이하여 임상영 상의 표준섭취계수를 직접적으로 비교할 수는 없었지만 신 경내분비종양, 전립선암, 염증의 진단에 사용되는 다양한 추적자를 이용한 68Ga의 PET영상과 18F-FDG PET영상의 표준섭취계수와 진단의 상관관계를 비교하는 연구는 활발 히 여러 논문을 통하여 보고되고 있으며, 비정이 긴 양전자 방출핵종에 대해서 영상의 재구성 시 보정 기법에 관한 연 구도 계속 진행되고 있다[19-22].
이번 연구를 통하여 68Ga 방사성 핵종을 이용한 PET영상 획득 시 적정한 시간을 평가함으로서 임상영상과 연구에 기 초적인 자료로 제공되어 질수 있다고 생각된다. 그리고
68Ga PET영상의 질을 향상시키기 위하여 영상획득 시간뿐 만 아니라 68Ga 방사성 핵종은 붕괴과정에서 3.4%의 고 에 너지 단일 감마선을 방출하게 되는데 물질과 상호작용하여 산란선이 발생되어 PET 검출기에 검출될 수 있으며, 상호 작용하는 물질 성분에 따라 비정의 차이를 보여 영상 재구 성 시 산란선 보정 에도 영향을 줄 수 있으므로 다양한 인자 에 관한 추가연구도 필요할 것으로 사료된다.
Ⅴ. 결 론
18F 방사성 핵종과 68Ga 방사성 핵종에 대하여 phantom 을 이용한 PET영상을 비교 평가 한 결과 18F PET영상이
68Ga PET영상보다 대조도와 해상력이 우수하였다.
68Ga 방사성 핵종은 18F 방사성 핵종과 비교하여 양전자 방출 수율이 낮고, 방출되는 양전자의 에너지가 높아 물질 속에서 비정이 길다. 즉 물리적인 특성의 차이가 PET 영상 의 대조도와 해상력에 영향을 미치는 사실을 알 수 있었다.
이러한 68Ga 방사성 핵종의 물리적인 특성을 고려하여 이 연구 결과에서 68Ga 방사성핵종의 3분 이상 획득한 영상은
18F 방사성 핵종의 1분 획득한 PET 영상과 정량적, 정성적 으로 비슷한 영상을 구현할 수 있었다.
REFERENCES
[1] Kim IY, Lee YK, Ahn SM. Effect of Glucose Level on Brain FDG-PET Images. Journal of Radiological Science and Technology. 2017;40(2):275-80.
[2] Jeong JM, Kim YJ, Lee YS, Lee DS, Chung JK, Lee MC. Radiolabeling of NOTA and DOTA with Positron Emitting 68Ga and Investigation of in vitro properties.
Nuclear Medicine and Molecular Imaging. 2009;43(4):
330-6.
[3] Fitzpatrick C, Lynch O, Marignol L. 68Ga-PSMA- PET/CT Has a Role in Detecting Prostate Cancer Lesions in Patients with Recurrent Disease.
Anticancer Research. 2017;37(6):2753-60.
[4] Harshad R K, Richard P B, Molecular imaging using PET/CT applying 68Ga-Labeled tracers and targeted radionuclide therapy: Theranostics on the way to personalized medicine. Journal of Postgraduate Medicine, Education and Research. 2013;47(1):
47-53.
[5] Ronald B, Mike J, Wolfgang A, Felix M, Markus N, Sigrid G, et al. FDG PET and PET/CT: EANM proce- dure guidelines for tumour PET imaging: version 1.0.
European Journal Nuclear Medicine and Molecular Imaging. 2010;37(1):181-200.
[6] Conti M, Eriksson L. Physics of pure and non-pure positron emitters for PET: a review and discussion.
European Journal of Nuclear Medicine and Molecular
Imaging Physics. 2016;3(1):1-17.
[7] National Electrical Manufacturers Association.
Performance Measurements of Positron Emission Tomographs. NEMA Standards Publication NU 2-2012. Rosslyn; 2012.
[8] Oliveira JF. Influence of the time of flight and ac- quisition time on image quality in positron emission tomography/computed tomography scanners. [master’s thesis]. Portugal: Polytechnic Institute of Lisbon;
2016.
[9] Lee JY, Lee EK, Kim KW, Jeong HW, Lyu KY, Park HH, et al. Evaluation and Comparison of Contrast to Noise Ratio and Signal to Noise Ratio According to Change of Reconstruction on Breast PET/CT.
Journal of Radiological Science and T echnology.
2017;40(1):79-85
[10] Zhu Y, Geng C, Huang J, Liu, J, Wu N, Xin J, et al. Measurement and Evaluation of Quantitative Performance of PET/ CT Images before a Multicenter Clinical Trial. [Internet]. 2018 [cited 2018 Jun 13];
8:9035. Available from: https://www.nature.com/
articles/s41598-018-27143-4. Scientific Reports volume 8, Article number: 9035 (2018)
[11] Ko HS, Park SK, Kim JS, Jung WY, Dong KR, Chung WK. A study on comparative analysis of SUVs before and after correction with use of recovery coefficient (RC) in partial volume effect (PVE). The Imaging Science Journal. 2014;62(1):11-5.
[12] Isabel M, Prata M, Gallium-68: A New Trend in PET Radiopharmacy. Current Radiopharmaceuticals.
2012 Apr;5(2):142-9.
[13] Canadas, M. Romero sanz. E, Octeo vives, M, Vaqureo, JJ, et al. Performance evaluation for 68Ga and 18F of the ARGUS small animal PET scanner based on NEMA NU-4 standard. IEEE Nuclear Science Symposium conference record. Nuclear Science Symposium. 2010.
[14] SanchezCrespo A. Comparison of Gallium-68 and Fluorine-18 imaging characteristics in positron
emission tomography. Applied Radiation and Isotopes. 2013 Jun;76;55-62.
[15] Levin CS, Hoffman EJ. Calculation of positron range and its effect on the fundamental limit of positron emission tomography system spatial resolution.
Physics in Medicine &. Biology. 1999;45(2):781-99.
[16] Susanne Z, Bjoern W, Harald B, Daniel H, Harald H. NEMA image quality phantom measurements and attenuation correction in integrated PET/MR hybrid imaging. European Journal of Nuclear Medicine and Molecular Imaging Physics. 2015;2(18):1-17.
[17] Habib J. Quantitative Analysis in Nuclear Medicine Imaging. Switzerland : Springer Science & Business Media; 2006,531.
[18] Soret M, Bacharach SL, Buvat I. Partial-Volume Effect in PET Tumor Imaging. Journal of Nuclear Medicine 2007;48(6):932-45.
[19] Soile PS, Jukka K, Ulla H, Pauliina L, Olli E, Pirjo N. Head-to-Head Comparison of 68Ga-Citrate and 18F-FDG PET/CT for Detection of Infectious Foci in Patients with Staphylococcus aureus Bacteraemia.
European Journal of Nuclear Medicine and Molecular Imaging. 2009;43(4):330-6.
[20] Kayani I, Bomanji JB, Groves A, Conway G, Gacinovic S, Win T, et al. Functional Imaging of Neuroendocrine Tumors With Combined PET/CT Using
68Ga-DOTATATE (Dota-DPhe1,Tyr3-octreotate) and 18F-FDG. The Cancer Journal 2008;112(11):
2447-55
[21] ZhaoX, ZhangC, YuH. ZangS, WangF, GuoH.
Comparison between 68Ga-labelled PSMA and 18F-FDG PET/CT in the diagnostic value of clear cell renal cell carcinoma. European Urology Supplements. 2018;17(2):412-5.
[22] Bertolli O, Eleftheriou A, Cecchetti M, Camarlinghi N, Belcari N, Tsoumpas C. PET iterative re- construction incorporating an efficient positron range correction method. Physica Medica: European Journal of Medical Physics. 2016;32(2):323-30.