89
and Safety
Available online at http://www.foodhygiene.or.kr
https://doi.org/10.13103/JFHS.2017.32.2.89
Development and Validation of an Analytical Method for
Glucuronolactone in Energy Drinks by Hydrophilic Interaction Liquid Chromatography-electrospray Tandem Mass Spectrometry
Mi Hyune Oh, Moo Song Lim, Jeung Young Chai, Eun Jung Kim, Joong Hoon Cho, Chul Joo Lim, and Sun Ok Choi* Hazardous Substances Analysis Team, Gyeongin Regional Food & Drug Administration, Incheon, Korea
(Received November 18, 2016/Revised December 20, 2016/Accepted February 24, 2017)
ABSTRACT - A rapid, sensitive analytical method for glucuronolactone in beverages was developed and vali- dated using hydrophilic interaction liquid chromatography coupled to electrospray ionization tandem mass spectrom- etry (HILIC-ESI-MS/MS). To determine the optimum analytical conditions for glucuronolactone, three different kinds of HILIC columns and two mobile phases with different pH values were examined. An amide-bonded stationary phase with a pH 9 acetonitrile-rich mobile phase was the best condition in terms of column retention, ESI-MS/MS response area, and signal-to-noise ratio. After extraction, glucuronolactone was separated through the HILIC amide column and detected by negative ESI-MS/MS in selected reaction monitoring (SRM) mode. Nine energy drinks sold in Korea were spiked with glucuronolactone at a concentration of 5 ng/mL; the Monster EnergyTM sample showed the smallest peak area and its signal-to-noise ratio was used for method validation. Good linearity was obtained in the concentration range from 20 to 1500 ng/mL with a correlation coefficient > 0.998. The developed method had a limit of detection (LOD) of 6 ng/mL and a limit of quantitation (LOQ) of 20 ng/mL. The recovery of this method at con- centration of 20, 100, 500, and 1000 ng/mL was 96.3%-99.2% with relative standard deviations (RSD) of 1.6%- 14.0%. A reproducibility precision assessment at concentration of 100 and 500 ng/mL was carried out among three laboratories. The recovery of that evaluation was 95.1%-102.3% with RSD of 2.7%-7.0%. An analysis of variance indicated that there was no difference between the recovery results of the three laboratories at the 5% significance level. The validated method is applicable to inspecting beverages adulterated with glucuronolactone in Korea.
Key words : Glucuronolactone, Energy drink, Analysis method, HILIC, ESI-MS/MS
Glucuronolactone (D-glucuronic acid γ-lactone) is a cyclic ester of glucuronic acid, which is an oxidized product of glu- cose. In many countries, glucuronolactone is a common ingredient in energy drinks, which also contain quite large amounts of caffeine and supposed energy enhancing com- ponents, such as taurine, vitamins, and herbal supplements.
Energy drinks are popular, especially with young people1-2) ; however, these drinks are known to have serious harmful effects on children and young adults owing to their high caf- feine content3). The health effects of energy drinks on chil- dren, adolescents, and young adults have been studied and the consequences of their many constituents are being researched. The pharmacological effects of energy drinks have not been verified, which has raised apprehension about the consumption of such drinks, particularly on children and
young people3). Glucuronolactone can be incorporated into pharmaceutical products in Korea but its use as a food addi- tive is strictly prohibited. To inspect illegal use of glu- curonolactone, beverages have been tested consistently in Korea using high-performance liquid chromatography (HPLC) equipped with a diode array detector (DAD). Owing to its high polarity, low molecular weight, and absence of chromo- phores, the analysis of glucuronolactone using HPLC-DAD chromatography has been carried out through derivatization with 1-phenyl-3-methyl-5-pyrazolone (PMP)4).
In reverse-phase liquid chromatography (RPLC), analytes are separated on a non-polar stationary phase in the stream of a polar mobile phase5). RPLC is the most extensively applied and accepted chromatographic technique because of its flexibility to retain and resolve various types of chemi- cals6). However, glucuronolactone is not adequately retained and poorly separated in RPLC, and PMP derivatization steps were necessary to detect it with a suitable retention time.
Normal phase liquid chromatography (NPLC) uses a hydrophilic stationary phase and a hydrophobic mobile phase. NPLC can be implemented to increase the retention
*Correspondence to: Sun Ok Choi, Hazardous Substances Anal- ysis Team, Gyeongin Regional Food & Drug Administration, 137 Juan-Ro, Nam-Gu, Incheon 402-835, Korea
Tel: 82-32-450-3251, Fax: 82-32-429-3388 E-mail: [email protected]
times of polar and small compounds, but it suffers from poor analyte solubility, unsatisfactory reproducibility, and limited compatibility with ESI-MS6). Hydrophilic interaction liquid chromatography (HILIC) adopts a conventional polar sta- tionary phase, such as non-derivatized silica or amide-, amino-, or cyano-derivatized silic5). As HILIC employs RPLC mobile phase systems, some drawbacks related to NPLC can be resolved. The HILIC-ESI-MS technique has been successfully applied to separate and determine polar low molecular-weight compounds without complicated deri- vatizations7). Ricciutelli et al. 8) adopted LC-MS/MS coupled with ESI to separate and determine glucuronolactone in energy drinks through unbounded silica KinetexTM HILIC columns with an acidic eluent. However, column retention seemed to be not enough: elution time of glucuronolactone is 1.4 min and the limit of detection (LOD) and limit of quantitation (LOQ) values were acquired by only the signal- to-noise ratios (S/N) that show large variations, depending on the analysis instruments and computing software used.
Ricciutelli et al.8) tested various C-18 and phenyl-end capped RPLC columns; however, as HILIC columns, they examined only unbounded silica columns.
Using the HILIC-ESI-MS technique, glucuronolactone in beverages was analysed in a rapid and simple way. Three HILIC columns with different column chemistries, including amide, amino, and non-derivatized silica, and two types of eluents, including an acidic (pH 3) and alkaline (pH 9) eluent, were tested to determine the optimized LC-MS/MS analyt- ical conditions. Among the various combinations of columns and eluents, an amide column and alkaline acetonitrile-rich mobile phase performed best for evaluating the peak signal- to-noise ratio, column retention, and ESI-MS response. Con- sidering the guidelines of international organizations related to chemical analysis method validation, such as AOAC (Associaion of Analytical Communities), EURACHEM (Analytical Chemistry in Europe), and ICH (International Council for Harmonisation), the developed method was fully validated according to specificity, linearity, LOD, LOQ, pre- cision, and accuracy. A reproducibility precision experiment was conducted among three laboratories to assess the degree of agreement of the results when the analysis conditions are as different as possible9).
Materials and Methods
Chemicals, standard stock solutions, and columns Glucuronolactone, ammonium acetate, and formic acid were purchased from Sigma-Aldrich Korea (Yoingin, Korea), and ammonium hydroxide solution (28%) was acquired from Merck (Darmstadt, Germany). Acetonitrile and water, both HPLC grade, were obtained from J. T. Baker (Center
Valley, PA, USA). Glucuronolactone standard stock solu- tions (1000μg/mL) were prepared by dissolving glu- curonolactone in HPLC-grade water and were stored in a refrigerator (4oC). Three kinds of HILIC columns were assayed to select the column that showed the best separation.
An AtlantisTM Silica HILIC column (3μm, 2.1 mm × 150 mm, Waters: Milford, MA, USA) was used as the non- derivatized silica-type column, an XBridgeTM BEH Amide column (3.5μm, 2.1 mm × 150 mm, Waters) was employed as the amide-type column, and a UnisonTM UK-Amino column (3μm, 2.0 mm × 150 mm, Imtakt: Portland, OR, USA) was used as the amino-type column.
Samples
Energy drink samples were purchased from a local supermarket and were stored in a refrigerator (4oC) until required.
Mobile phases
Acidic and alkaline mobile phases were evaluated to develop the analytical method. The acidic eluent was a pH 3 mobile phase (acetonitrile/water 95:5 buffed with 10 mM ammonium formate, adjusted to pH 3 using formic acid), and the alkaline eluent was a pH 9 mobile phase (acetonitrile/
water 95:5 buffed with 10 mM ammonium acetate, adjusted to pH 9 using ammonium hydroxide).
Sample preparation
An energy drink sample (1.0 g) was weighed in a 15 mL conical centrifuge tube. Then, 8 mL of water was added to the centrifuge tube, and the tube was shaken for 30 min. The solution was placed in a 10 mL volumetric flask, and the volume was made up to 10 mL with water. A 1 mL aliquot was taken out from the flask and diluted to 10 mL using the HPLC mobile phase solution. The sample solution was fil- tered through a 0.2μm polyvinylidene difluoride (PVDF) membrane syringe filter (Millipore, Milford, MA, USA) before LC-MS/MS analysis.
Analytical instrumentation
The tandem mass spectrometry analytical process used a TSQ VantageTM (Thermo Scientific) triple quadropole mass spectrometer with an electrospray ionization source. The liquid chromatography analysis was performed using an AccelaTM (Thermo Scientific) quaternary pump and an autosampler system. The injection needle was washed with the initial HPLC mobile phase solution after each injection.
Tandem mass spectrometry conditions
The mass spectrometric conditions were optimized using a 100 ng/mL solution of glucuronolactone in the pH 3 or pH
9 mobile phase. Glucuronolactone was ionized using both positive and negative electrospray ionization modes to deter- mine the tandem mass spectrometry conditions that gave the maximum response. The ESI-MS operating parameters were as follows: spray voltage, ± 3.5 kV; capillary temperature, 300oC; sheath gas pressure, 40 arbitrary units; auxiliary gas pressure, 10 arbitrary units; collision gas pressure, 200 Pa.
Method validation
Based on the guidelines of international organizations related to chemical analytical method validation, such as AOAC, EURACHEM, and ICH, the developed method was fully validated with respect to specificity, linearity, LOD, LOQ, precision (intra- and inter-day), accuracy, and reproducibility precision (between-laboratory).
This method was developed method to find beverages adulterated by deliberate addition of glucuronolactone.
Analytical methods for determining pesticide residues, animal use drugs residues, and persistent organic pollutants (POPs) use samples concentrated during sample preparation to obtain lower LOD and LOQ values. On the contrary, samples are generally diluted in analytical methods for dietary supplements and foods tainted with active pharmaceutical ingredients, such as weight loss pills, erectile dysfunction pills, and other health promotion pills, because the tainted foods have quite high concentrations of the pharmaceutical ingredients to achieve the intended active effect. In this developed method, the sample was diluted 100-fold before LC-MS/MS injection. The glucuronolactone spiked concen- tration, LOD, and LOQ were all based on the instrument analysis and not on the sample preparation procedure.
Nine energy drinks sold at a local market were spiked with glucuronolactone at 5 ng/mL to select a blank sample for method validation. The specificity of the method was evaluated by comparing the chromatograms of the blank and spiked samples. The LOD and LOQ values were determined three ways: from the signal-to-noise ratios (S/N)10-11), from the standard deviation of the calibration curve intercept and the average calibration curve slope12), and from the standard deviation obtained for the repetitive analysis of a concen- tration10-11). The linearity of the method was assessed using the correlation coefficient acquired from the calibration data in the range of 20-1500 ng/mL using a linear regression model, and changes in the linearity were observed over three
days. The accuracy was evaluated as the recovery of known amounts of glucuronolactone because a reference material could not be obtained13). The recovery was performed at four concentration levels (20, 100, 500, and 1000 ng/mL) using a matrix-matched calibration. The recovery experiment was performed in quintuplicate for three days. The recovery results were also used to determine the intra- and inter-day precision, which were calculated as RSD values. A repro- ducibility precision experiment was conducted among three laboratories at two concentration levels (100 and 500 ng/
mL),and this data underwent analysis of variance to identify whether there were any differences among the three laboratories.
Results and Discussion
Optimization of the MS/MS conditions
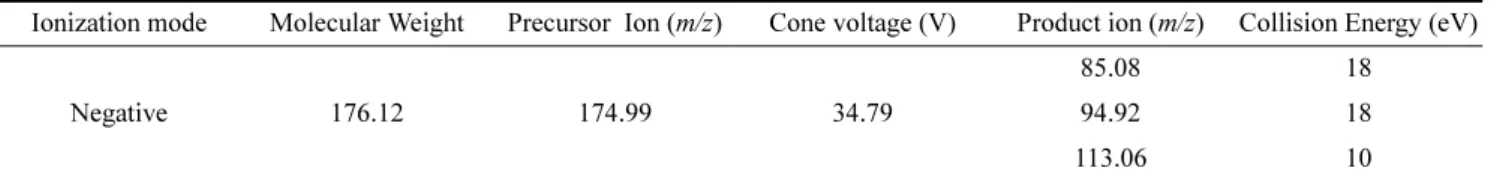
Glucuronolactone dissolved in the pH 9 mobile phase and ionized in the negative mode gave the maximum mass spectrometry response for the precursor ion. Given the numerous electronegative oxygen atoms in the molecular structure of glucuronolactone, it is quite predictable that the mass spectrometry response was unparalleled in the pH 9 mobile phase and in the negative ionization mode. The precursor ion [M-H]− produced fragment ions and three product ions, and the maximum mass spectrometry responses were determined by varying the cone voltage and collision energy. The optimized SRM detection settings, such as col- lision energy, cone voltage, precursor ion, and product ion, are shown in Table 1.
Optimization of the LC conditions
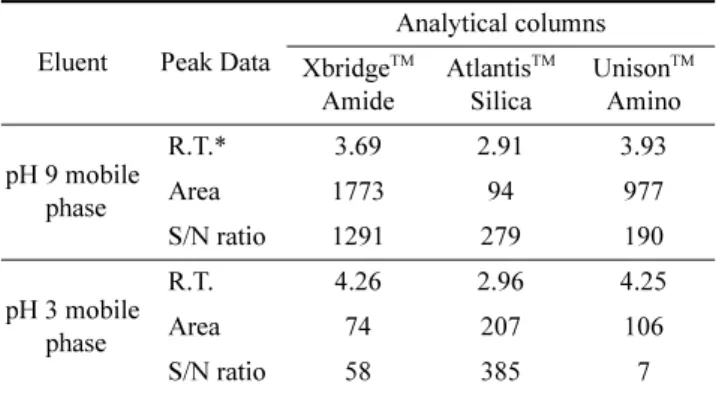
Using the established tandem mass spectrometry con- ditions, the combinations of three different HILIC columns (AtlantisTM Silica, XbridgeTM BEH Amide, and UnisonTM UK-Amino) and two types of eluents (pH 3 and pH 9 mobile phases) were evaluated at a concentration of 100 ng/mL spiked to determine the optimized LC analytical conditions.
The LC was operated in isocratic elution mode at a flow rate of 0.25 mL/min with a sample injection volume of 5μL.
The XbridgeTM BEH Amide column with the pH 9 mobile phase exhibited the best performance in terms of peak S/N ratio, column retention, and ESI-MS response. The detailed results are presented in Table 2.
Table 1. SRM transition parameters for LC-MS/MS of glucuronolactone
Ionization mode Molecular Weight Precursor Ion (m/z) Cone voltage (V) Product ion (m/z) Collision Energy (eV)
Negative 176.12 174.99 34.79
85.08 18
94.92 18
113.06 10
In HILIC columns, analytes are separated mainly through interrelated partitioning and adsorption mechanisms. The partitioning retention mechanism results from the difference in the solubility of the analyte in the acetonitrile-rich mobile phase and the water-enriched layer adsorbed onto the hydrophilic stationary phase. The adsorption separation mechanism is somewhat more complicated and involves
dipole-dipole interactions, ion-dipole interactions, hydrogen bonding, and ion-exchange interactions among the analytes, stationary phase, and mobile phase. The final separation mechanism in HILIC columns is presumably an overall consequence of the partitioning mechanism and the various adsorption retention mechanisms5-6). Glucuronolactone does not have acidic or basic functional groups that are ionizable in the pH range of the working mobile phase; therefore, ion- exchange interactions are expected to contribute less to the retention of glucuronolactone than the other retention mechanisms. The columns with basic properties (XbridgeTM Amide, UnisonTM Amino) retained glucuronolactone longer than the column with acidic properties (AtlantisTM Silica).
The acidic column generates negatively charged silanol groups in the pH 9 mobile phase, resulting in a greater con- tribution from ionic interaction related retention mechanisms6). Unexpectedly, in the acidic column, there was no significant difference in the retention times with the pH of the mobile phase. In contrast, the basic columns showed markedly longer retention times for glucuronolactone with the pH 3 mobile phase. The amino and amide functional groups in the Table 2. Comparison of glucuronolactone peak data with various
columns and mobile phases
Eluent Peak Data
Analytical columns XbridgeTM
Amide
AtlantisTM Silica
UnisonTM Amino pH 9 mobile
phase
R.T.* 3.69 2.91 3.93
Area 1773 94 977
S/N ratio 1291 279 190
pH 3 mobile phase
R.T. 4.26 2.96 4.25
Area 74 207 106
S/N ratio 58 385 7
* Retention Time (min)
Fig. 1. Chromatogram and mass spectrum of matrix spiked with glucuronolactone.
Fig. 2. Chromatogram and mass spectrum of matrix blank.
basic columns are positively charged in the pH 3 mobile phase6). The increased ionic interactions among the analytes, stationary phase, and mobile phase probably contributes to the increased retention of glucuronolactone. Elution with the pH 9 mobile phase in the basic columns produced remarkably high ESI-MS responses compared with those with the pH 3 mobile phase. This is because glucuronolactone showed a much higher MS response in the negative ESI mode, and negative ionization of glucuronolactone is more favourable in the basic mobile phase.
Method validation
Nine energy drinks sold in a local market were spiked with glucuronolactone at a concentration level of 5 ng/mL.
The Monster EnergyTM sample had the smallest peak area and signal-to-noise ratio and was selected as the blank sample for method validation to develop a reliable and applicable analytical method.
The specificity of this method was confirmed by com- paring the chromatograms of the matrix blank sample and the matrix sample spiked with glucuronolactone at a concentration level of 10 ng/mL (Fig. 1). The chromatograms of the matrix blank sample did not show any peaks at the retention time of glucuronolactone (Fig. 2).
The LOD and LOQ were obtained three ways (Table 3).
First, the LOD and LOQ were calculated from the signal- to-noise ratios (S/N), as three and ten times S/N, respect- ively10-11). Second, the LOD and LOQ were calculated as 3.3 and 10 times, respectively, the standard deviation of the calibration curve intercept divided by the average calibration curve slope10-11). Third, the LOD and LOQ were calculated as three and ten times, respectively, the standard deviation of the concentration acquired from repetitive analysis of a spiked sample12). The LOD and LOQ determined from the
S/N were slightly lower than those obtained from other two methods, which had very similar LOD and LOQ values. The LOD and LOQ determined from the S/N are considered to have somewhat lower reliability than those obtained from the other two methods because the algorithms used to calculate S/N differ according to the analysis instruments and computing software. After examining the LOD and LOQ values obtained using the three methods, the LOD and LOQ of the method were decided as 6 ng/mL and 20 ng/mL respectively.
The linearity of the method was assessed by examining the correlation coefficients of the calibration curves. The matrix blank sample was spiked with glucuronolactone at concentration levels of 20, 50, 100, 200, 500, 1000, and 1500 ng/mL. The calibration curves were based on concen- trations and peak areas acquired over three days. As shown in Table 4, the correlation coefficients (r) of the calibration curves for each day were above 0.998.
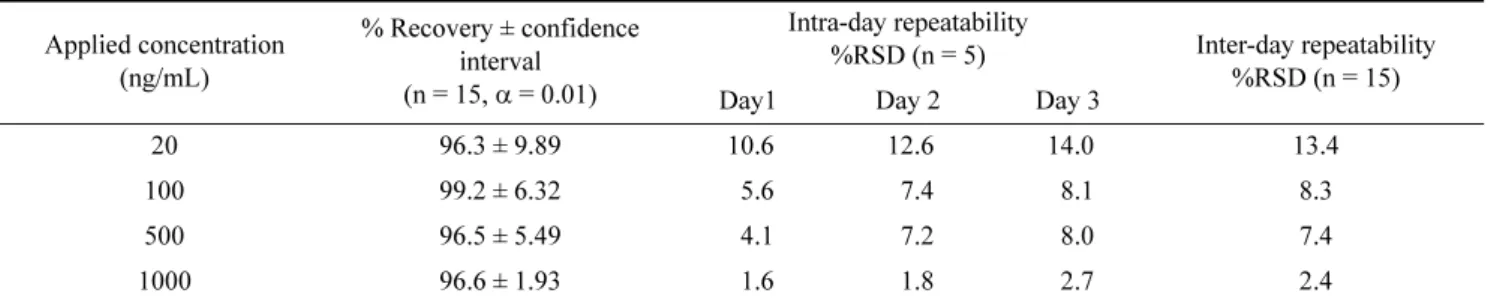
For accuracy and precision validation, the recovery was Table 3. LOD and LOQ determined using three different methods
Method LOD (ng/mL) LOQ (ng/mL)
Signal-to-noise ratio 4 9
Calibration curve
intercept & slope 7 20
Standard deviation of
spiked samples 6 21
Table 4. Linearity assessment over three days
Calibration curve equation r r2 Day 1 Y = 10.3613X− 65.1828 0.9987 0.9974 Day 2 Y = 9.03936X− 139.7 0.9993 0.9987 Day 3 Y = 9.52215X− 135.591 0.9982 0.9964
Table 5. Recovery and RSD results for glucuronolactone using this analytical method
Applied concentration (ng/mL)
% Recovery ± confidence interval
(n = 15, α = 0.01)
Intra-day repeatability
%RSD (n = 5) Inter-day repeatability
%RSD (n = 15)
Day1 Day 2 Day 3
20 96.3 ± 9.89 10.6 12.6 14.0 13.4
100 99.2 ± 6.32 5.6 7.4 8.1 8.3
500 96.5 ± 5.49 4.1 7.2 8.0 7.4
1000 96.6 ± 1.93 1.6 1.8 2.7 2.4
Table 6. Between-laboratory reproducibility precision data and variance analysis results Applied concentration
(ng/mL)
% Recovery (n = 5) Variance analysis 5% significance level % RSD (n = 5)
Lab A Lab B Lab C F F rejection P value Lab A Lab B Lab C
100 102.3 100.1 95.1 1.983 3.885 0.180 6.9 3.2 7.0
500 99.2 98.6 100.0 0.222 3.885 0.804 2.7 4.0 3.6
evaluated at four concentration levels (20, 100, 500, and 1000 ng/mL) in quintuplicate for three days. The recoveries at the four concentration levels ranged from 96.3% to 99.2%
(Table 5). The recovery data were also used for intra- and interday precision validation. The RSD of intra- and interday repeatabilities for glucuronolactone determination at the four concentration levels were found to be 1.6%-14.0% and 2.4%-13.4%, respectively (Table 5).
The between-laboratory precision results are listed in Table 6 as recovery, RSD, and variance analysis results. The recoveries obtained in the three laboratories ranged from 95.1% to 102.3% with RSD of 2.7%-7.0% at concentrations level of 100 and 500 ng/mL. The recovery and RSD data from the three laboratories are in good agreement with the AOAC criteria14). The recovery data were subjected to analysis of variance, and the determined F ratio does not lie in the critical region. Thus, there is no evidence to suggest a difference in the recovery data between the three laboratories at the 5% significance level.
Compared to a previously reported method8), this work adopted a more acetonitrile-rich eluent (95%, whereas it was 90% in the Ricciutelli et al.’s work)8), resulting in a longer retention time of glucuronolactone (3.7 min, compared to 1.4 min as reported by Ricciutelli et al.)8). In contrast to Ric- ciutelli et al.8), who used an unbounded silica column and an acidic eluent, we used an amide column and an alkaline eluent as the HILIC column and eluent, respectively, and obtained good ESI-MS response and peak S/N ratio.
Conclusions
An LC-ESI-MS/MS method using an amide-bonded HILIC column has been developed and validated for the quan- tification of glucuronolactone in beverages. The choice of the amide HILIC column and an alkaline acetonitrile-rich eluent buffered with ammonium acetate was critical for the HILIC-ESI-MS/MS analysis. When a combination of three HILIC columns and two types of eluents were tested, this combination had outstanding ESI-MS/MS response and signal-to-noise ratio for glucuronolactone. To increase the relevancy and applicability of the analytical method, the sample with the lowest MS response among the spiked samples was employed as the matrix blank sample for the method validation. The developed method was fully validated according to the guidelines of AOAC and EURACHEM. The accuracy and precision validation para- meters were acceptable within the AOAC criteria for standard methods. The variance analysis of the recovery results from three laboratories showed no differences at the 5% significant level. This method is aimed at the sensitive and reliable analytical determination of glucuronolactone,
and the developed method can be successfully applied to monitoring illegally added glucuronolactone in beverages in Korea.
Acknowledgement
This work was supported by the Ministry of Food and Drug Safety (MFDS) R&D project* in 2017.
*Monitering of illegally added compounds and drugs in foods-focused on prohibited ingredients (17161MFDS062).
국문요약
에너지 음료는 카페인을 주성분으로 타우린, 비타민 같 은 다른 energy-enhancing 성분을 함유하고 있다. 미국과 유럽에서는 글루쿠로노락톤이 에너지 음료에 첨가될수 있 으나, 국내에서 의약품으로는 허가되어 있다. 따라서 식품 첨가물로는 그 사용이 금지 되어 있어, 지속적으로 수입 및 유통 음료에서 시험검사를 하여 규제하고 있다. 현재 분석법으로 사용하는 LC-PDA 법은 복잡한 유도체화 과 정을 거치고, 음료 중에 당류들이 위양성 결과를 나타내 기도 한다. 이런 기존 방법의 단점을 개선하기 위해 HILIC- ESI-MS/MS (hydrophilic interaction liquid chromatography coupled to electrospray ionization tandem mass spectrometry) 를 이용한 분석법을 개발하고, 선택성, 직선성, 검출한계, 정량한계, 정밀도, 정확성, 재현성에 대하여 분석법 유효 성 검증을 수행했고, AOAC, EURACHEM 가이드라인에 부합되는 결과를 얻었다.
References
1. Heckman, M.A., Sherry, K., Gonzalez, De., Mejia. E.: Energy drinks: An assessment of their market size, consumer demo- graphics, ingredient profile, functionality, and regulations in the United States, Compr. Rev. Food Sci. Food Saf., 9, 303- 317 (2010).
2. Miller, K.E.: Energy drinks, race, and problem behaviors among college students. J. Adolesc. Health, 43, 490-497 (2008).
3. Seifert, S.M., Schaechter, J.L., Hershorin, E.R,. Lipshultz, S.E.: Health effects of energy drinks on children, adolescents, and young adults, Pediatrics, 127, 511-528 (2011).
4. Suzuki, S., Hayase, S., Nakano, M., Oda, Y., Kakehi, K.:
Analysis of glucuronolactone and glucuronic acid in drug for- mulations by high-performance liquid chromatography. J.
Chromatogr. Sci., 36, 357-360 (1998).
5. Buszewski, B., Noga, S.: Hydrophilic interaction liquid chro- matography (HILIC)-a powerful separation technique, Anal.
Bioanal. Chem., 402, 231-247 (2012).
6. Grumbach, E.S., Fountain, K.J.: Comprehensive Guide to HILIC. Waters Corporation: Milford MA (2010).
7. Schlichtherle-Cerny, H., Affolter, M., Cerny, C.: Hydrophilic interaction liquid chromatography coupled to electrospray mass spectrometry of small polar compounds in food analy- sis. Anal. Chem., 75, 2349-2354 (2003).
8. Ricciutelli, M., Caprioli, G., Cortese, M., Lombardozzi, A., Strano, M., Vittori, S., Sagratini, G.: Simultaneous determi- nation of taurine, glucuronolactone and glucuronic acid in energy drinks by ultra high performance liquid chromatogra- phy-tandem mass spectrometry (triple quadrupole). J. Chro- matogr. A., 1364, 303-307 (2014).
9. AOAC. Guidelines for single laboratory validation of chem- ical methods for dietary supplements and botanicals. AOAC (2002).
10. International Conference on Harmonization (ICH). Validation of analytical procedures: Text and methodology Q2 (R1). ICH
(1994).
11. U.S. Department of Health and Human Services, Food and Drug Administration, Center for Veterinary Medicine. 1999.
Validation of analytical procedures: Methodology.
12. EURACHEM. The fitness for purpose of analytical methods:
A laboratory guide to method validation and related topics.
EURACHEM (1998).
13. Shabir, G.A.: Validation of high-performance liquid chroma- tography methods for pharmaceutical analysis. Understand- ing the differences and similarities between validation re- quirements of the US Food and Drug Administration, the US Pharmacopeia and the International Conference on Harmoni- zation. J. Chromatogr. A., 987, 57-66 (2003).
14. AOAC. Guidelines for standard method performance require- ments. AOAC (2012).