Development and Validation of the Determination of Sorafenib in Human Plasma using Tandem Mass Spectrometry Coupled with Liquid Chromatography
Daejin Park
1, Sunggon Lee
2and Woomi Kim
1*
1
Departments of Pharmacology and
2Family Medicine, Kosin University College of Medicine, Busan 602-702, Korea
Received October 19, 2012 /Revised November 8, 2012 /Accepted November 8, 2012Sorafenib is a multikinase inhibitor and an oral anticancer drug approved for the treatment of patients with advanced renal cell carcinoma and those with unresectable hepatocellular carcinoma. The pur- pose of this study was to develop an efficient method of the determination of sorafenib in human plasma using tandem mass spectrometry coupled with liquid chromatography (LC/MS/MS) and vali- date the method by the guidelines of the Korean Food and Drug Administration (KFDA). Plasma sam- ples (100 μl) were added with chlorantraniliprole as an internal standard and then mixed with the 0.1% formic acid-containing extraction solution composed of isopropyl alcohol and ethyl acetate (1:4, v/v). After centrifugation, the supernatant was concentrated at 45°C under negative pressure and cen- trifugal force. The residue was reconstituted with a mobile phase and injected into the HPLC instru- ment using a reverse phase Waters XTerra
TMC18 column (particle size 3.5 μm). Liquid chromatog- raphy was carried out within the run time of 5 min using a mobile phase composed of buffer (0.1%
formic acid and 10 mM ammonium formate), methanol, and acetonitrile (1:6:3, v/v/v). The analytes were monitored by tandem mass spectrometry in the multiple reaction monitoring method pro- grammed to detect sorafenib at ‘m/z 465.2 → 252.5’ and chlorantraniliprole at ‘m/z 484.4 → 286.2’ with positive electrospray ionization mode (ES
+). The result showed the proper linearity (r
2>0.99) over the range of 2,000-5,000 ng/ml with good accuracy (90.7-103.9%) and precision (less than 10%). The newly developed method using LC/MS/MS was validated by the guideline of KFDA and identified as more sensitive compared to the previous methods.
Key words : Anticancer drug, sorafenib, chlorantraniliprole, LC, MS, MS, tandem mass spectrometry coupled with liquid chromatography
*Corresponding author
*Tel:+82-51-990-6437, Fax:+82-51-990-3081
*E-mail : [email protected]
Introduction
Sorafenib is an oral anticancer drug with the structure of diphenylurea derivative (Fig. 1). The anticancer targets inhibited by this drug are several protein kinases that are members of the Raf family of kinases, cell surface tyrosine kinases, vascular endothelial growth factor receptors (VEGFR), and platelet derived growth factor receptors (PDGFR) [8]. These protein kinases are directly related with regulation of multiple aspects of cancer growth like angio- genesis and multiplication. In cancer cell lines studies, sor- afenib has shown potent antitumor activity against a variety of human cancer cell lines, including human colon, lung, breast and ovarian [9]. FDA-approved indication of sor- afenib was the treatment of patients with advanced renal cell carcinoma (RCC) and those with unresectable hep-
atocellular carcinoma (HCC) [2,5].
In phase I studies with patients with advanced solid tu- mors, pharmacokinetic parameters had a considerable inter- patient variability but increased C
maxand AUC
0-12in plasma correlate with increased dose frequency and total dose [3].
For example, interpatient coefficient of variation was 70%
in 22 patients in whom AUC
0-24was calculated after a single 100mg oral dose. However, by increasing oral daily doses to 400 mg, the therapeutic range of the most patients could be achievable although the large interpatient variability.
Accordingly, it was chosen with the dosage of 400 mg per
day for oral administration in phase III studies with patients
with RCC and HCC [2,5]. However, in that case, the in-
cidence of toxicity would increase. If the dose is optimized
by the pharmacokinetic modulation, it could not be
overdosed. The specific and accurate quantification method
of sorafenib is essential to explore the pharmacokinetic pro-
file of sorafenib. In the beginning of sorafenib development,
analytical methods based on reversed-phase high perform-
Sorafenib Chlorantraniliprole Fig. 1. Structures of sorafenib and chlorantraniliprole.
ance liquid chromatography (HPLC) have been reported for the quantitative determination of sorafenib in mouse plasma [1]. The method had the selectivity and the linearity over the concentration range of 80-2,000 ng/ml. Recently, the more precise methods with lower limit of quantification are published using tandem mass spectrometry coupled with HPLC (LC/MS/MS) [10]. That method was 10 times more sensitive than the previous HPLC method of which lower limit of quantification was 80 ng/ml. The chromatographic run time was reduced from 35 to 6 min so that it could make it faster to analyze a large number of plasma samples. Here, we describe a more rapid and sensitive method for the deter- mination of sorafenib in human plasma based on LC/MS/MS with electrospray positive ionization.
Materials and Methods Chemicals and reagents
Sorafenib was supplied by Bayer HealthCare (Leverkusen, Germany) in the form of film-coated tablets composed of sorafenib tosylate (200 mg as a sorafenib) and other additives (roscarmellose sodium, microcrystalline cellulose, hypro- mellose, sodium lauryl sulphate, magnesium stearate, poly- ethylene glycol, titanium dioxide, ferric oxide red and so on).
Chlorantraniliprole (CAS number: 500008-45-7), internal standard, was purchased from Sigma (st. Louis, MO, USA).
Acetonitrile, methanol, ethyl acetate, isopropanol, ammo- nium formate and formic acid were obtained from Merck (KGaA, Darmstadt, Germany). All solvents had high ana- lytical grade for HPLC or mass spectrometry. Human pooled plasma and six individual human plasma were purchased from Biochemed (Winchester, VA, USA) and certificated to be healthy and drug-free volunteers (20-30 ages, both sex).
Water was deionized by a Milli-Q water purification system (Millipore, Bedford, MA, USA).
Sample preparation
Stock solutions of sorafenib and chlorantraniliprole were
prepared with 80% methanol to the concentration of 1
mg/ml and were kept at -70°C. Working solutions (10-fold
standard solutions) of sorafenib were obtained by serial dilu-
tions of stock solutions at the following concentration: 0.02,
0.05, 0.5, 1, 5, 10, 50 μg/ml with 80% methanol. Working
solution of chlorantraniliprole was also prepared at the con-
centration of 10 μg/ml. Before extraction, Each 100 ul vol-
ume of standard solution was prepared by mixing 90 ul
blank plasma with 10 ul working standard solution to ach-
ieve final concentrations of 2, 5, 50, 100, 500, 1,000, 5,000
ng/ml and all plasma solutions were added with 10 ul work-
ing solution of chlorantraniliprole used as internal standard
(IS). After mixing with IS, a 900 ul of extraction solution
was added to the standard solution in a 2 ml mini-eppendorf
tube. The mixture was vortex-mixed for 5 minutes and cen-
trifuged at 13,500 rpm for 10 minutes. Extraction solution
consisted of organic solutions mixed with ethyl acetate and
isopropanol in ratio of 4:1 (v/v) containing with 0.1% formic
acid. A 800 ul volume of the organic top layer was trans-
ferred to another tube and evaporated to dryness in a
Centrivap mobile system (Labconco, Kansas, MO, USA) for
60 min at 45°C on centrifugal negative pressure. The residue
was reconstituted in 100 ul mobile phase and filtered
through a 0.22 um PVDF filter in 1 ml syringe (Norm-ject)
with Luer-lock tip. Filtered solution was transferred to
300-ul insert equipped in a 2-ml polypropylene autosampler
vial sealed with a Teflon crimp cap. A 5 ul volume of the
filtrate was injected to the column part from the autosample
ature of 10°C. Quality-control (QC) plasma samples of 5, 100, 5,000 ng/ml concentrations were prepared by using the same method described above.
Instruments, chromatography and mass spectroscopy
The determination of sorafenib was performed using the LC/MS/MS system, known as Quattro Premier
™XE cou- pled with Alliance HPLC (2795XE separations module) made from Waters (Milford, NJ, USA). Separating column of HPLC system was a reverse-phase Waters XTerra
®MS C18 column (150 mm × 2.1 mm, i.d.) being packed with the stationary phase of 3.5 μm diameter particles and operating at 35°C by a temperature-controlled heating device. The mo- bile phase was eluted in an isocratic manner, which con- sisted of eluent A 10%, B 30% and C 60%, at the flow rate of 0.2 ml/min. Eluent A was distilled water with 10 mM ammonium formate containing 0.1% formic acid. Eluent B consisted of 100% acetonitril and eluent C, 100% methanol.
Sample effluent passed through column was introduced into the interface of a triple quadrupole mass spectrometric de- tector equipped with an electrospray probe operating in elec- trospray positive-ionization mode (ES
+) at a cone voltage of 40 kV for sorafenib and 24 kV for internal standard and the temperature of 350°C. The programmed ion transitions of [M+H]
+were set at m/z 465.2 → 252.5 for sorafenib and m/z 484.4 → 286.2 for the internal standard to pass from the first quadrupole (Q1) through the third quadrupole (Q3).
The collision energy of the collision cell (Q2) was set at 36 eV for sorafenib and 22 eV for the internal standard. This system was controlled by Waters MassLynx v4.1.
Calibration curves and method validation
According to the guideline of Korean Food and Drug Administration, the method was validated for selectivity, limit of quantification, extraction efficiency, linearity, accu- racy, precision and stability [4]. All concentrations of calibra- tion curves and QCs were calculated from the response ob- tained with the peak area ratio of sorafenib to chloran- traniliprole per sample using a weighted (1/x
2) least-squares linear regression analysis. The limit of detection (LOD) was selected as the concentration with more than 3 times signal to noise ratio (S/N) for peak height. It was selected as the lower limit of quantification (LLOQ), the lowest standard concentration among the quantifiable concentrations of the calibration curve when having at least more than 10 of S/N
within the range of 80 - 120%. The specificity of the method was tested by elucidating whether there were coincident peaks of endogenous or exogenous components in chroma- tograms of extracted human plasma originated from six dif- ferent donors. The linearity was assessed by the correlation coefficient (r
2) after the calibration curves were plotted to 5 copies within the following ranges; 2, 5, 50, 100, 500, 1,000, 5,000 ng/ml. The accuracy and precision were validated by assessing 5 copies of QC sample concentrations (2, 5, 100, 5,000 ng/ml) within one day (the intra-day assay) and also totally five copies from 5 consecutive days (the inter-day as- say). The accuracy of the method was described by the per- centage of calculated mean concentration to the nominal concentration of sorafenib for every QC concentration. The precision was described by the coefficient of variation (CV,
%), the percentage of the standard deviation to mean concen- tration for all calculated QC concentrations at each levels.
The extraction efficiencies of the assay were measured by comparing the peak areas of sorafenib passed through the extraction procedure from human plasma with aqueous standard solutions made by mobile phase in triplicates at the concentrations of the low, middle and high QCs. The short-term temperature stability and post-preparative stabil- ity of sorafenib in human plasma were tested. All stabilities were determined by using 3 copies of the low and high QCs (5, 5,000 ng/ml). The short-term temperature stability was assessed by determining the levels after QC plasma samples had been kept at room temperature for 6 hours. The post-preparative stability was estimated by determining the concentrations after post-extraction samples had been kept in the auto-sampler for 24 hours. The short-term temper- ature stability and post-preparative stability were described by the percentage of determined mean concentrations to the nominal concentrations of sorafenib.
Results Ion transition
The mass spectra of sorafenib and chlorantraniliprole
showed the peaks of parent molecules at m/z 465.2 and 484.4
as a protonated molecular ion ([M+H]
+), respectively. The
[M+H]
+of major fragments (daughter molecules) were ob-
served at m/z 252.5 for sorafenib on the collision energy level
of 36 eV and at m/z 286.2 for chlorantraniliprole on 22 eV,
which were detected for subsequent monitoring in the third
Fig. 2. Mass spectra of the product ions from sorafenib and chlorantraniliprole according to the collision energy. As the collision energy (CE) was increasing, the product ions were less smaller and parent ions ([M+H]+) were disappearing. A) Parent ions of sorafenib were at
m/z
465.2 and major product ions ofm/z
252.5 were increasing. B) Parent ions of chlorantraniliprole (internal standard) were atm/z
484.4 and product ions with ofm/z
286.2 were appearing.quadrupole (Fig. 2).
Specificity, linearity and extraction efficiency
The retention time of sorafenib was about 2.6 min. The limit of detection (LOD) was 100 pg/ml with the S/N ratio of 4.7 (Fig. 3). The lower limit of quantification (LLOQ) was selected as 2 ng/ml which had the sufficient S/N ratio of 42.3 and the CV of less than 10%. No interfering peak of endogenous plasma component of blank plasma was de- tected at the retention time of sorafenib in the chromato- grams of blank human plasma from six donors, as shown on the chromatogram of one human plasma among them (Fig. 4). The assay had the linearity over the concentration range (2-5,000 ng/ml). The linear-regression correlation co- efficients (r
2) were obtained with above the value of 0.99 in all standard curves. Its regression equation on the first day was 'y=0.0061 x + 0.00155 (r
2>0.999, p<0.01)' As summar-
ized in Table 1, the mean extraction efficiencies of sorafenib from plasma in the concentrations of 5and 5,000 ng/ml had the range of 40.2-47.4%.
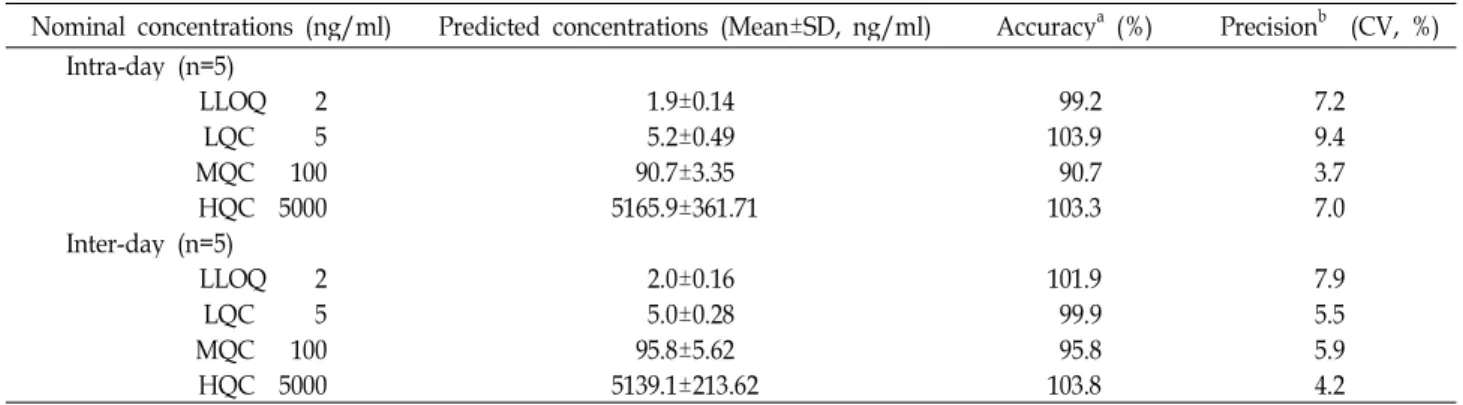
Precision and accuracy
The results were summarized in table 2 for the precision and accuracy data of the intra- and inter-day assay. The CV of the precision ranged from 3.7 to 9.4% in the intra-day assay and from 4.2 to 7.9% in the inter-day assay, which were all below 10%. As the result of accuracy, there were the predicted concentrations in the range of 90.7-103.9% of the nominal QC concentrations, which were not deviated from the range between 90 and 110%.
Stability
Sorafenib and chlorantraniliprole have shown a high sta-
bility in human plasma (table 3). When the QC samples were
Table 1. Extraction efficiency of sorafenib from human plasma
QCa PreparationMean±SD (peak areab)No preparation Extraction efficiency (%)
5 1156±127.4 2731±514.4 42.3
100 22998±2709.9 48473±6761.7 47.4
5000 1994188±131300.4 4960666±373693.5 40.2
aQuality control concentration (ng/ml),bPeak areas of sorafenib in chromatograms were analyzed after extraction with sorafenib from human plasma or directly in organic solution without preparation
Abbreviation: QC, Quality control samples; SD, Standard deviation Fig. 3. Chromatograms of sorafenib in low concentrations. The
limit of detection (LOD) of sorafenib is 0.1 ng/ml and the lower limit of quantification (LLOQ) is 2 ng/ml with the signal to noise (S/N) ratio of 42.
extracted after they had been kept at a room temperature for 24 hours, their mean levels of predicted concentration were determined to be 105.4% for the low QC (5 ng/ml) and 107.6% for the high QC (5,000 ng/ml). In addition, the levels of sorafenib were estimated to have no significant deg- radation in the post-preparative and freeze-thaw stability tests (90% < predicted concentrations ratio < 110%).
Discussion
In pharmacokinetic study, it was essential of the precise
Fig. 4. Specific peaks of sorafenib and chlorantraniliprole in comparison to the peaks of blank plasma ingredients.
There was no interfering peak of endogenous plasma component in blank plasma in comparison to the peaks of sorafenib (2 ng/ml) and chlorantraniliprole (20 ng/ml) spiked in plasma. The retention times for sor- afenib and internal standard were approximately 2.6 min and 2.4 min, respectively.
and accurate method for the determination of drug level in
biological plasma. Conventional HPLC was previously used
but recently replaced with LC/MS/MS system for sorafenib
analysis in common with general chemical agents. Although
ultra-performance lquid chromatography (UPLC) had supe-
rior separation efficiency than conventional HPLC because
it had employed smaller particles of 1.7 μm size in column,
it had not been exploited in the analysis of sorafenib without
Table 2. Accuracy and precision of method for the determination of sorafenib
Nominal concentrations (ng/ml) Predicted concentrations (Mean±SD, ng/ml) Accuracya (%) Precisionb (CV, %) Intra-day (n=5)
LLOQ 2 1.9±0.14 99.2 7.2
LQC 5 5.2±0.49 103.9 9.4
MQC 100 90.7±3.35 90.7 3.7
HQC 5000 5165.9±361.71 103.3 7.0
Inter-day (n=5)
LLOQ 2 2.0±0.16 101.9 7.9
LQC 5 5.0±0.28 99.9 5.5
MQC 100 95.8±5.62 95.8 5.9
HQC 5000 5139.1±213.62 103.8 4.2
a(Predicted mean concentration/nominal concentration)×100 (%), b(SD/Mean) Estimated concentration×100 (%)
Abbreviation: LLOQ, Lower limit of quantification; LQC, Low concentration of quality control; MQC, Middle concentration of quality control; HQC, High concentration of quality control; SD, Standard deviation; CV, Coefficient of variation
Table 3. Stability assessment in human plasma
Nominal concentrations (ng/ml) Predicted concentrations (n=3, Mean±SD, ng/ml) Stabilitya (%) Post-preparative stability (10°C, for 6 hours)
LQC 5 4.8±0.37 96.3
HQC 5000 5297.0±443.74 105.9
Short-term stability (room temperature, for 24 hours)
LQC 5 5.3±0.26 105.4
HQC 5000 5378.3±245.93 107.6
Freeze-thaw stability (-20°C)
LQC 5 4.8±0.37 96.1
HQC 5000 5432.0±168.54 108.6
a(Predicted mean concentration/nominal concentration)×100 (%)
Abbreviation: LQC, Low concentration of quality control; HQC, High concentration of quality control; SD, Standard deviation
mass spectrometry [6]. In this study, the method of sorafenib
analysis in human plasma was developed by using LC/MS/MS. Human plasma should be processed before LC/MS/MS analysis in order to eliminate the interfering plasma ingredients and prevent the contamination of analy- sis system. Preparation methods for the determination of sorafenib in biological plasma can be categorized into three classes: protein precipitation, liquid-liquid extraction and solid-phase extraction. Zhao et al. used the protein precip- itation which was simple and short-processing [10]. In early period of our method development, the protein precipitation was used and proved to be simple and speedy as mentioned by Zhao et al. However, several dozen injections seriously contaminated the column part and stopped the assay runs because of the high back pressure (data not shown). So HPLC system was required for frequent cleanup of the col- umn part. Therefore, we developed the optimized liquid-liq- uid extraction method using the organic solution of iso- propyl alcohol and ethyl acetate. Although long time process
and low extraction efficiency (less than half), this prepara- tion method achieved the stable back pressure of HPLC part even after several hundred injections. It was reported that conventional HPLC method had spend 35 minutes in one run [1] and LC/MS/MS method required 6 minutes [10].
However, newly developed LC/MS/MS method was able
to finish one run within 5 minutes with high sensitivity. In
this method, it was found that LLOQ (2 ng/ml) of this meth-
od was lower level as compared with other methods: 80 [1],
10 [7] and 7.3 ng/ml [10]. In conclusion, the lower limit of
quantification of this method had forty-fold lower level as
compared with 80 ng/ml in mouse plasma and a chromato-
graphic run time per injection was reduced from 35 to 5
minutes. Sorafenib and internal standard were well sepa-
rated without the background interferences of blank human
plasma. Validation results showed the proper linearity
(r
2>0.99) over the range of 2-5,000 ng/ml with good accuracy
(90.7-103.9%) and precision (less than 10%). A sensitive
method has been developed and validated for the determi-
초록:고속액체크로마토그래피 텐덤질량분석기법을 이용한 사람 혈장 내 소라페닙 농도분석법의 개발 및 검정
박대진
1․이성곤
2․김우미
1*
(
1고신대학교 의과대학 약리학교실,
2고신대학교 복음병원 가정의학과)
소라페닙은 멀티카이네즈 억제제로서 신세포암, 전이성 간세포암 환자의 치료에 효과가 입증된 경구용 항암제 이다. 이 연구의 목적은 고속액체크로마토그래피 텐덤질량분석기법(LC/MS/MS)을 이용하여 사람 혈장 내 소라 페닙의 농도를 측정하는 효율적인 방법을 개발하고 한국식품의약품안전청(KFDA) 기준에 따라 분석법을 검정하 는 것이다. 혈장시료(100 μl)에 내부표준물질인 chlorantraniliprole을 첨가한 후 이소프로필알콜과 에틸아세테이 트로 구성(1:4, v/v)된 0.1% 포름산 함유 추출용액을 혼합하였다. 원심분리 후 상층액을 취하여 원심감압농축하였 다. 잔사를 이동상에 재용해하고 Waters사의 역상 XTerra
TMC18 칼럼(입자크기 3.5 μm)을 장착한 고속액체크로 마토그래피 장치에 주입하였다. 액체크로마토그래피는 0.1% 포름산과 10 mM 암모늄 포메이트를 함유한 버퍼용 액과 메탄올, 아세토나이트릴을 각각 1:6:3으로 혼합한 용액을 이동상으로 사용하였으며 5분 내에 측정을 완료하 였다. 분석대상 물질들은 텐덤질량분석기에서 electrospray 양이온 이온화(ES+) 검출방식으로 확인하였으며 소라 페닙은 ‘m/z 465.2 → 252.5’, chlorantraniliprole은 ‘m/z 484.4 → 286.2’으로 구성한 multiple reaction monitoring 방법을 사용하였다. 검정 결과, 2-5,000 ng/ml의 농도 구간에서 양호한 직선성(r
2>0.99)과 정확도(90.7-103.9%), 정 밀도(10% 이하)를 나타내었다. 새롭게 개발된 LC/MS/MS을 이용한 사람 혈장 내 소라페닙의 농도 측정법은 KFDA 기준을 만족하였으며, 기존의 방법에 비해 민감도가 높은 방법이었다.
References
1. Afify, S., Rapp, U. R. and Hogger, P. 2004. Validation of a liquid chromatography assay for the quantification of the Raf kinase inhibitor BAY 43-9006 in small volumes of mouse serum.
J. Chromatogr. B Analyt. Technol. Biomed. Life Sci.
809, 99-103.2. Escudier, B., Eisen, T., Stadler, W. M., Szczylik, C., Oudard, S., Siebels, M., Negrier, S., Chevreau, C., Solska, E., Desai, A. A., Rolland, F., Demkow, T., Hutson, T. E., Gore, M., Freeman, S., Schwartz, B., Shan, M., Simantov, R. and Bukowski, R. M. 2007. Sorafenib in advanced clear-cell re- nal-cell carcinoma.
N. Engl. J. Med.
356, 125-134.3. Hotte, S. J. and Hirte, H. W. 2002. BAY 43-9006: early clinical data in patients with advanced solid malignancies.
Curr.
Pharm. Des.
8, 2249-2253.4. KFDA Guidance for Industry, Bioanalytical method vali- dation, National Institute of Toxicology Department. 2003.
http://www.kfda.go.kr/
5. Llovet, J. M., Ricci, S., Mazzaferro, V., Hilgard, P., Gane, E., Blanc, J. F., de Oliveira, A. C., Santoro, A., Raoul, J. L., Forner, A., Schwartz, M., Porta, C., Zeuzem, S., Bolondi, L., Greten, T. F., Galle, P. R., Seitz, J. F., Borbath, I., Haussinger,
carcinoma.
N. Engl. J. Med.
359, 378-390.6. Park, D. J. and Kim, W. M. 2009. The rapid determination of gemcitabine by reversed-phase ultra-performance liquid chromatography
. J. Life Sci
. 19, 1698-1704.7. Sparidans, R. W., Vlaming, M. L., Lagas, J. S., Schinkel, A.
H., Schellens, J. H. and Beijnen, J. H. 2009. Liquid chroma- tography-tandem mass spectrometric assay for sorafenib and sorafenib-glucuronide in mouse plasma and liver ho- mogenate and identification of the glucuronide metabolite.
J. Chromatogr. B Analyt. Technol. Biomed. Life Sci.
877, 269-276.8. Wilhelm, S. and Chien, D. S. 2002. BAY 43-9006: preclinical data.
Curr. Pharm. Des.
8, 2255-2257.9. Wilhelm, S. M., Adnane, L., Newell, P., Villanueva, A., Llovet, J. M. and Lynch, M. 2008. Preclinical overview of sorafenib, a multikinase inhibitor that targets both Raf and VEGF and PDGF receptor tyrosine kinase signaling.
Mol.
Cancer Ther.
7, 3129-3140.10. Zhao, M., Rudek, M. A., He, P., Hafner, F. T., Radtke, M., Wright, J. J., Smith, B. D., Messersmith, W. A., Hidalgo, M.
and Baker, S. D. 2007. A rapid and sensitive method for determination of sorafenib in human plasma using a liquid chromatography/tandem mass spectrometry assay.