ISSN 2234-3806 • eISSN 2234-3814
https://doi.org/10.3343/alm.2019.39.1.91
Dose Estimation Curves Following In Vitro X-ray Irradiation Using Blood From Four Healthy Korean Individuals
Mi-Ae Jang, M.D.1*, Eun-Ae Han, M.T.1*, Jin Kyung Lee M.D.2, Kwang Hwan Cho, Ph.D.3, Hee Bong Shin , M.D., Ph.D.1, and You Kyoung Lee , M.D., Ph.D.1
1Department of Laboratory Medicine and Genetics, Soonchunhyang University Bucheon Hospital, Soonchunhyang University College of Medicine, Bucheon, Korea; 2Department of Laboratory Medicine, Korea Cancer Center Hospital, Korea Institute of Radiological and Medical Sciences, Seoul, Korea; 3Department of Radiation Oncology, Soonchunhyang University Bucheon Hospital, Soonchunhyang University College of Medicine, Bucheon, Korea
Cytogenetic dosimetry is useful for evaluating the absorbed dose of ionizing radiation based on analysis of radiation-induced chromosomal aberrations. We created two types of in vi- tro dose-response calibration curves for dicentric chromosomes (DC) and translocations (TR) induced by X-ray irradiation, using an electron linear accelerator, which is the most frequently used medical device in radiotherapy. We irradiated samples from four healthy Korean individuals and compared the resultant curves between individuals. Aberration yields were studied in a total of 31,800 and 31,725 metaphases for DC and TR, respec- tively, obtained from 11 X-ray irradiation dose-points (0, 0.05, 0.1, 0.25, 0.5, 0.75, 1, 2, 3, 4, and 5 Gy). The dose-response relationship followed a linear-quadratic equation, Y=C +αD+βD2, with the coefficients C=0.0011 for DC and 0.0015 for TR, α=0.0119 for DC and 0.0048 for TR, and β=0.0617 for DC and 0.0237 for TR. Correlation coefficients be- tween irradiation doses and chromosomal aberrations were 0.971 for DC and 0.6 for TR, indicating a very strong and a moderate correlation, respectively. This is the first study im- plementing cytogenetic dosimetry following exposure to ionizing X-radiation.
Key Words: Chromosome aberration, Cytogenetic dosimetry, X-ray, Dicentric chromosome, Translocation, Correlation
Received: January 2, 2018
Revision received: February 14, 2018 Accepted: July 10, 2018
Corresponding author: You Kyoung Lee, M.D.
https://orcid.org/0000-0003-1835-2007 Department of Laboratory Medicine and Genetics, Soonchunhyang University Bucheon Hospital, Soonchunhyang University College of Medicine, 170 Jomaru- ro, Wonmi-gu, Bucheon 14584, Korea Tel: +82-32-621-5941
Fax: +82-32-621-5944 E-mail: [email protected]
Co-corresponding Author: Hee Bong Shin, M.D.
https://orcid.org/0000-0001-5602-5723 Department of Laboratory Medicine and Genetics, Soonchunhyang University Bucheon Hospital, Soonchunhyang University College of Medicine, 170 Jomaru- ro, Wonmi-gu, Bucheon 14584, Korea Tel: +82-32-621-5942
Fax: +82-32-621-5944 E-mail: [email protected]
* These authors contributed equally to this manuscript.
© Korean Society for Laboratory Medicine This is an Open Access article distributed under the terms of the Creative Commons Attribution Non-Commercial License (http://creativecom- mons.org/licenses/by-nc/4.0) which permits unrestricted non-commercial use, distribution, and reproduction in any medium, provided the original work is properly cited.
Cytogenetic dosimetry is an important technology for estimating the ionizing radiation dose absorbed by an individual and is based on chromosomal damage following chronic or acute exposure
[1-3]. In Korea, cytogenetic dosimetry has been used by a few national centers, such as the Korea Institute of Radiological &
Medical Sciences (KIRAMS) and the Radiation Health Institute
2017-03-16 https://crossmark-cdn.crossref.org/widget/v2.0/logos/CROSSMARK_Color_square.svg
(RHI), to provide a dose assessment for individuals employed in the nuclear power industry and to prepare for potential expo- sure via radiation emergency [4, 5]. However, very few clinical laboratories have been equipped to provide biodosimetry ser- vices.
Of the several available cytogenetic dosimetry techniques, a dicentric chromosome (DC) assay and FISH translocation (TR) assay have recently been approved as new health technologies by the committee for New Health Technology Assessment (nHTA) pursuant to the Medical Services Act of August 2016 [6]. The main objective of cytogenetic dosimetry is to assess the irradi- ated dose reflecting the damage caused by ionizing radiation and to recommend appropriate treatment for exposed patients [7, 8]. However, there are some challenges in disseminating these new practices in most clinical laboratories in Korea: (1) lack of adequate radiation generators, (2) unavailability of refer- ence standards reflecting in vivo responses, (3) difficulties in achieving sample irradiation with a target dose, and (4) a com- plicated statistical analysis for correct calibration curve-fitting procedure [2, 9].
We constructed in vitro dose-response calibration curves for DC and TR induced by X-ray irradiation generated with an elec- tron linear accelerator (LINAC), which is the most frequently used medical device in external beam radiotherapy [9, 10]. We irradiated samples from four healthy Korean individuals and com- pared the resultant curves between individuals.
After obtaining informed consent, heparinized peripheral blood samples were collected from two males (36 and 22 years) and two females (28 and 24 years) in a tertiary-care hospital in Bu- cheon, Korea. Since chromosomal aberrations are known to be affected by factors such as age, sex, and smoking status [2], we chose study participants considering these factors. None had a history of smoking, and they had never been subjected to radio- therapy or chemotherapy. The samples were aliquoted into 11 separate tubes (one control and 10 for acute single exposure to doses of 0.05, 0.1, 0.25, 0.5, 0.75, 1, 2, 3, 4, and 5 Gy). X-rays were generated using a 6MV LINAC (Siemens, Concord, CA, USA) at a dose rate of 0.5 Gy/min. The samples were placed at the center of a 20×20 cm radiation field at a source-sample dis- tance of 100 cm. Following irradiation, lymphocyte culture, har- vesting, staining, and scoring processes were performed accord- ing to the guidelines of the International Atomic Energy Agency (IAEA) [2]. Briefly, 1 mL blood from each dose-point was cul- tured for 48 hrs in a culture tube containing 9 mL of medium (RPMI-1640). Next, 80 μL of colcemid (10 μg/mL) were added to 10 mL of each culture (final concentration, 0.08 μg/mL) dur-
ing the final 24 hours of the culture period. Following hypotonic treatment with 0.075 M KCl, the cells were fixed in a 3:1 metha- nol-acetic acid solution. The cells were prepared on a slide, stained with Giemsa, and the number of DCs was scored per 1,000 meta- phases. Once more than 100 DCs were identified in samples above the 2 Gy dose-point, analysis was stopped, and the pro- portion per scored cells was calculated.
For the TR assay, samples were processed as described above, and metaphases were prepared on a slide using the same pro- tocol described for the DC assay. Two slides were prepared for each sample, and the TR assay was carried out with a mixture of commercially available fluorophore-labeled probes (chromo- some 1, red; chromosome 2, green; chromosome 4, yellow;
Metasystems, Altlussheim, Germany). The number of TRs was scored per 1,000 metaphases. The detailed scoring rules for exchange-type aberration were as follows: (1) only stable cells were counted, (2) TR between three chromosomes was scored as two TR equivalents, (3) inversion or insertion was scored as one TR equivalent, and (4) deletions were not included in the analyses.
Metaphases were captured using the Metafer Image Analysis System (Metasystems). Two investigators independently inter- preted the DC and TR results. Discordant interpretations were reanalyzed in several ways, including comparison of images and a final review by a third experienced investigator in the cytoge- netic laboratory.
Statistical analysis of the data used to generate the dose-re- sponse curves was conducted using R version 2.10.1 (R Foun- dation for Statistical Computing, Vienna, Austria) and the analy- sis scripts as mentioned in the IAEA guidelines [2]. To deter- mine whether the DC or TR frequency followed a Poisson distri- bution as expected for X-ray irradiation, the dispersion index (α2/ y) and the normalized unit of this index (u) were obtained for each dose. Pearson’s correlation was calculated between the delivered dose and chromosomal aberration frequency. P <0.05 was considered statistically significant.
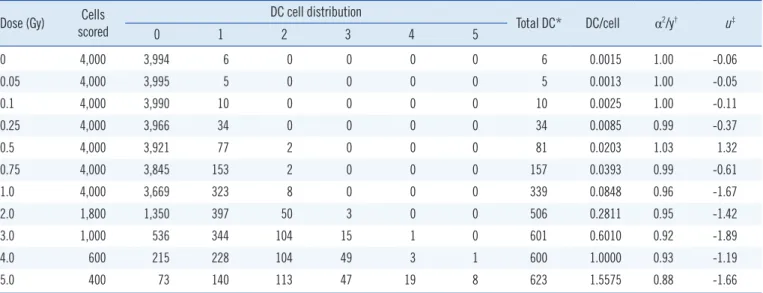
Following in vitro irradiation, a total of 31,800 and 31,725 metaphases were analyzed for DC and TR, respectively. The av- erage mitotic index was 24%, based on the equation described in the IAEA guidelines [2]. The DC and TR frequencies obtained following exposure to 11 different radiation doses are shown in Tables 1 and 2, respectively. The number of DC or TR increased with increasing radiation dose. The distribution of DC followed a Poisson distribution at all doses, whereas TR showed overdis- persion at the 5 Gy dose point (Table 2). The DC or TR yield was fitted using a linear-quadratic model represented by the follow-
ing equation: Y=C+αD+βD2, where Y is the DC or TR frequency yield, D is the absorbed dose in Gy, β is the corresponding qua- dratic coefficient, α is the linear coefficient, and C is the back- ground frequency. Dose-response curves for DC and TR induc- tion were derived as follows: Y =(0.0011 ±0.0004)+(0.0119 ± 0.0032)D+(0.0617±0.0019)D2 for DC, and Y=(0.0015±0.0004) +(0.0048±0.0024)D+(0.0237±0.0014)D2 for TR (Fig. 1). The correlation coefficient (r) was 0.971 for DC and 0.6 for TR, indi- cating very strong and moderate correlations, respectively, be-
tween the fitted data points [11]. The goodness of fit test for DC induction (chi-squared [χ2]=12.76, degrees of freedom=8, P <
0.05) and TR induction (χ2=4.76, degrees of freedom=8, P <0.05) indicated that the data fit well with the linear-quadratic model.
Unlike physical measurements routinely conducted for indi- viduals with occupational exposure, most people who are ex- posed during radiation emergencies do not carry personal do- simeters [7]. Therefore, biological dosimetry using chromosome damage is important not only to determine whether individuals Table 1. Distribution and frequencies of DCs in human peripheral blood lymphocytes following X-ray irradiation
Dose (Gy) Cells scored
DC cell distribution
Total DC* DC/cell α2/y† u‡
0 1 2 3 4 5
0 4,000 3,994 6 0 0 0 0 6 0.0015 1.00 -0.06
0.05 4,000 3,995 5 0 0 0 0 5 0.0013 1.00 -0.05
0.1 4,000 3,990 10 0 0 0 0 10 0.0025 1.00 -0.11
0.25 4,000 3,966 34 0 0 0 0 34 0.0085 0.99 -0.37
0.5 4,000 3,921 77 2 0 0 0 81 0.0203 1.03 1.32
0.75 4,000 3,845 153 2 0 0 0 157 0.0393 0.99 -0.61
1.0 4,000 3,669 323 8 0 0 0 339 0.0848 0.96 -1.67
2.0 1,800 1,350 397 50 3 0 0 506 0.2811 0.95 -1.42
3.0 1,000 536 344 104 15 1 0 601 0.6010 0.92 -1.89
4.0 600 215 228 104 49 3 1 600 1.0000 0.93 -1.19
5.0 400 73 140 113 47 19 8 623 1.5575 0.88 -1.66
*A tricentric chromosome was scored as two dicentric equivalents. Quadricentric chromosomes were not observed in this study; †α2/y indicates dispersion index (α, variance; y, mean); ‡A u-value between -1.96 and +1.96 indicates a Poisson distribution.
Abbreviation: DC, dicentric chromosome.
Table 2. Distribution and frequencies of chromosome TRs in human peripheral blood lymphocytes following X-ray irradiation Dose (Gy) Cells
scored
TR cell distribution
Total TRs* TR/cell α2/y† u‡
0 1 2 3 4 5
0 4,000 3,995 5 0 0 0 0 5 0.0013 1.00 -0.05
0.05 4,000 3,991 9 0 0 0 0 9 0.0023 1.02 0.45
0.1 4,000 3,990 10 0 0 0 0 10 0.0025 1.00 -0.11
0.25 4,000 3,985 15 0 0 0 0 15 0.0038 1.00 -0.16
0.5 4,000 3,964 36 0 0 0 0 36 0.0090 0.99 -0.40
0.75 4,000 3,934 66 0 0 0 0 66 0.0165 0.98 -0.73
1.0 4,000 3,865 133 2 0 0 0 137 0.0343 1.00 -0.22
2.0 1,975 1,773 193 9 0 0 0 211 0.1068 0.98 -0.66
3.0 1,135 906 208 20 1 0 0 251 0.2211 0.96 -0.88
4.0 416 270 126 19 1 0 0 167 0.4014 0.86 -1.96
5.0 199 99 78 21 1 0 0 123 0.6181 0.78 -2.24
*Translocation between three chromosomes was scored as two translocation equivalents; †α2/y indicates dispersion index (α, variance; y, mean); ‡A u-value between -1.96 and +1.96 indicates a Poisson distribution.
Abbreviation: TR, translocation.
have been over-exposed to radiation but also to consider indi- vidual differences in susceptibility [2].
We present two types of dose-response curves compatible with two methods: a DC assay for assessing the acute phase within two months of exposure [7] and chromosome painting TR analysis using three probes (one each for chromosome pairs 1, 2, and 4), which can estimate a radiation exposure dose re- ceived several years earlier [12]. A previous Japanese study demonstrated considerable variation between individuals in the frequency of chromosomal aberrations formed, especially at low doses of ≤1 Gy [13]. We included a total of seven points below 1 Gy in our study (0, 0.05, 0.1, 0.25, 0.5, 0.75, and 1); how- ever, no significant inter-individual differences were observed in
DC and TR frequency at these doses (See Supplemental Data Tables S1 and S2). In contrast, significant differences in DC fre- quency were observed at doses of 3 and 4 Gy (See Supplemen- tal Data Table S1). These variances are likely due to confound- ing individual factors such as age, smoking, and polymorphisms in DNA repair genes [8]. Thus, it is important to analyze a suffi- cient number of cells to reduce the influence of these factors; a number between 3,000 and 5,000 per point is suggested by the IAEA guidelines [2]. A limitation of this study is that it has not been performed on subjects of various ages.
Laboratories should have their own dose-response curves to avoid inter-laboratory variations [2, 8] as several factors are known to impact the resulting dose-response curves, including the in- Fig. 1. Dose-response calibration curves and metaphase images of chromosomal aberrations induced in human lymphocytes by X-ray ex- posure. (A and B) Dose response curves with the 95% confidence interval delimited by dotted lines. The black dots (●) denotes data points with standard errors of the mean. (A) Dicentric yields, Y=(0.0011±0.0004)+(0.0119±0.0032)D+(0.0617±0.0019)D2, where Y is the di- centric yield, and D is the absorbed dose in Gy. (B) Translocation of chromosomes 1, 2, and 4, Y=(0.0015±0.0004)+(0.0048±0.0024)D +(0.0237±0.0014)D2, where Y is the translocation yield and D is the absorbed dose in Gy. (C) Dicentric chromosomes and their respective fragments are marked with an arrows and arrowheads, respectively. (D) Metaphases with painted chromosomes—1 (red), 2 (green), and 4 (yellow)—and an apparent two-way translocation involving chromosomes 2 and 4 (arrows).
1.8 1.6 1.4 1.2 1.0 0.8 0.6 0.4 0.2 0
1 2 3 4 5 Dose (Gy)
Dicentrics per cell
Data Yield curve 95% confidence interval Standard errors of the mean A
C
0.8 0.7 0.6 0.5 0.4 0.3 0.2 0.1 0
1 2 3 4 5 Dose (Gy)
Translocations per cell
Data Yield curve 95% confidence interval Standard errors of the mean B
D
trinsic environmental conditions in each laboratory, choice of re- agents, technical procedures and equipment, scoring criteria, and the subjective nature of microscopic identification of chro- mosome aberrations [9, 14].
In order to approximate in vitro-generated calibration curves as close as possible to in vivo responses, it is important to gen- erate the curves using a wide range of potentially absorbed doses that represent the majority of accidental human exposure to ionizing radiation (0.1 to 5 Gy) [2, 9]. Since most radiological in- cidents involve overexposure to gamma-radiation or X-rays [2, 4, 15], curves for these two radiation sources should be preferen- tially established. In Korea, most dosimetry laboratories use 60Co as a radiation source for dosimetry calibration curves [5]. We used X-rays generated by electron LINACs, and this curve could aid in assessing workers’ radiation doses, radiation emergencies, and in vitro dose reconstruction for medical accidents caused by X-rays. This is the first study implementing cytogenetic dosime- try following exposure to ionizing X-radiation.
Authors’ Disclosures of Potential Conflicts of Interest
No potential conflicts of interest relevant to this article were re- ported.
Acknowledgment
This work was supported by the Soonchunhyang University Re- search Fund.
REFERENCES
1. Ricoul M, Gnana-Sekaran T, Piqueret-Stephan L, Sabatier L. Cytogenet-
ics for biological dosimetry. Methods Mol Biol 2017;1541:189-208.
2. International Atomic Energy Agency. Cytogenetic dosimetry: applications in preparedness for and response to radiation emergencies. Vienna: In- ternational Atomic Energy Agency Publishing, 2011:45-202.
3. Pinto MM, Santos NF, Amaral A. Current status of biodosimetry based on standard cytogenetic methods. Radiat Environ Biophys 2010;49:567- 81.
4. Cho MS, Lee JK, Bae KS, Han EA, Jang SJ, Ha WH, et al. Retrospective biodosimetry using translocation frequency in a stable cell of occupa- tionally exposed to ionizing radiation. J Radiat Res 2015;56:709-16.
5. Kang CM, Yun HJ, Kim H, Kim CS. Strong correlation among three bio- dosimetry techniques following exposures to ionizing radiation. Genome Integr 2016;7:11.
6. Ministry of Health and Welfare. http:// www.mohw.go.kr/react/jb/sjb0406 ls.jsp?PAR_MENU_ID=03&MENU_ID=030406 (Accessed on July 2018).
7. Romm H, Oestreicher U, Kulka U. Cytogenetic damage analysed by the dicentric assay. Ann Ist Super Sanita 2009;45:251-9.
8. Lee JK. Practical applications of cytogenetic biodosimetry in radiological emergencies. Korean J Hematol 2011;46:62-4.
9. Lemos-Pinto MM, Cadena M, Santos N, Fernandes TS, Borges E, Ama- ral A. A dose-response curve for biodosimetry from a 6 MV electron lin- ear accelerator. Braz J Med Biol Res 2015;48:908-14.
10. Healy BJ, van der Merwe D, Christaki KE, Meghzifene A. Cobalt-60 ma- chines and medical linear accelerators: competing technologies for ex- ternal beam radiotherapy. Clin Oncol (R Coll Radiol) 2017;29:110-5.
11. Mukaka MM. Statistics corner: A guide to appropriate use of correlation coefficient in medical research. Malawi Med J 2012;24:69-71.
12. Suto Y, Akiyama M, Noda T, Hirai M. Construction of a cytogenetic dose- response curve for low-dose range gamma-irradiation in human periph- eral blood lymphocytes using three-color FISH. Mutat Res Genet Toxicol Environ Mutagen 2015;794:32-8.
13. Abe Y, Yoshida MA, Fujioka K, Kurosu Y, Ujiie R, Yanagi A, et al. Dose- response curves for analyzing of dicentric chromosomes and chromo- some translocations following doses of 1000 mGy or less, based on irra- diated peripheral blood samples from five healthy individuals. J Radiat Res 2018;59:35-42.
14. Wilkins RC, Romm H, Kao TC, Awa AA, Yoshida MA, Livingston GK, et al. Interlaboratory comparison of the dicentric chromosome assay for radiation biodosimetry in mass casualty events. Radiat Res 2008;169:
551-60.
15. Ryu TH, Kim JH, Kim JK. Chromosomal aberrations in human periph- eral blood lymphocytes after exposure to ionizing radiation. Genome In- tegr 2016;7:5.
Supplemental Data Table S1. Frequencies of DCs following X-ray irradiation in four healthy Korean individuals Dose (Gy) Cells
scored
36-yr-old male 22-yr-old male 28-yr-old female 24-yr-old female Total DC DC/cell Total DC DC/cell Total DC DC/cell Total DC DC/cell P*
0 4,000 2 0.0020 1 0.0010 1 0.0010 2 0.0020 0.8802
0.05 4,000 2 0.0020 1 0.0010 1 0.0010 1 0.0010 0.8964
0.1 4,000 2 0.0020 3 0.0030 4 0.0040 1 0.0010 0.5703
0.25 4,000 11 0.0110 8 0.0080 9 0.0090 8 0.0080 0.8802
0.5 4,000 21 0.0210 21 0.0210 17 0.0170 22 0.0220 0.8638
0.75 4,000 36 0.0360 43 0.0430 42 0.0420 36 0.0360 0.7698
1.0 4,000 96 0.0960 76 0.0760 89 0.0890 78 0.0780 0.3286
2.0 1,800 123 0.2733 115 0.2556 137 0.3044 131 0.2911 0.3886
3.0 1,000 151 0.6040 136 0.5440 145 0.5800 169 0.6760 0.0211
4.0 600 143 0.9533 133 0.8867 185 1.2333 139 0.9267 0.0105
5.0 400 167 1.6700 155 1.5500 151 1.5100 150 1.5000 0.7602
*P represents the overall differences across four individuals, determined using the chi-square or Fisher’s exact test, as appropriate. Significant P values are in bold.
Abbreviation: DC, dicentric chromosome.
Supplemental Data Table S2. Frequencies of chromosome TR following X-ray irradiation in four healthy Korean individuals Dose (Gy) Cells
scored
36-yr-old male 22-yr-old male 28-yr-old female 24-yr-old female Total TR TR/cell Total TR TR/cell Total TR TR/cell Total TR TR/cell P*
0 4,000 3 0.0030 0 0.0000 0 0.0000 2 0.0020 0.1441
0.05 4,000 1 0.0010 3 0.0030 1 0.0010 4 0.0040 0.3901
0.1 4,000 3 0.0030 3 0.0030 1 0.0010 3 0.0030 0.7530
0.25 4,000 5 0.0050 2 0.0020 5 0.0050 3 0.0030 0.6128
0.5 4,000 9 0.0090 8 0.0080 9 0.0090 10 0.0100 0.9743
0.75 4,000 16 0.0160 13 0.0130 14 0.0140 23 0.0230 0.2886
1.0 4,000 41 0.0410 32 0.0320 33 0.0330 31 0.0310 0.5934
2.0 1,975 57 0.1166 44 0.0880 59 0.1214 51 0.1020 0.3143
3.0 1,135 67 0.2359 60 0.2020 62 0.2441 62 0.2067 0.5459
4.0 416 43 0.4175 42 0.3652 33 0.3882 49 0.4336 0.7315
5.0 199 33 0.6735 27 0.5400 26 0.6667 37 0.6066 0.5030
*P represents the overall differences across four individuals, determined using the chi-square or Fisher’s exact test, as appropriate.
Abbreviation: TR, translocation.