https://doi.org/10.4174/astr.2020.99.1.52 Annals of Surgical Treatment and Research
Perioperative risk factors of progressive chronic kidney disease following liver transplantation: analyses of a 10-year follow-up single-center cohort
Kyungho Lee1, Junseok Jeon1, Jong Man Kim2, Gaabsoo Kim3, Kyunga Kim4, Hye Ryoun Jang1, Jung Eun Lee1, Jae-Won Joh2, Suk-Koo Lee2, Wooseong Huh1
1Division of Nephrology, Department of Medicine, Samsung Medical Center, Sungkyunkwan University School of Medicine, Seoul, Korea
2Department of Surgery, Samsung Medical Center, Sungkyunkwan University School of Medicine, Seoul, Korea
3Department of Anesthesiology and Pain Medicine, Samsung Medical Center, Sungkyunkwan University School of Medicine, Seoul, Korea
4Statistics and Data Center, Research Institute for Future Medicine, Samsung Medical Center, Seoul, Korea
INTRODUCTION
The incidences of acute kidney injury (AKI) and AKI requiring
renal replacement therapy post liver transplantation (LT) are common as 41% and 7%, respectively [1]. Because of improved survival of recipients after LT, the prevalence of chronic kidney
Received January 10, 2020, Revised March 28, 2020, Accepted April 28, 2020
Corresponding Author: Wooseong Huh
Division of Nephrology, Department of Medicine, Samsung Medical Center, Sungkyunkwan University School of Medicine, 81, Irwon-ro, Gangnam-gu, Seoul 06351, Korea
Tel: +82-2-3410-3443, Fax: +82-2-3410-0064 E-mail: [email protected] ORCID: https://orcid.org/0000-0001-8174-5028
Copyright ⓒ 2020, the Korean Surgical Society
cc Annals of Surgical Treatment and Research is an Open Access Journal. All articles are distributed under the terms of the Creative Commons Attribution Non- Commercial License (http://creativecommons.org/licenses/by-nc/4.0/) which permits unrestricted non-commercial use, distribution, and reproduction in any medium, provided the original work is properly cited.
Purpose: The incidence of chronic kidney disease (CKD) has been increasing due to improved survival after liver transplantation (LT). Risk factors of kidney injury after LT, especially perioperative management factors, are potentially modifiable. We investigated the risk factors associated with progressive CKD for 10 years after LT.
Methods: This retrospective cohort study included 292 adult patients who underwent LT at a tertiary referral hospital between 2000 and 2008. Renal function was assessed by the e stimated glomerular filtration rate (eGFR) using the Modification of Diet in Renal Disease formula. The area under the curve of serial eGFR (AUCeGFR) was calculated for each patient to assess the trajectory of eGFR over the 10 years. Low AUCeGFR was considered progressive CKD. Linear regression analyses were performed to examine the associations between the variables and AUCeGFR.
Results: Multivariable analysis showed that older age (regression coefficient = -0.53, P < 0.001), diabetes mellitus (DM) (regression coefficient = -6.93, P = 0.007), preoperative proteinuria (regression coefficient = -16.11, P < 0.001), preoperative acute kidney injury (AKI) (regression coefficient = -14.35, P < 0.001), postoperative AKI (regression coefficient = -3.86, P = 0.007), and postoperative mean vasopressor score (regression coefficient = -0.45, P = 0.034) were independently associated with progressive CKD.
Conclusion: More careful renoprotective management is required in elderly LT patients with DM or preexisting proteinuria.
Postoperative AKI and vasopressor dose may be potentially modifiable risk factors for progressive CKD.
[Ann Surg Treat Res 2020;99(1):52-62]
Key Words: Renal insufficiency, Kidney failure, Liver transplantation, Risk factors
disease (CKD) after LT has been increasing. Significant CKD occurs in up to 25% of patients after LT [2,3]. In addition, posttransplantation CKD is independently associated with high mortality and morbidity, which has elicited concerns in posttransplantation management. Prevention of renal injury has emerged as a priority for transplant physicians [2-4].
Although studies have reported the risk factors for renal injury after LT, most have dealt with reversible AKI rather than irreversible, progressive CKD, a sustained decline in estimated glomerular filtration rate (eGFR) over long-term follow-up [5,6]. Moreover, there have been conflicting results of direct association between perioperative AKI and post-LT CKD [7,8].
To date, only a limited number of studies has evaluated post- LT long-term renal outcome, which has important implications for patient management. The etiology of AKI after LT can be multifactorial in origin. Perioperative factors such as hemodynamics, intraoperative blood loss, administered dose of vasopressors, and amount of blood products transfused may affect posttransplantation renal function [9,10]. If these causes are shown to affect long-term renal outcomes, they could be more important for clinicians than other factors because they are thought to be correctable by modification of perioperative patient care.
The purpose of this study was to evaluate the risk factors associated with progressive CKD in LT recipients with a focus on perioperative variables. We analyzed an association between a variety of demographic, clinical, and laboratory variables and area under the curve of serial eGFR (AUCeGFR) with 10-year follow-up longitudinal data of renal function.
METHODS
Study population
This retrospective cohort study was performed at Samsung Medical Center, Seoul, Korea. The study protocol conformed to the ethical guidelines of the 1975 Declaration of Helsinki as reflected in the priori approval by Samsung Medical Center, Institutional Review Board (No . IRB2014-12-115). All adult (the age of 18 or more) patients who underwent deceased donor or living donor LT due to parenchymal liver disease without malignancy between January 2000 and December 2008 with follow-up data available before December 2018 were screened for inclusion. This period was chosen as a period of relevant clinical practice experience and to ensure that 10-year follow-up information would be complete for all patients. The exclusion criteria were as follows: (1) patients who underwent LT twice or more (retransplantation); (2) simultaneous liver-kidney transplant recipients (criteria for simultaneous liver-kidney transplantation was end-stage renal disease [ESRD] on dialysis or eGFR < 30 mL/min/1.73 m2 for at least 12 weeks); (3) patients with a survival or follow-up of 6 months or less.
Data collection
Serum creatinine concentrations from the time of transplan- tation until 10 years after LT, death, or dialysis or kidney transplantation were collected. Assessment of kidney function was based on the eGFR using the Modification of Diet in Renal Disease 4-variable formula [11].
The Acute Kidney Injury Network criteria were used to define perioperative acute renal dysfunction [12]. “Stage 1” was defined as an increase of creatinine by ≥ 0.3 mg/dL or 1.5–1.9 times,
“stage 2” as an increase of creatinine 2.0–2.9 times, and “stage 3”
as an increase 3 times.
Patients’ final renal function was classified according to the Kidney Disease Outcomes Quality Initiative (KDOQI) of the National Kidney Foundation CKD classification [13]: CKD stage 1 (eGFR ≥ 90 mL/min/1.73 m2), CKD stage 2 (eGFR 60-89 mL/
min/1.73 m2), CKD stage 3 (eGFR 30–59 mL/min/1.73 m2), CKD stage 4 (eGFR 15–29 mL/min/1.73 m2), and CKD stage 5 (eGFR <
15 mL/min/1.73 m2).
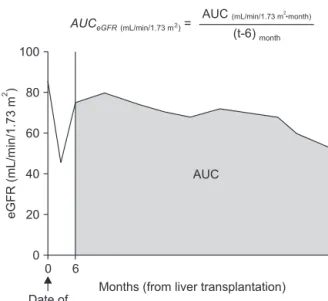
The multiple eGFR values for individual patients during the follow-up period were combined into a single index for statistical analysis. We used the calculated area under the curve of serial eGFR (AUCeGFR) value as an index of long-term renal function after LT. The initial 6 months after LT were excluded from calculation because there were many episodes of reversible
0 t
eGFR(mL/min/1.73m)2
Months (from liver transplantation) 100
80
60
40
20
0 6
AUC
Date of transplantation
AUC = AUC
(t-6)
Fig. 1. An example of serial changes in eGFR after trans- plantation and calculation of AUCeGFR. Month 0 corresponds to the time of transplantation. The initial 6 months following transplantation were excluded from AUC calculation. AUC was divided by individual follow-up duration (t). In patients who died or were lost to follow-up within 10 years, “t”
corresponds to survival duration or follow-up duration, respectively. In other cases (patients who survived 10 years or more after transplantation with complete follow-up), “t”
corresponds to 120 (months). AUC, area under the curve;
eGFR, estimated glomerular filtration rate.
AKI, and serum creatinine concentration in that period is known to be an inaccurate representation of renal function because of the severely reduced muscle mass related to liver dysfunction. Because not all patients survived until the end of the 10-year follow-up, the AUCeGFR was adjusted to account for individual survival durations. An example calculation of the AUCeGFR is illustrated in Fig. 1. The average number of creatinine values used to calculate AUCeGFR for each patient was 18.6.
The etiology of liver disease, episodes of AKI, diagnosis of diabetes mellitus and hypertension, prothrombin time expressed as international normalized ratio (INR), and model for end-stage liver disease (MELD) score were recorded as potential pretransplantation risk factors for deterioration of long-term renal function. Pretransplantation CKD was defined as eGFR < 60 mL/min/1.73 m2 (CKD stage 3 or greater) with a duration of more than 3 months.
The following intraoperative risk factors were recorded:
hemodynamics (baseline blood pressure, lowest blood pressure, and duration of hypotension including intraoperative cardiac arrest); amount of blood loss; amount of blood products transfused (RBCs, fresh frozen plasma [FFP], platelet concentrate, cryoprecipitate, and cell salvaged blood); and dose of administered vasopressors. Intraoperative hypotension was defined as systolic blood pressure (SBP) <80 mmHg. To estimate intraoperative blood loss, we calculated lost red cell mass (in mL) using the equation described by Bang et al [14].
Vasopressor requirements were measured using the following equation : Vasopressor score = (dopamine dose [g/kg/min] × 1) + (dobutamine dose [g/kg/min] × 1) + (epinephrine dose [g/
kg/min] × 100) + (norepinephrine dose [g/kg/min] × 100) + phenylephrine dose [g/kg/min] × 100) [15].
The following postoperative variables were recorded: dose of vasopressors administered within postoperative 36 hours, the highest AST concentration within postoperative 72 hours, the highest creatinine concentration within postoperative 3 days for assessment of postoperative AKI, presence of renal-replacement therapy, the occurrence of early allograft dysfunction (defined as the presence of 1 or more of 3 variables, including a peak serum AST or alanine aminotransferase concentration higher than 2,000 U/L within first 7 postoperative days, a serum bilirubin concentration of 10 mg/dL or higher on postoperative day 7, and an INR of 1.7 or higher on postoperative day 7 [16]), use of nephrotoxic antimicrobial agents (defined as the administration of one of the following antimicrobial agents for 7 days or more within postoperative 30 days; aminoglycosides, vancomycin, teicoplanin, colistin, ganciclovir, acyclovir, and amphotericin B). Immunosuppressive regimens and trough concentrations for individual patients were also recorded.
Donor data, including donor type (deceased donor or living donor), donor age, donor body mass index, cold ischemic time, warm ischemic time, and fatty change rates, were recorded and
analyzed.
Intraoperative patient care
Intraoperative fluid therapy consisting of crystalloids and 5%
albumin was administered as determined appropriate by the anesthesiologist. The transfusion and coagulation management guidelines at our institution were as follows. The hemoglobin concentration was maintained at >8 g/dL. Two units of FFP were administered if the PT INR was >3.0. Three hundred milliliters of platelets were administered for patients with a platelet count <30,000/μL. Cryoprecipitate was administered as either 1,200 or 2,400 mL if the serum fibrinogen concentration was <80 mg/dL coupled with a platelet count of either >50,000 or <50,000/μL, respectively. The intraoperative vasopressors used during the study period were phenylephrine, ephedrine, epinephrine, norepinephrine, dopamine, and vasopressin. The vasopressor was given as a single agent or in combination and as either a bolus or continuous infusion. Inferior v ena cava was partially clamped during the living donor LT. Anastomosis of the liver graft was performed with a piggyback technique without a venovenous bypass in deceased donor LT. Histidine–
tryptophan–ketoglutarate solution was used as the liver preservation solution.
Immunosuppression
Basiliximab was used for induction therapy. A standardized maintenance immunosuppression protocol including calcineurin inhibitors, steroid, and mycophenolate mofetil was initiated within 24 hours of transplantation. The choice of calcineurin inhibitor between cyclosporine and tacrolimus was determined by a transplantation team. In cases receiving a cyclosporine-based regimen, cyclosporine was administered to an intended trough level of 250–300 ng/mL during the first week after transplantation, 200–250 ng/mL during the next 3 weeks, 150–200 ng/mL during the next 2 months, and 100–150 ng/mL thereafter. In cases receiving a tacrolimus- based regimen, tacrolimus was administered to an intended trough level of 12–15 ng/mL during the first 2 weeks after transplantation, 10–12 ng/mL during the next 2 weeks, 8–10 ng/mL for the next 2 months, and 5–8 ng/mL thereafter.
Intravenous methylprednisolone 500 mg was administered during anhepatic phase and tapered gradually during 7 days.
Steroid was gradually withdrawn in most patients by 3 months after LT if liver function is stable.
Statistical analyses
The categorical variables are presented as percentage, and the quantitative variables are presented as mean ± standard deviation. All analyses were performed using SAS ver. 9.4 (SAS Institute Inc., Cary, NC, USA) and R (3.1.0; Vienna, Austria; http://www.R-project.org) software. The Jonckheere-
Terpstra test was performed to examine trends between the posttransplantation final CKD status and AUGeGFR.
For risk factor analysis, linear regression analyses were performed to examine the associations between target variables (possible risk factors) and AUCeGFR. Potential significant variables (P < 0.2) in the univariable analysis were chosen for multivariable analysis. The final multivariable model was fitted using the stepwise method with = 0.1 for both insertion and deletion.
To provide a sensitivity analysis of AUCeGFR, logistic regression analysis for CKD upstaging and development of ESRD during 10-years of follow-up was performed.
Regression estimates and P-values are reported for the multivariable analysis. Statistical significance was defined as a 2-sided P-value < 0.05. The STROBE (Strengthening the Reporting of Observational Studies in Epidemiology) guidelines were used to ensure the reporting of this observational study [17].
RESULTS
A total of 348 patients who underwent LT were evaluated for inclusion. Of these, 56 patients were excluded: 19 underwent retransplantation, 2 received simultaneous liver–kidney transplantation, and 35 died within 6 months after LT. The final cohort was comprised of 292 patients (Fig. 2), among whom 47 died and 245 survived during the 10-year follow-
up period, giving a 10-year survival rate after LT of 84%. The median follow-up period was 10 years (interquartile range, 10-10). Of the 292 patients, 74 (25%) finally had CKD stage 1, 138 (47%) had CKD stage 2, 51 (17%) had stage 3, 7 (2%) had stage 4, and 22 (8%) had stage 5. To determine if AUCeGFR was significantly associated with CKD stage, we reclassified the 5 groups according to KDOQI CKD classification into 3 groups (CKD stage 1 + stage 2, CKD stage 3, CKD stage 4 + stage 5) and analyzed trends. AUCeGFR significantly decreased with CKD
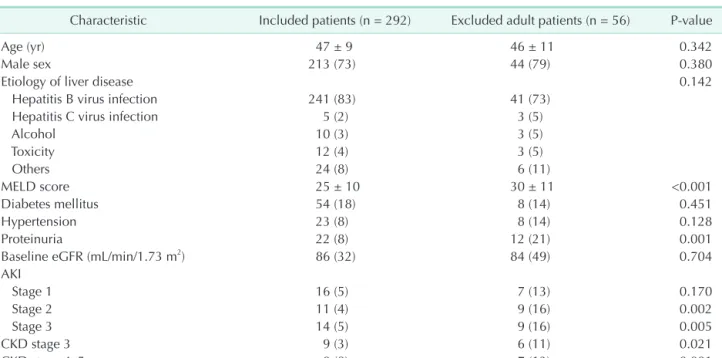
Table 1. Baseline characteristics (before transplantation) of liver transplant recipients
Characteristic Included patients (n = 292) Excluded adult patients (n = 56) P-value
Age (yr) 47 ± 9 46 ± 11 0.342
Male sex 213 (73) 44 (79) 0.380
Etiology of liver disease 0.142
Hepatitis B virus infection 241 (83) 41 (73)
Hepatitis C virus infection 5 (2) 3 (5)
Alcohol 10 (3) 3 (5)
Toxicity 12 (4) 3 (5)
Others 24 (8) 6 (11)
MELD score 25 ± 10 30 ± 11 <0.001
Diabetes mellitus 54 (18) 8 (14) 0.451
Hypertension 23 (8) 8 (14) 0.128
Proteinuria 22 (8) 12 (21) 0.001
Baseline eGFR (mL/min/1.73 m2) 86 (32) 84 (49) 0.704
AKI
Stage 1 16 (5) 7 (13) 0.170
Stage 2 11 (4) 9 (16) 0.002
Stage 3 14 (5) 9 (16) 0.005
CKD stage 3 9 (3) 6 (11) 0.021
CKD stage 4–5 0 (0) 7 (13) <0.001
Values are presented as mean ± standard deviation or number (%).
MELD, model of end-stage liver disease; eGFR, estimated glomerular filtrate rate; AKI, acute kidney injury; CKD, chronic kidney disease.
452 Liver transplantation during January 2000 December 2008
n = 348
n = 327
n = 292
104 Pediatric liver transplantation
Simultaneous liver-kidney 2 Transplantation 19 Re-transplantation
35 Died within 6 months
Fig. 2. The flow of study cohort.
progression (CKD stage 1 + stage 2, 79.6 ± 15.1, 95% confidence interval [CI], 77.6–81.6; CKD stage 3, 54.8 ± 12.6, 95% CI, 51.3–
58.3; CKD stage 4 + stage 5, 37.0 ± 18.9, 95% CI, 30.1–43.9; P <
0.001 for trend.).
The average age at the time of LT was 47 ± 9 years.
Coexisting conditions were present before LT in some patients;
these included hypertension (n = 23, 8%) and diabetes mellitus (n = 54, 18%). The most common etiology of underlying liver disease was chronic hepatitis B (n = 241, 83%). The mean MELD score was 25 ± 10. Pretransplantation AKI was present in 41 patients (14%), and CKD was present 9 (3%) of patients. All of CKD patients were CKD stage 3, and there were no patients with CKD stage 4–5. Cyclosporine was administered in 39 patients (13%), and tacrolimus was administered in 253 patients (87%). The baseline characteristics and comparison between included and excluded patients are summarized in Table 1.
Univariable analyses of the preoperative variables of progressive CKD after LT showed older age (P < 0.001), diabetes mellitus (P < 0.001), hypertension (P = 0.020), proteinuria (P < 0.001), pretransplantation AKI (P = 0.009), and pretransplantation CKD (P < 0.001) were associated with a low AUCeGFR during the follow-up period (Table 2). Among the intraoperative variables, mean vasopressor score (P = 0.001), and maximum vasopressor score (P = 0.040) correlated negatively with AUCeGFR (Table 2). Administration of higher dosage vasopressor during postoperative 36 hours (P = 0.003), perioperative continuous renal replacement therapy (P < 0.001), postoperative AKI within 3 days (P < 0.014), and administration of nephrotoxic antimicrobial agents (P = 0.023) were significantly related to low AUCeGFR (Table 2). LT from a deceased donor was associated with low AUCeGFR (P = 0.047) (Table 3).
The multivariable linear regression analysis identified older age (regression coefficient = -0.53, P < 0.001), diabetes mellitus (regression coefficient = -6.93, P = 0.007), pretransplantation proteinuria (regression coefficient = -16.11, P < 0.001), pretransplantation AKI (regression coefficient = -14.35, P <
0.001), pretransplantation CKD (regression coefficient = -29.36, P < 0.001), postoperative mean vasopressor score (regression coefficient = -0.45, P = 0.034) during the first 72 hours after LT, and postoperative AKI (regression coefficient = -3.86, P = 0.007) as significant predictors of progressive CKD (Table 4). Further analysis of subgroups of patients without pretransplantation AKI nor CKD (n = 242) did not alter the significant risk factors (Table 4).
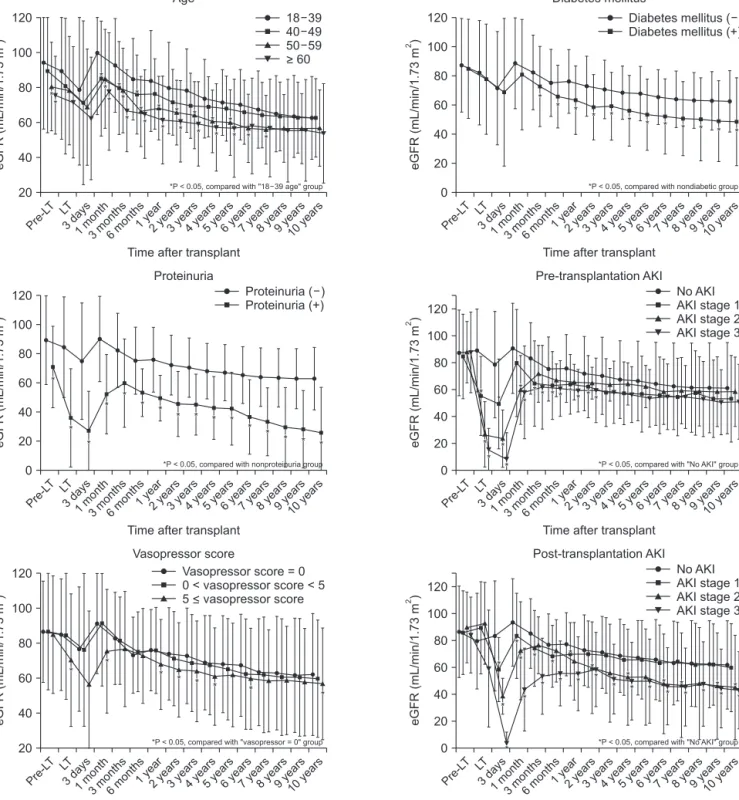
Time-dependent change in eGFR according to the significant risk factors in the multivariable analysis were presented in Fig. 3.
The steep declines in eGFR during the first 3 days after LT were noted because of postoperative AKI. Subsequently, steep rises of eGFR were observed due to the recovery of renal function. After 6 months from LT, eGFR trajectories achieve stabilities and
highlight progressive declines with distinct degrees according to the risk factors described above.
The multivariable logistic regression analysis for CKD upstaging during the 10 years of follow-up showed that diabetes mellitus (odds ratio [OR], 7.65; 95% CI, 2.81–20.85;
P < 0.001), postoperative mean vasopressor score (OR, 1.14;
95% CI, 1.00–1.30; P = 0.049), perioperative continuous renal- replacement therapy (OR, 13.70; 95% CI, 1.92–97.84; P = 0.009), and postoperative AKI (stage 1: OR, 4.72; 95% CI, 1.50–14.81; P
= 0.008; stage 2: OR, 7.69; 95% CI, 1.51–39.27; P = 0.014; stage 3:
OR, 19.63; 95% CI, 1.35–285.05; P = 0.029) were significant risk factors.
ESRD was occurred 17 of 292 patients during the 10-year follow-up. Proteinuria (OR, 6.57; 95% CI, 1.81–23.86; P < 0.001) and postoperative mean vasopressor score (OR, 1.08; 95% CI, = 1.00–1.15) were significantly associated with development of ESRD in the multivariable logistic regression analysis.
DISCUSSION
This cohort study including 292 consecutive LT recipients with 10-year follow-up data was performed to identify the risk factors for progressive CKD following LT. Factors associated with progressive CKD were recipient age, diabetes mellitus, pretransplantation proteinuria, pretransplantation renal dysfunction, postoperative AKI, and higher dose of vasopressor use immediately after the operation.
Many previous studies have addressed the burden of post- LT renal failure, most of which focused on postoperative AKI rather than CKD [5,6]. Although there have been several studies evaluating long-term renal outcome after LT [3,8], the follow-up period was usually less than 5 years. Our study is the only one to report predictors of 10-year renal outcome in LT recipients. Furthermore, there have been few studies dealing with perioperative risk factors, especially for CKD. Both intraoperative and immediate postoperative hemodynamic data including blood pressure, administered dose of vasopressor, amount of blood loss, and transfused amount of blood products were analyzed.
The development of CKD can be used as a clinical end point of renal outcome measurement. However, this requires longer follow-up duration and larger sample size. The number of patients who progressed to clinically relevant CKD (eGFR
< 30 mL/min/m2) was 29, which was only 10% of our study population. Also, using only eGFR measures at the end of the follow-up period to define renal outcome would misclassify patients who experienced AKI long after the LT as progressive CKD. In such cases, it would be difficult to establish a direct causal relationship between renal outcome and perioperative events. Thus, we used an alternative eGFR-based single continuous variable, AUCeGFR, as an outcome parameter.
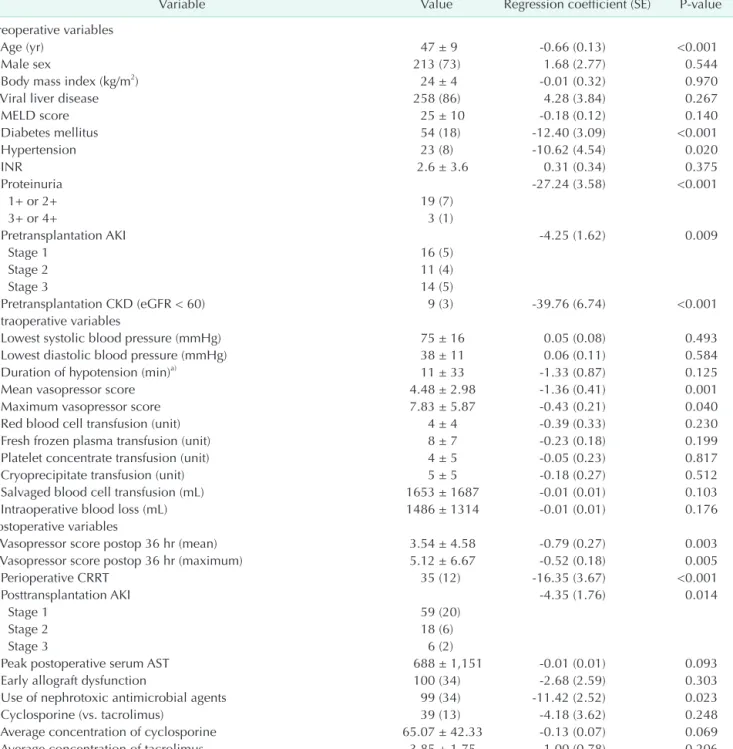
Table 2. Univariable linear regression analysis of perioperative variables associated with AUCeGFR following liver transplantation (n = 292)
Variable Value Regression coefficient (SE) P-value
Preoperative variables
Age (yr) 47 ± 9 -0.66 (0.13) <0.001
Male sex 213 (73) 1.68 (2.77) 0.544
Body mass index (kg/m2) 24 ± 4 -0.01 (0.32) 0.970
Viral liver disease 258 (86) 4.28 (3.84) 0.267
MELD score 25 ± 10 -0.18 (0.12) 0.140
Diabetes mellitus 54 (18) -12.40 (3.09) <0.001
Hypertension 23 (8) -10.62 (4.54) 0.020
INR 2.6 ± 3.6 0.31 (0.34) 0.375
Proteinuria -27.24 (3.58) <0.001
1+ or 2+ 19 (7)
3+ or 4+ 3 (1)
Pretransplantation AKI -4.25 (1.62) 0.009
Stage 1 16 (5)
Stage 2 11 (4)
Stage 3 14 (5)
Pretransplantation CKD (eGFR < 60) 9 (3) -39.76 (6.74) <0.001
Intraoperative variables
Lowest systolic blood pressure (mmHg) 75 ± 16 0.05 (0.08) 0.493
Lowest diastolic blood pressure (mmHg) 38 ± 11 0.06 (0.11) 0.584
Duration of hypotension (min)a) 11 ± 33 -1.33 (0.87) 0.125
Mean vasopressor score 4.48 ± 2.98 -1.36 (0.41) 0.001
Maximum vasopressor score 7.83 ± 5.87 -0.43 (0.21) 0.040
Red blood cell transfusion (unit) 4 ± 4 -0.39 (0.33) 0.230
Fresh frozen plasma transfusion (unit) 8 ± 7 -0.23 (0.18) 0.199
Platelet concentrate transfusion (unit) 4 ± 5 -0.05 (0.23) 0.817
Cryoprecipitate transfusion (unit) 5 ± 5 -0.18 (0.27) 0.512
Salvaged blood cell transfusion (mL) 1653 ± 1687 -0.01 (0.01) 0.103
Intraoperative blood loss (mL) 1486 ± 1314 -0.01 (0.01) 0.176
Postoperative variables
Vasopressor score postop 36 hr (mean) 3.54 ± 4.58 -0.79 (0.27) 0.003
Vasopressor score postop 36 hr (maximum) 5.12 ± 6.67 -0.52 (0.18) 0.005
Perioperative CRRT 35 (12) -16.35 (3.67) <0.001
Posttransplantation AKI -4.35 (1.76) 0.014
Stage 1 59 (20)
Stage 2 18 (6)
Stage 3 6 (2)
Peak postoperative serum AST 688 ± 1,151 -0.01 (0.01) 0.093
Early allograft dysfunction 100 (34) -2.68 (2.59) 0.303
Use of nephrotoxic antimicrobial agents 99 (34) -11.42 (2.52) 0.023
Cyclosporine (vs. tacrolimus) 39 (13) -4.18 (3.62) 0.248
Average concentration of cyclosporine 65.07 ± 42.33 -0.13 (0.07) 0.069
Average concentration of tacrolimus 3.85 ± 1.75 1.00 (0.78) 0.206
Values are presented as mean ± standard deviation or number (%) unless otherwise indicated.
AUCeGFR, under the curve of serial eGFR; SE, standard error; MELD, model of end-stage liver disease; INR, international normalized ratio; AKI, acute kidney injury; CKD, chronic kidney disease; eGFR, estimated glomerular filtration rate; postop, postoperative; CRRT, continuous renal-replacement therapy.
a)Hypotension was defined as systolic blood pressure <80 mmHg.
The vasopressor score was the sum of all vasopressors administered during the operation, as described by Zuppa et al. [15].
Acute Kidney Injury Network (AKIN) criteria were used to define acute renal dysfunction. “Stage 1” was defined as an increase of creatinine 1.5–1.9 times, “stage 2” as an increase of creatinine 2.0–2.9 times, and “stage 3” as an increase 3 times or more in the first 3 days after LT compared with pre-LT level.
Early allograft dysfunction was defined as the presence of 1 or more of the following: (1) a peak serum AST or alanine aminotransferase concentration higher than 2,000 U/L within first 7 postoperative days, (2) a serum bilirubin concentration of 10 mg/dL or higher on postoperative day 7, and (3) an INR of 1.7 or higher on postoperative day 7.
Us e of nephrotoxic antimicrobial agents defined as administration of one of the following antimicrobial agents for 7 days or more, postoperatively; aminoglycosides, vancomycin, teicoplanin, colistin, ganciclovir, acyclovir, and amphotericin B.
The AUCeGFR was calculated as a metric of GFR decline with longitudinal serum creatinine data. AUCeGFR can represent long-term renal function in a simple way and has been used in other clinical studies [18,19]. We further analyzed AUCeGFR trends according to final CKD stages, and there was significant statistical correlation, which indicates AUCeGFR could be a surrogate marker for CKD progression. Some previous studies have used absolute GFR decrease or absolute serum creatinine threshold [3,8]. However, this is not the optimal method for assessing renal function because the time course of eGFR during follow-up in this population is unstable and non-linear.
Furthermore, measuring renal function based on a single first and single last eGFR measurement could be less precise than alternative designs in which multiple measures are performed [20].
Similar to the findings from the general population, proteinuria and diabetes were associated with progressive
CKD [21]. Preexisting proteinuria and diabetes were present in 8% and 18% of patients in our study. Moreover, considering the high prevalence of viral hepatitis, HBV- or HCV- related glomerulonephritis, which is associated with poor renal outcome, may exist among proteinuric patients. Therefore, routine pretransplantation screening for proteinuria and diabetes could be an appropriate first step for assessing risk of post-LT CKD.
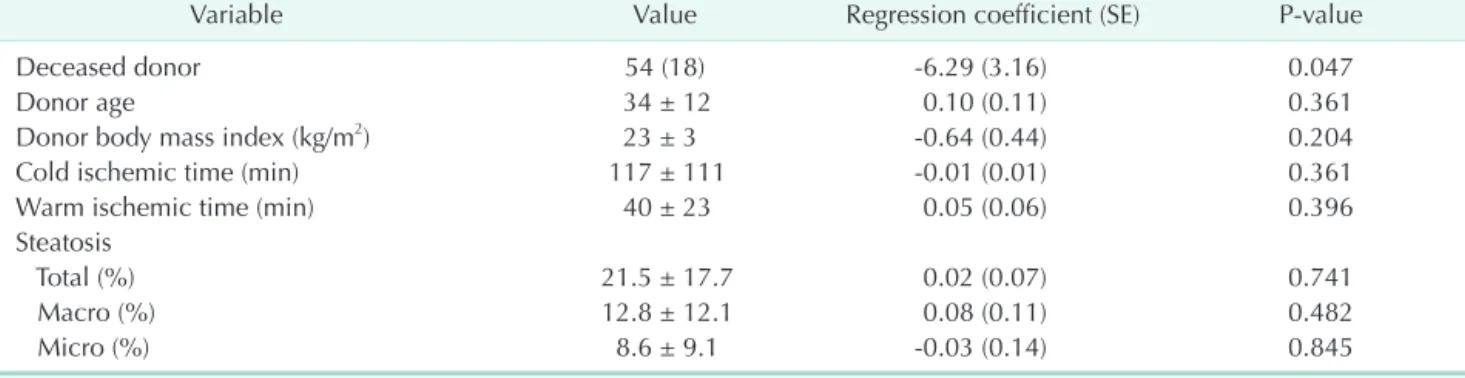
Importantly, we found that post-LT AKI was a strong predictor of progressive CKD. However, the causal relationship between AKI and CKD in post-LT patients or in general has been debated [8,22]. In vitro studies have demonstrated a prolonged inflammatory and remodeling response in renal tissues following a transient insult, providing a biological basis for transition from AKI to CKD [23,24]. However, among patients with post-LT AKI, reversible episodes of AKIs account for a large proportion [25]. These milder reversible cases cannot Table 3. Univariable linear regression analysis of donor variables associated with AUCeGFR following liver transplantation (n
= 292)
Variable Value Regression coefficient (SE) P-value
Deceased donor 54 (18) -6.29 (3.16) 0.047
Donor age 34 ± 12 0.10 (0.11) 0.361
Donor body mass index (kg/m2) 23 ± 3 -0.64 (0.44) 0.204
Cold ischemic time (min) 117 ± 111 -0.01 (0.01) 0.361
Warm ischemic time (min) 40 ± 23 0.05 (0.06) 0.396
Steatosis
Total (%) 21.5 ± 17.7 0.02 (0.07) 0.741
Macro (%) 12.8 ± 12.1 0.08 (0.11) 0.482
Micro (%) 8.6 ± 9.1 -0.03 (0.14) 0.845
Values are presented as number (%) or mean ± standard deviation unless otherwise indicated.
AUCeGFR, under the curve of serial estimated glomerular filtration rate (eGFR); SE, standard error.
Table 4. Multivariable stepwise regression analysis of variables associated with AUCeGFR following liver transplantation
Variable Regression coefficient (SE) P-value
Older age -0.53 (0.11) <0.001
Diabetes mellitus -6.93 (2.55) 0.007
Pretransplantation proteinuria -16.11 (3.46) <0.001
Pretransplantation AKI -14.35 (2.41) <0.001
Pretransplantation CKD -29.36 (6.05) <0.001
Vasopressor score postop 36 hr (mean) -0.45 (0.21) 0.034
Postoperative AKI -3.86 (1.42) 0.007
Subgroup analysis of patients without preoperative AKI nor CKD (n = 242)
Older age -0.61 (0.12) <0.001
Diabetes mellitus -7.64 (2.85) 0.008
Pretransplantation proteinuria -27.16 (4.83) <0.001
Vasopressor score postop 36 hr (mean) -0.34 (0.19) 0.048
Postoperative AKI -4.56 (1.15) <0.001
Variables with P-value <0.2 in univariable analysis were entered into the multivariable stepwise regression analysis.
AUCeGFR, under the curve of serial estimated glomerular filtration rate (eGFR); SE, standard error; AKI, acute kidney injury; CKD, chronic kidney disease.
be explained by the aforementioned theory. Recently, there has been increasing recognition that even patients with complete recovery from AKI remain at risk for progressive CKD [26]. In these cases, AKI serves as a “failed renal stress test” rather than a causative factor in the development of CKD [27]. Regardless of
the nature of the relationship between AKI and CKD, patients who experienced the AKI could be recognized as high-risk patients for CKD. Our results support the need for regular follow-up of patients who experienced AKI during admission for transplantation in the period following discharge for earlier
Pre-L T
eGFR(mL/min/1.73m)2
Time after transplant 120
100
80
60
40
20 LT
3days 1month
3months 6months1year
2years 3years
4years 5years
6years 7years
8years 9years
10 years 18 39 40 49 50 59
> 60
****
**
**
**
**
**
**
**
**
**
**
**
**
**
**
**
**
**
**
** ** **
*P < 0.05, compared with "18 39 age" group
Age
Pre-L T
eGFR(mL/min/1.73m)2
Time after transplant 120
100 80 60 40
0 LT
3days 1month
3months 6months1year
2years 3years
4years 5years
6years 7years
8years 9years
10 years Diabetes mellitus ( ) Diabetes mellitus (+)
*P < 0.05, compared with nondiabetic group
Diabetes mellitus
** ** **
** ** ** ** ** ** ** ** **
Pre-L T
eGFR(mL/min/1.73m)2
Time after transplant 120
100 80 60 40
0 LT
3days 1month
3months 6months1year
2years 3years
4years 5years
6years 7years
8years 9years
10 years No AKI AKI stage 1 AKI stage 2 AKI stage 3
** **
** ** ** **
*P < 0.05, compared with "No AKI" group
Pre-transplantation AKI
Pre-L T
eGFR(mL/min/1.73m)2
Time after transplant 120
100
80
60
40
20 LT
3days 1month
3months 6months1year
2years 3years
4years 5years
6years 7years
8years 9years
10 years
*P < 0.05, compared with "vasopressor = 0" group
Vasopressor score Pre-L
T
eGFR(mL/min/1.73m)2
Time after transplant 120
100 80 60 40
0 LT
3days 1month
3months 6months1year
2years 3years
4years 5years
6years 7years
8years 9years
10 years Proteinuria ( ) (+) Proteinuria
*P < 0.05, compared with nonproteinuria group
Proteinuria
** ** **
** ** ** **
** ** ** ** **
**
**
**
**
20 20
20
**
**
**
**
* ** ** ** ** **
Vasopressor score = 0 0 < vasopressor score < 5 5 < vasopressor score
Pre-L T
eGFR(mL/min/1.73m)2
Time after transplant 120
100 80 60 40
0 LT
3days 1month
3months 6months1year
2years 3years
4years 5years
6years 7years
8years 9years
10 years No AKI AKI stage 1 AKI stage 2 AKI stage 3
**
**
**
**
**
*P < 0.05, compared with "No AKI" group
Post-transplantation AKI
20
**
**
**
**
**
**
**
** ** **
** ** ** ** ** **
**
**
**
** ** **
** **
** ** **
** **
**
Fig. 3. Time-dependent changes in eGFR according to the risk factors in the multivariable analysis. Each dot represents average eGFR according to subgroups of patients (Bars represent standard deviation). AKI, acute kidney injury; eGFR, estimated glomerular filtration rate. *P < 0.05, compared with the reference group (t-test).
detection of CKD development, even among those with AKI that may have recovered before discharge.
Perioperative hemodynamic instability is a well-recognized phenomenon, and vasoactive agents are often used during LT [28]. We showed that perioperative hypotension and blood loss do not appear to be independent predictors of long-term renal function. Instead, immediate postoperative vasopressor score was independently associated with progressive CKD. This result may indicate that prolonged administration of a high dose of vasopressor during the perioperative period is related with irreversible kidney damage after LT. In the vasodilatory condition, it makes physiologic sense to improve GFR by restoration of vascular resistance. It is uncertain, however, whether vasopressor can achieve these goals safely [29]. If a vasopressor is excessively administered, intrarenal vascular resistance would increase proportionately more than perfusion pressure, and overall blood flow would decrease [29]. If a patient is hypotensive, routine initiation or increasing the dose of vasopressor is not an advisable solution due to effects on the kidney. Although administration of vasopressor is required in sustained vasodilatory hypotension, judicious assessment of the patient’s volume status and surveillance of other correctable causes (e.g., sedatives, analgesics, or hemorrhage) with efforts of correcting them would be reasonable. It is worth mentioning that vasopressor infusion under normal circulatory conditions or hypovolemic hypotension is more strongly associated with renal ischemia [10]. To our knowledge, this is the first study to demonstrate a relationship between perioperative vasopressor and post-LT CKD.
The absence of a significant relationship between transfused amount of blood products and progressive CKD after LT is inconsistent with results from previous studies. The intraoperative transfused amount of RBC has been reported as a strong risk factor for overall poor outcome in the general population and in people with renal dysfunction after LT [5,9]. The difference between our study and previous studies may relate to restrictive policy for use of intraoperative RBC transfusion with active use of autologous cell salvage.
Our study has several limitations. First, the study is subject to bias due to unknown or unmeasured confounders due to its retrospective nature. However, because it was a single- center study, we collected the data for many potential variables associated with progressive CKD. The precise values for the hemodynamic data during the operation were retrieved from the electronic medical records. Second, the effects of mammalian target of rapamycin (mTOR) inhibitors on renal outcome were not studied in our study. Nearly all patients received standard calcineurin inhibitor therapy without switching to alternative regimens because mTOR inhibitors have only become available recently in Korea. Further studies regarding renal outcome in patients with alternative
immunosuppressive regimens are required in the future. Third, our threshold for defining intraoperative hypotension was SBP
<80 mmHg. A change in this threshold value may alter the incidence of hypotension, and this definition has not been validated for LT patients. However, there is no accepted single definition for intraoperative hypotension, and our threshold value has been used in previous studies [30]. Fourth, we did not use a clinical-endpoint such the onset of end-stage renal disease as a main outcome parameter. Although this has more clinical impact, this is a relatively late event in the course of CKD progression. Despite the 10-year long-term follow-up period of our study, ESRD only occurred in a few patients. Evaluation of outcomes other than ESRD with surrogate markers is needed in most clinical studies. Fifth, we used creatinine-based eGFR to assess renal function using MDRD formula. Since the serum creatinine concentration generally underestimates the degree of renal dysfunction in patients with liver disease and is affected by muscle mass, GFR estimation using serum cystatin C or measure of GFR using inulin clearance or isotopic clearance is desirable.
In this single-center study of LT recipients, age, diabetes mellitus, proteinuria, perioperative AKI, and administered dose of vasopressor were risk factors for CKD after LT. These findings indicate that postoperative AKI and vasopressor may be modifiable risk factors for progressive CKD. In postoperative patient care, risk stratification of patients based on the risk factors described above coupled with preventive strategies may improve long-term renal outcome in LT recipients.
ACKNOWLEDGEMENTS
The authors are grateful to all members and coordinators from the liver transplantation team of Samsung Medical Center for their support throughout this research work.
Fund/Grant Support
Kyungho Lee was supported by the Korea Health Technology R&D Project through the Korea Health Industry Development Institute (KHIDI), funded by the Ministry of Health & Welfare, Republic of Korea (grant number: HI19C1337).
Conflict of Interest
No potential conflict of interest relevant to this article was reported.
ORCID iD
Kyungho Lee: https://orcid.org/0000-0003-2627-0220 Junseok Jeon: https://orcid.org/0000-0003-2532-0177 Jong Man Kim: https://orcid.org/0000-0002-1903-8354 Gaabsoo Kim: https://orcid.org/0000-0002-9383-2652 Kyunga Kim: https://orcid.org/0000-0002-0865-2236
Hye Ryoun Jang: https://orcid.org/0000-0001-9856-6341 Jung Eun Lee: https://orcid.org/0000-0002-4387-5291 Jae-Won Joh: https://orcid.org/0000-0003-4823-6218 Suk-Koo Lee: https://orcid.org/0000-0002-8503-2882 Wooseong Huh: https://orcid.org/0000-0001-8174-5028
Author Contribution
Conceptual ization: KL, JMK, GK, JWJ, SKL, WH
Formal Analysis: KL, JJ, KK Investigation: KL, JJ, KK Methodology: KL, HRJ, JEL Project Administration: WH Writing – Original Draft: KL, JJ, KK
Writing – Review & Editing: JMK, GK, HRJ, JEL, JWJ, SKL, WH
REFERENCES
1. Thongprayoon C, Kaewput W, Tham- charoen N, Bathini T, Watthanasuntorn K, Lertjitbanjong P, et al. Incidence and impact of acute kidney injury after liver transplantation: a meta-analysis. J Clin Med 2019;8:372.
2. Bahirwani R, Reddy KR. Outcomes after liver transplantation: chronic kidney disease. Liver Transpl 2009;15 Suppl 2:S70-4.
3. Ojo AO, Held PJ, Port FK, Wolfe RA, Leichtman AB, Young EW, et al. Chronic renal failure after transplantation of a nonrenal organ. N Engl J Med 2003;349:931-40.
4. Kim HY, Lee JE, Ko JS, Gwak MS, Lee SK, Kim GS. Intraoperative management of liver transplant recipients having severe renal dysfunction: results of 42 cases.
Ann Surg Treat Res 2018;95:45-53.
5. Chen J, Singhapricha T, Hu KQ, Hong JC, Steadman RH, Busuttil RW, et al. Postliver transplant acute renal injury and failure by the RIFLE criteria in patients with normal pretransplant serum creatinine concentrations: a matched study.
Transplantation 2011;91:348-53.
6. Utsumi M, Umeda Y, Sadamori H, Nagasaka T, Takaki A, Matsuda H, et al. Risk factors for acute renal injury in living donor liver transplantation: evalua- tion of the RIFLE criteria. Transpl Int 2013;26:842-52.
7. Hilmi IA, Damian D, Al-Khafaji A, Planinsic R, Boucek C, Sakai T, et al. Acute kidney injury following orthotopic liver transplantation: incidence, risk factors,
and effects on patient and graft outcomes.
Br J Anaesth 2015;114:919-26.
8. Leithead JA, Ferguson JW, Bates CM, Davidson JS, Simpson KJ, Hayes PC.
Chronic kidney disease after liver transplantation for acute liver failure is not associated with perioperative renal dysfunction. Am J Transplant 2011;11:1905-15.
9. Rana A, Petrowsky H, Hong JC, Agopian VG, Kaldas FM, Farmer D, et al. Blood transfusion requirement during liver transplantation is an important risk factor for mortality. J Am Coll Surg 2013;216:902- 7.
10. Richer M, Robert S, Lebel M. Renal hemodynamics during norepinephrine and low-dose dopamine infusions in man. Crit Care Med 1996;24:1150-6.
11. Levey AS, Coresh J, Greene T, Stevens LA, Zhang YL, Hendriksen S, et al. Using standardized serum creatinine values in the modification of diet in renal disease study equation for estimating glomerular filtration rate. Ann Intern Med 2006;145:247-54.
12. Mehta RL, Kellum JA, Shah SV, Molitoris BA, Ronco C, Warnock DG, et al. Acute Kidney Injury Network: report of an initiative to improve outcomes in acute kidney injury. Crit Care 2007;11:R31.
13. National Kidney Foundation. K/DOQI clinical practice guidelines for chronic kidney disease: evaluation, classification, and stratification. Am J Kidney Dis 2002;39(2 Suppl 1):S1-266.
14. Bang SR, Ahn HJ, Kim GS, Yang M,
Gwak MS, Ko JS, et al. Predictors of high intraoperative blood loss derived by simple and objective method in adult living donor liver transplantation.
Transplant Proc 2010;42:4148-50.
15. Zuppa AF, Nadkarni V, Davis L, Adamson PC, Helfaer MA, Elliott MR, et al. The effect of a thyroid hormone infusion on vasopressor support in critically ill children with cessation of neurologic function. Crit Care Med 2004;32:2318-22.
16. Olthoff K M, Kulik L, Samstein B, Kaminski M, Abecassis M, Emond J, et al.
Validation of a current definition of early allograft dysfunction in liver transplant recipients and analysis of risk factors.
Liver Transpl 2010;16:943-9.
17. von Elm E, Altman DG, Egger M, Pocock SJ, Gøtzsche PC, Vandenbroucke JP, et al. The Strengthening the Reporting of Observational Studies in Epidemiology (STROBE) statement: guidelines for reporting observational studies. Lancet 2007;370:1453-7.
18. Saliba F, Fischer L, de Simone P, Bernhardt P, Bader G, Fung J. Association between renal dysfunction and major adverse cardiac events after liver transplantation:
e v idence f rom a n I nter n at ion a l Randomized Trial of Everolimus-Based Immunosuppression. Ann Transplant 2018;23:751-7.
19. Yilmaz S, Yilmaz A, Häyry P. Chronic renal allograft rejection can be predicted by area under the serum creatinine versus time curve (AUCCr). Kidney Int 1995;48:251-8.
20. Coresh J, Turin TC, Matsushita K, Sang Y, Ballew SH, Appel LJ, et al. Decline in estimated glomerular filtration rate and subsequent risk of end-stage renal disease and mortality. JAMA 2014;311:2518-31.
21. Jha V, Garcia-Garcia G, Iseki K, Li Z, Naicker S, Plattner B, et al. Chronic kidney disease: global dimension and perspectives. Lancet 2013;382:260-72.
22. Rifkin DE, Coca SG, Kalantar-Zadeh K.
Does AKI truly lead to CKD? J Am Soc Nephrol 2012;23:979-84.
23. Basile DP, Donohoe D, Roethe K, Osborn JL. Renal ischemic injury results in permanent damage to peritubular capillaries and influences long-term function. Am J Physiol Renal Physiol 2001;281:F887-99.
24. Basile DP, Leonard EC, Tonade D, Friedrich JL, Goenka S. Distinct effects on long-term function of injured and contralateral kidneys following unilateral renal ischemia-reperfusion. Am J Physiol Renal Physiol 2012;302:F625-35.
25. Northup PG, Argo CK, Bakhru MR, Schmitt TM, Berg CL, Rosner MH.
Pretransplant predictors of recovery of renal function after liver transplantation.
Liver Transpl 2010;16:440-6.
26. Bucaloiu ID, Kirchner HL, Norfolk ER, Hartle JE 2nd, Perkins RM. Increased risk of death and de novo chronic kidney disease following reversible acute kidney injury. Kidney Int 2012;81:477-85.
27. Kellum JA. Persistent acute kidney injury.
Crit Care Med 2015;43:1785-6.
28. Xia VW, Du B, Braunfeld M, Neelakanta G, Hu KQ, Nourmand H, et al. Preoperative characteristics and intraoperative transfu- sion and vasopressor requirements in patients with low vs. high MELD scores.
Liver Transpl 2006;12:614-20.
29. Bellomo R, Wan L, May C. Vasoactive drugs and acute kidney injury. Crit Care Med 2008;36(4 Suppl):S179-86.
30. Bijker JB, van Klei WA, Kappen TH, van Wolfswinkel L, Moons KG, Kalkman CJ.
Incidence of intraoperative hypotension as a function of the chosen definition:
literature definitions applied to a retrospective cohort using automated data collection. Anesthesiology 2007;107:213- 20.