Print ISSN: 1738-3110 / Online ISSN 2093-7717 JDS website: http://kodisa.jams.or.kr/
http://dx.doi.org/10.15722/jds.18.10.202010.25
The Effects of Attitude, Subjective Norm, and Behavioral Intention on Perceived Values in Traditional Marketplaces
Jae-Jang YANG1, Sun-Choung AHN2
Received: July 23, 2020. Revised: September 01, 2020. Accepted: October 05, 2020.
Abstract
Purpose: Traditional markets have served as important locations for social-cultural and economic activities. It is a hub of economic transactions and where people gather and exchange information and goods, while also serving as the center of social activities, including commercial exchanges. Accordingly, this study aimed to contribute to the studies on the perceived value in traditional markets for customers in different aspects. Research design, data, and methodology: To analyze the proposed model, data was collected from 456 respondents and analyzed with SPSS 21.0 and AMOS 21.0. The data was analyzed with structural equation modeling (SEM) using path analysis. Results: According to the results of the analysis, the perceived value comprises utilitarian value, emotional value, economic value, and social value, all of which had a positive impact on attitude. Emotional value and social value had a positive impact on subjective norms, while utilitarian value and economic value did not have an impact on subjective norms. Also, attitudes and subjective norms were found to have a positive impact on behavioral intention. Conclusions: Through this study, the value that the traditional markets need to provide to consumers have been identified. Traditional markets should develop into places that can provide value for their consumers.
Keywords : Traditional Marketplace, Perceived Value, TRA Attitude, Subjective Norm, Loyalty.
JEL Classification Code : M10, H30, H87, H54.
1. Introduction12
Historically, traditional markets have served as an important place for social, cultural, and economic activities.
Traditional markets are not only a place to purchase products, but they are also a central hub for various economic transactions as well as a place for social activities where people can gather to socialize or exchange information (Lopez‐Morales, 2011). Additionally, traditional markets have been used in recent years as a form
1 First Author. Graduate school of eMA, Sejong university, Seoul, South korea. Email: [email protected]
2 Corresponding Author. Department of food science & culinary arts , S hinhan Univers it y, S out h k orea,
Email: [email protected]
ⓒ Copyright: The Author(s)
This is an Open Access article distributed under the terms of the Creative Commons Attribution Non-Commercial License (http://Creativecommons.org/licenses/by-nc/4.0/) which permits unrestricted noncommercial use, distribution, and reproduction in any medium, provided the original work is properly cited.
of tourism spots for travelers. Traditional markets offer tourists a special cultural experience where they can encounter a country’s unique atmosphere and goods (Wu, Wall, & Pearce, 2014). Traditional markets have become a mainstay for tourism with their unique advantage of offering cultural experiences while also being places for social and commercial exchange (Hassan, 2000). Tourists can share in the atmosphere and the goods that the traditional markets offer, as well as revel in the experience of eating and having fun in there (Sims, 2009).
However, many traditional markets that once served as the hub of the economy for the general public are now in decline, due to the competition with departmental stores, large discount stores, outlets, and other compound shopping facilities. However, some traditional markets are slowly gaining back its past glory through viral marketing with the growing popularity of social networks. This is because these traditional markets provide special value in the form of the experience they deliver to the consumers.
The management of customer experience and experiential marketing belongs to the area of corporate management strategies (Homburg, Jozić, & Kuehnl, 2015).
Customers are always out to seek new and diverse experiences. Therefore, companies need to always find creative and novel ways to make sure that their customers will be able to have such experiences (Minkiewicz, Evans,
& Bridson, 2014). Albrecht et al. (2016) explained the role of companies as experience providers in that businesses use their services as the stage where experiencing takes place when the customers use these services. Businesses are in the position of making memorable events for consumers and as such, they remember these emotionally important experiences, making or creating the future of companies (Lilja, Eriksson, & Ingelsson, 2010).
Therefore, for the traditional markets to compete with new shopping centers and other stores, it must provide value for the consumers. To create value in the traditional markets, the managers must provide the customers with value that is unique and differentiated from those of other markets. According to the theory of consumer value, customers try to purchase the benefits related to the products or the services of a company (Lai, 1995). In line with this, consumers can exchange information in traditional markets, as well as experience a plethora of emotions that stimulate the senses. This can also be translated as the traditional markets having the ability to provide utilitarian, emotional, economic, and social values for the consumers (Sweeney & Soutar, 2001). Such value can have an impact on brand loyalty through the attitudes and subjective norms of the consumers.
As the competition in the market intensifies, the marketing managers need to be able to maintain customer loyalty (Auka, 2012). Attitudinal loyalty and behavioral loyalty both originate from the perceived value of a traditional market. Therefore, the expansion must take place from behavioral to attitudinal loyalty (Oliver, 1999).
Attitudinal loyalty is positively related to the intent of repurchase, word of mouth, acceptance/objection to premium prices, and resistance to persuasion. But, behavioral loyalty plays a role in increasing market share and boosting profitability (Bilgihan, Madanoglu, & Ricci, 2016).
In many studies, different behavioral models were employed to explore customer behaviors (Hussain et al., 2016; Liu, Segev, & Villar, 2017; Yousafzai, Foxall, &
Pallister, 2010). The theory of reasoned action (TRA) is one of the most widely recognized theories which deals with being able to anticipate the behaviors of consumers under different circumstances (Liu et al., 2017). It is also a very important theory in anticipating the intent of repurchase for consumers (Hussain et al., 2016). According to TRA, the
intent of an action is determined by the attitudes and the subjective norms related to behaviors (Fishbein & Ajzen, 1975, 2011).
Therefore, this study aims to contribute to the literature on the perceived value of traditional markets for consumers in the following aspects; first, studies on the perceived value of customers in the traditional market are scarce and need to be researched in greater detail. Therefore, in this study, the perceived value of traditional markets for consumers was classified into the utilitarian value, emotional value, social value, and economic value. Since this study expands on the existing perceived value, it is possible to establish a marketing strategy for the traditional market by presenting important implications for the formation of the customer's perceived value for the traditional markets. Second, in this study, the TRAs will be used to verify the influence of the perceived value on traditional markets on consumer loyalty. This will aid in developing and verifying a structural formation in which observations of how perceived value influences attitudes, subjective norms, and loyalty can be studied. Third, this study will examine and identify the necessary implications for understanding the priorities and allocations of the marketing resources and the management approach for the perceived value of the traditional markets to the consumers.
2. Literature Review 2.1. Perceived value
2.1.1. Concept of perceived value
Perceived value is the customers' evaluation of the merits of a product or service, and its ability to meet their needs and expectations based on the awareness of the utility of the target (Zeithaml, 1988). In relationship marketing studies, perceived value is one of the key elements that is used in providing customer services and experiences (McDougall
& Levesque, 2000). Customers tend to purchase products or services with which they can experience value (Anderson &
Wynstra, 2010). Besides, the perceived value in marketing and tourism have been studied in the past as an element of experiential composition (Chen & Chen, 2010; Prebensen et al., 2013). Gentile, Spiller, and Noci (2007) stated that companies should provide product or service experiences where their value can be perceived by consumers. In this context, the experience can be defined as a memorable event. These experiences are imaginable and are constructed from past, present, and imaginary future moments. While such experiences can be special events for the consumers, the value it provides to them is a reflection of their company and their products (Boswijk et al., 2007).
Helkkula, Kelleher, and Pihlström (2012) also argued that the value of the experience is the value that can be directly or indirectly experienced by the customer of a service.
Besides, Prebensen, Vitterso, and Dahl (2013) defined the experiential value of a tourist destination as that in which the tourists have the intent to stay in said destination due to the benefits originating from the tour experience. The consumption experience for a consumer, such as one in which the customer visits a traditional market, is a phenomenon in which illusions, emotions, and fun are sought for the experience. These are essential in understanding the creation of value through the experiences of the consumers (Holbrook & Hirschman, 1982).
Past studies have shown that experience influences perceived value (Deng & Pierskalla, 2011). Customers are motivated to repeat experiences that are rewarding and enjoyable. The experience focuses on symbolic meaning and pleasure and potential conscious response rather than benefits, functions, and conscious processes (Holbrook &
Hirschman, 1982). According to Gentile et al. (2007), when products provide valuable experiences, the consumer tends to recognize the high value of the products.
The perceived value of the consumer is relativistic and comparative. Consumers choose products based on their value, but the perceived value for customers may differ according to individual needs and circumstances (Sheth, Newman, & Gross, 1991). Moreover, the perceived value of the customer's experience constantly changes with individual needs (Addis & Holbrook, 2001). In other words, consumers may have different values for the same product or service of a company at any given time. Perceived value is the value that is perceived by the consumers in experiential consumption. This is because experiences are situations that occur through the consumers, but their perceived value varies by the consumers and is personal (Gronroos, 2011). Slater and Narver (2000) argued that when the benefits that are provided by a company are higher than the cost (in price, searching, time, and emotional costs) and the value is maximized. Thus, traditional markets will need to increase the perceived value by providing more benefits with lower costs for the customers.
Perceived value is also utilized in evaluating and differentiating products (Tarn, 1999) and developing positioning strategies (Gallarza & Saura, 2006). Recently, the competition in service and tourism industries have increased, and the importance of perceived value is starting to gain more ground and attention (Gursoy, Spangenberg,
& Rutherford, 2006; Lee et al, 2016; Lee, Yoon, & Lee, 2007; Sanchez, Callarisa, Rodriguez, & Moliner, 2006).
This is because the perceived value is one of the key strategic elements that can be used to gain the upper hand in the market competition (Eggert & Ulaga, 2002). In
particular, the high perceived value of customers in the traditional markets will enable them to secure a competitive advantage and create new customers.
2.1.2. Dimensions of perceived value
Chen and Chen (2010) measured the experiential value of the consumers based on extrinsic and intrinsic structures.
The functional and economic value can be said to be the value that is created based on the qualities of services provided for in the traditional markets. Therefore, they are evaluated based on the intrinsic structure of the consumers.
However, the emotional value and social value, which can be affected by others, can be said to be extrinsic structures.
The concept of perceived value has been widely studied (Chen & Chen, 2010; Lee et al., 2016; Prebensen et al., 2013). The experience economy model made by Pine and Gilmore (1998) set four domains of experiential value depending on individual participation and participation level (ex: entertainment, education, aesthetics, and escape).
The experience economy model is based on the suggestion that consumers are the ones that endow the value to the experiences that they are exposed to (Suntikul & Jachna, 2016). In this framework, consumers are not seen to be passive acceptors but rather as co-producers of experience.
Eventually, they play the role of the co-producer of experience. In this sense, traditional markets may include the value from other customers, as the well as value that concerns traditional markets.
Consumers assess the value and perceived quality of the products based on the benefits of the products that resulted from their mental, physical, and economic sacrifice through the purchasing and using of these items or experiences (Cronin, Brady, & Hult, 2000). Benefits and sacrifice are essential elements of consumer value. Each of these contributes to consumer value through their positive and negative influences (Lin, Sher, & Shih, 2005). A consumer takes transaction value when the perceived benefits are larger than the sacrifice involved (Fooks, Messer, & Duke, 2015). The positive relationship between benefits and sacrifices causes a consumer to sense fairness and leads him/her to consider recurring purchases in the future.
Therefore, a higher perceived value naturally leads to loyalty for the brands or items in the view of the consumer (Piyathasanan, Mathies, Wetzels, Patterson, & de Ruyter, 2015).
Many researchers also studied to identify other benefits of brands other than utilitarian and hedonic value. Today, customers’ decision-making processes have become much more complicated. Therefore, the perceived value may not be explained only in the perspectives of the prices and qualities in a pragmatism sense (Sweeney & Soutar, 2001).
The perceived value must be measured in multiple aspects (Lee et al., 2007). For example, Van Oerle, Mahr, and
Lievens (2016) studied perceived value in emotional and functional aspects. Likewise, the functional and emotional aspects of perceived value in modern industries have been studied widely and extensively in the current literature (Williams & Soutar, 2009). Babin, Darden and Griffin (1994) developed a general value structure that is simplified into two dimensions, which are the utilitarian elements and the hedonic elements.
Even though this topic has been studied intensively over the years, the consumer values that are usually most extensively studied are the functional, emotional, and social values (Karjaluoto et al., 2012). However, the functional value can be expanded in the physical performances and quality aspects into functional value and economic value (Kim, Gupta, & Koh, 2011; Sheth et al., 1991). As a result, it is possible to expand the perceived value to include functional, emotional, economic, and social elements (Prebensen & Xie, 2017).
Utilitarian value can be said to be the benefits related to the qualities of products based on the overall quality of the products judged by the consumers (Zeithaml, 1988). A product that is evaluated to be of higher quality is considered to provide more benefits to the consumers who can recognize these values (Zeithaml, Berry, &
Parasuraman, 1996). In this context, the qualities of the products, product benefits, and functional value are of a similar concept (Zeithaml, 1988). Following the principle of functional maximization, it is expected that the performance of the product will be able to increase the satisfaction of the demands of the consumers. Therefore, a brand or product that has superior attributes and characteristics compared to other alternatives is selected in the end.
Emotional value can be said to be the emotional state of an object (Asshidin, Abidin, & Borhan, 2016). The emotional value may be an emotional state which may be either positive (fun, happiness, or entertainment) or negative (fear, anxiety, and pain) (Zainuddin, Previte, &
Russell-Bennett, 2011). It is possible to reduce such anxiety if the emotional value is recognized by the customer (Prior, 2013).
Economic value is defined as the general evaluation of the utility of a product or service judged by consumers based on the awareness of the costs and benefits (Zeithaml, 1988). Similarly, Gassenheimer, Houston, and Davis (1998) defined economic value as the compromise between the perceived gains and perceived costs. According to Pine, Pine, and Gilmore (1999), customers’ experience will create value, including economic value.
The social value indicates the desires of consumers that can play a symbolic role (Rintamaki et al, 2006).
Consumers consume based on their positions of specialty (Nia & Zaichkowsky, 2000).
2.1.3. Relationship between perceived value, attitude, and subjective norm
Perceived value influences decision making before the purchase decision phase and customer satisfaction and behavioral intentions in the post-purchase evaluation phase (Parasuraman & Grewal, 2000). According to past studies, perceived value is a better indication of behavioral intentions than satisfaction (Cronin et al., 2000; Chen &
Chen, 2010). Lee et al. (2007) discovered that perceived value was the best estimating factor for behavioral intentions. Meng, Liang, and Yang (2011) observed that the perceived value of tourists influenced their intents for further future actions.
Consumer perceived value are the foundation of a successful transaction and motivates consumers to repeat their purchases (Holbrook, 1994). The expectation uncertainty paradigm indicates that, once a consumer has a satisfactory experience with a product, he/she tends to expect a higher value and repeat their purchases (Pappas et al., 2014).
Customers may feel increased levels of confidence and gain a positive attitude about a product through proper searching because it saves their time and reduces perceived risks (Harridge‐March, 2006; Doherty et al., 2006). The perceived value of such customers was found to be a powerful factor in determining their attitudes toward shopping (Childers et al., 2001). Therefore, in this current study, the following hypotheses were presented.
H1: The perceived value will have a positive impact on attitude.
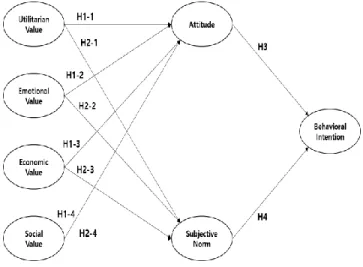
H1-1: Utilitarian value will have a positive impact on attitude.
H1-2: Emotional value will have a positive impact on attitude.
H1-3: Economic value will have a positive impact on attitude.
H1-4: Social value will have a positive impact on attitude.
The perceived value may differ depending on personal needs and circumstances (Sheth et al., 1991). That is, the perceived value of a customer can be shaped and influenced by others. This is because a consumer is influenced by their friends, relatives, co-workers, business partners, or others around them (Paul, Modi, & Patel, 2016). Therefore, the following hypotheses were presented.
H2-1: Utilitarian value will have a positive impact on the subjective norm.
H2-2: Emotional value will have a positive impact on the subjective norm.
H2-3: Economic value will have a positive impact on the subjective norm.
H2-4: Social value will have a positive impact on the subjective norm.
2.2. Attitude
An action is determined by the intent of the person who takes said action (Fishbein & Ajzen, 1975). In consumer behaviors, attitude is a positive or undesirable tendency of an individual toward an object. Fishbein and Ajzen (1975) defined attitude as a state of mind indicating the positive or negative feeling of a person or the intent to take a certain action. Therefore, the attitude of a consumer toward the same product may vary depending on the location or situation (Schiffman & Kanuk, 2010).
The attitude of consumers and the intent to make a purchase are studied extensively (Kudeshia & Kumar, 2017;
Paul et al., 2016). The most popular theoretical models in the study of consumer behavior are the attitude-behavior model such as the theory of reasoned action. The theory of reasoned action (TRA) by Fishbein and Ajzen (1975) assumes that when people take certain actions, they make a reasoned choice, and the actions are guided by the intent of the action. Such a study helps to understand and anticipate the actions of consumers (Alam & Sayuti, 2011; Norman &
Conner, 2006).
The attitude toward an action shows the level of negative or positive evaluations of the target action from the consumer’s point of view (Ajzen, 1991). Ramayah, Lee, and Mohamad (2010) argued that attitude includes action and perceived results. According to Kotchen and Reiling (2000), attitude is an important estimating factor of the intent of an action. Attitude is a psychological emotion that is delivered through the evaluation by consumers. If it is positive, it tends to influence the intent of action in a positive manner (Chen & Tung, 2014). More specifically, there is a positive relationship between attitude and actions (Mostafa, 2007). Additionally, Van Birgelen, Semeijn, and Keicher (2009) argued that a positive attitude on the product shown by a consumer will increase the intent of purchase. Many researchers have found that behavioral intention was positively influenced by attitude (Chen &
Tung, 2014; Han & Yoon, 2015; Lam & Hsu, 2006).
Therefore, the following hypotheses were presented.
H3: Attitude will have a positive impact on behavioral intention.
2.3. Subjective norm
The TRA (Fishbein & Ajzen, 1975) model focuses on the motifs of individuals that determine their likelihood of participating in a certain action. This usually forms to explain the relationship between attitude, subjective norm, and behavioral intention. In the TRA model, the second
determinative factor of behavioral intention is the subjective norm. Subjective norms are defined as the perceived social pressure to perform or refrain from certain actions (Ajzen, 1991). Paul et al. (2016) argued that the actions of a consumer are under the influence of the people around them, such as close friends, relatives, co-workers, or business partners. Subjective norms can be defined as the influence of the expectations held by family members or friends on the actions of individuals upon certain targets or concepts (Hanzaee & Ramezani, 2011).
The TRA is guided by behavioral intention, which is under the influence of the attitude toward the action and subjective norms (social influence) (Fishbein & Ajzen, 1975). Subjective norms are whether the people around them believe a certain action must be performed or not performed and is also defined as the awareness of an individual upon perceived social pressure. Such a social norm is also referred to as an imperative norm (Interis, 2011). Therefore, the following hypotheses were presented.
H4: Subjective norm will have a positive impact on the behavioral intention
In this study, a research model as shown in Figure 1 was established based on such previous studies.
Figure 1: Proposed model
3. Research Methods 3.1. Data collection
A survey was conducted on the consumers who visited traditional markets. The survey was conducted by a surveyor from a professional survey agency who was trained on the purpose and method of the survey. 50 copies
of each were provided to 20 surveyors, and a face-to-face survey was conducted targeting customers who visited the traditional markets. A total of 1,000 questionnaires was distributed and 502 were recovered over the period of October 11 to October 30, 2019. Of the questionnaires recovered, 456 were used for the analysis in this study, excluding 46 which were either incomplete or deemed unreliable.
The statistical analysis and processing of the data from the recovered questionnaires were conducted utilizing analysis by SPSS 21.0 and AMOS 21.0. The details of the analyses were as follows; First, for the analysis of the characteristics of the samples, a frequency analysis was conducted. Second, to confirm the reliability of the questions, a reliability analysis was conducted, while a validity factor analysis was conducted for validation. Third, the relationship between the perceived value, attitude, subjective norms, and loyalty on traditional markets was analyzed using a structural equation model.
3.2. Measures
All the measurement items used in this study were measured using a scale of 1 = “Not at all” to 7 = “I strongly agree.” First, the perceived value was measured using the questions from Sweeney and Soutar (2001) which were adapted for this study. Six questions were assigned to functional value, five to emotional value, and four to economic value. The functional value in this study was defined as the value relating to the service quality of traditional markets, while emotional value was defined as the positive emotions the consumers felt on using traditional markets. Also, the economic value was defined
as the economic merits of using a traditional market, while social value was defined as the positive social feeling of using traditional markets.
The attitude of the consumers was measured using four questions adapted from Conner et al. (2011) for this study to indicate how much the interviewees liked visiting traditional markets. Subjective norms were measured with four questions adapted from Taylor and Todd (1995) and were defined as the level of positive thinking of others in the consumer’s social circle on using traditional markets.
Lastly, the behavioral intention was measured using six questions adapted from Oliver (1980) for purchase intents and Babin et al. (2005) for the intent to spread the word of mouth and was defined as the intent of the consumers to recommend using traditional markets to the people around them.
4. Empirical results 4.1. Profile of respondents
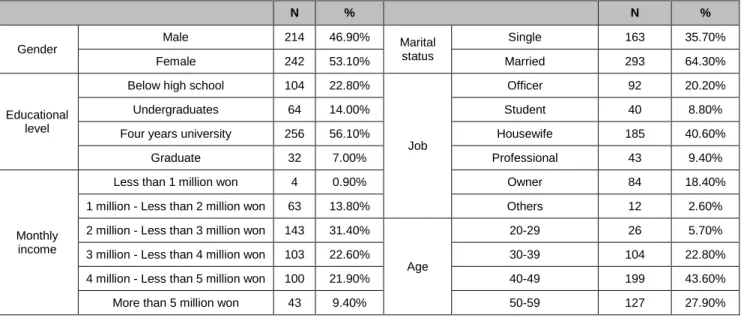
The general characteristics of the 456 participants in the survey of this study were as shown in Table 1.
First, the number of female participants (53.1%, 242) was slightly higher than that of the male participants (46.9%, 214). As for the education level, 56.1% (256) had a university diploma, followed by high school diploma holders (22.8%), two-year college graduates (14.0%), and graduates from graduate schools (7.0%). In the category of marital status, the married (64.3%, 293) participants accounted for more than those who were single (35.7%).
Table 1: Sample profile(n=456)
N % N %
Gender
Male 214 46.90% Marital
status
Single 163 35.70%
Female 242 53.10% Married 293 64.30%
Educational level
Below high school 104 22.80%
Job
Officer 92 20.20%
Undergraduates 64 14.00% Student 40 8.80%
Four years university 256 56.10% Housewife 185 40.60%
Graduate 32 7.00% Professional 43 9.40%
Monthly income
Less than 1 million won 4 0.90% Owner 84 18.40%
1 million - Less than 2 million won 63 13.80% Others 12 2.60%
2 million - Less than 3 million won 143 31.40%
Age
20-29 26 5.70%
3 million - Less than 4 million won 103 22.60% 30-39 104 22.80%
4 million - Less than 5 million won 100 21.90% 40-49 199 43.60%
More than 5 million won 43 9.40% 50-59 127 27.90%
In terms of the occupation of the interviewees, 40.6%
(183), which was the largest number, were housewives, followed by office workers (20.2%), self-employed (18.4%), licensed professionals (9.4%), students (8.8%), and others (2.6%) As for the ages, those in the 40s was the higher in number (43.6%, 199), followed by 50s (27.9%), 30s (22.8%,) and 20s (5.7%). As for the average monthly income, the largest in number was those who made over 2 million won (31.4%), followed by 3 million won (22.6%), 4
million won (21.9%), 1 million won (13.8%), 5 million won (9.4%), and 1 million or lower (0.9%)
4.2. Measurement reliability
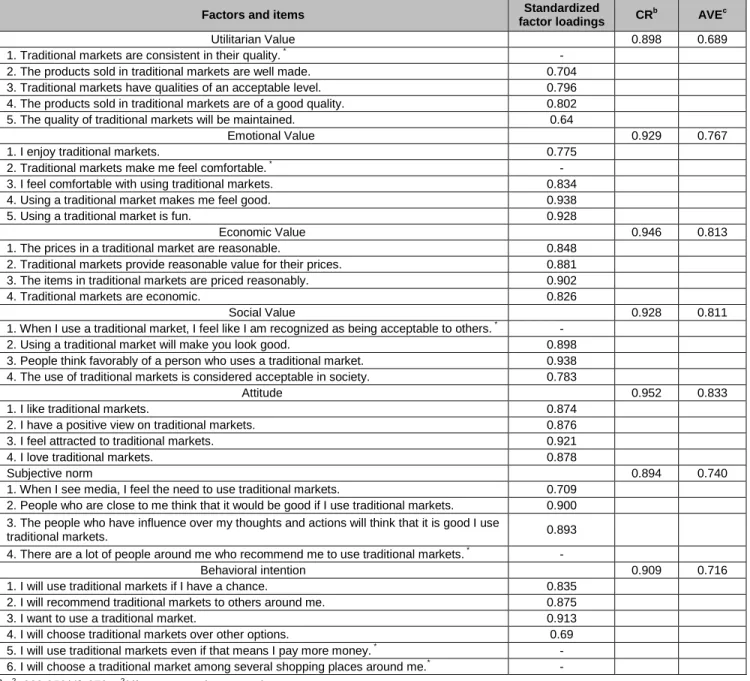
To verify the convergent validity and discriminant validity of the scales, the measurement model analysis was conducted on all study units included in this model.
Table 2: Results of Factor Analysis
Factors and items Standardized
factor loadings CRb AVEc
Utilitarian Value 0.898 0.689
1. Traditional markets are consistent in their quality. * -
2. The products sold in traditional markets are well made. 0.704
3. Traditional markets have qualities of an acceptable level. 0.796
4. The products sold in traditional markets are of a good quality. 0.802
5. The quality of traditional markets will be maintained. 0.64
Emotional Value 0.929 0.767
1. I enjoy traditional markets. 0.775
2. Traditional markets make me feel comfortable. * -
3. I feel comfortable with using traditional markets. 0.834
4. Using a traditional market makes me feel good. 0.938
5. Using a traditional market is fun. 0.928
Economic Value 0.946 0.813
1. The prices in a traditional market are reasonable. 0.848
2. Traditional markets provide reasonable value for their prices. 0.881
3. The items in traditional markets are priced reasonably. 0.902
4. Traditional markets are economic. 0.826
Social Value 0.928 0.811
1. When I use a traditional market, I feel like I am recognized as being acceptable to others. * -
2. Using a traditional market will make you look good. 0.898
3. People think favorably of a person who uses a traditional market. 0.938 4. The use of traditional markets is considered acceptable in society. 0.783
Attitude 0.952 0.833
1. I like traditional markets. 0.874
2. I have a positive view on traditional markets. 0.876
3. I feel attracted to traditional markets. 0.921
4. I love traditional markets. 0.878
Subjective norm 0.894 0.740
1. When I see media, I feel the need to use traditional markets. 0.709 2. People who are close to me think that it would be good if I use traditional markets. 0.900 3. The people who have influence over my thoughts and actions will think that it is good I use
traditional markets. 0.893
4. There are a lot of people around me who recommend me to use traditional markets. * -
Behavioral intention 0.909 0.716
1. I will use traditional markets if I have a chance. 0.835
2. I will recommend traditional markets to others around me. 0.875
3. I want to use a traditional market. 0.913
4. I will choose traditional markets over other options. 0.69
5. I will use traditional markets even if that means I pay more money. * - 6. I will choose a traditional market among several shopping places around me.* -
a χ2=663.352(df=278, χ2/df=2.386, p-value =0.000), CFI=0.961, NFI=0.936, GFI=0.897, AGFI=0.869, RMR=0.035, RMSEA=0.055
b Construct reliability
c Average variance extracted
* Items were deleted during confirmatory factor analysis.
The result showed that, as shown in Table 2, χ2=663.352(df=278, χ2/df=2.386, p-value =0.000), CFI=0.961, NFI=0.936, GFI=0.897, AGFI=0.869, RMR=0.035, RMSEA=0.055, indicating that they were valid to be used in the future analysis model. Also, the factor loading was 0.6 or higher and found to be significant (t>2.00), supporting convergent validity (Bagozzi, & Yi, 1988). Also, the composite construct reliability and average variance extracted (AVE) of the study units were calculated.
The composite construct reliability and AVE met the criteria suggested by Bagozzi and Yi (1988), where the CR is 0.6 or higher and the AVE is 0.5 or higher. The discriminant validity was also supported as the AVE turned out to be higher than the square of the correlation value (AVE>r2).
Also, to verify the common method bias, the researcher conducted Harman’s one-factor test (Lee, Lee, & Li, 2012).
For this measurement, the degree of freedom and χ 2 of the models that were controlled with one factor and those that
were not, which were suggested by Podsakoff and Organ (1986) were compared. The result showed that the χ 2 of the single-dimension model was 3804.919, where the degree of freedom was 299 (Multi-dimensional model: χ2=663.352, df=278). In this study, the model fitness was not significantly worse compared to the multi-dimensional test, so it was used in this study (Lee et al., 2014).
4.3. Correlation analysis
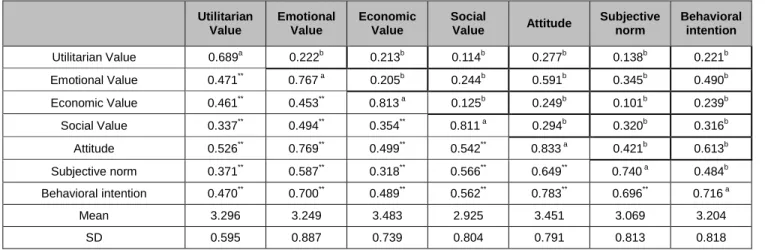
To examine the level of correlations in the results of the validity and reliability analyses and the direction of the relationships between scales of study units where single- dimensionality is proven, the researcher conducted a correlation analysis as shown in Table 3. The result of the analysis showed that the directions of relationships among the study units provided in hypotheses matched with the study model.
Table 3: Construct I ntercorrelations, Mean and Standard Deviation
Utilitarian
Value
Emotional Value
Economic Value
Social
Value Attitude Subjective norm
Behavioral intention
Utilitarian Value 0.689a 0.222b 0.213b 0.114b 0.277b 0.138b 0.221b
Emotional Value 0.471** 0.767 a 0.205b 0.244b 0.591b 0.345b 0.490b
Economic Value 0.461** 0.453** 0.813 a 0.125b 0.249b 0.101b 0.239b
Social Value 0.337** 0.494** 0.354** 0.811 a 0.294b 0.320b 0.316b
Attitude 0.526** 0.769** 0.499** 0.542** 0.833 a 0.421b 0.613b
Subjective norm 0.371** 0.587** 0.318** 0.566** 0.649** 0.740 a 0.484b
Behavioral intention 0.470** 0.700** 0.489** 0.562** 0.783** 0.696** 0.716 a
Mean 3.296 3.249 3.483 2.925 3.451 3.069 3.204
SD 0.595 0.887 0.739 0.804 0.791 0.813 0.818
**=p<0.01, * p<0.05, a =AVE (Average variance extracted), b=r2
4.4. Hypothesis testing
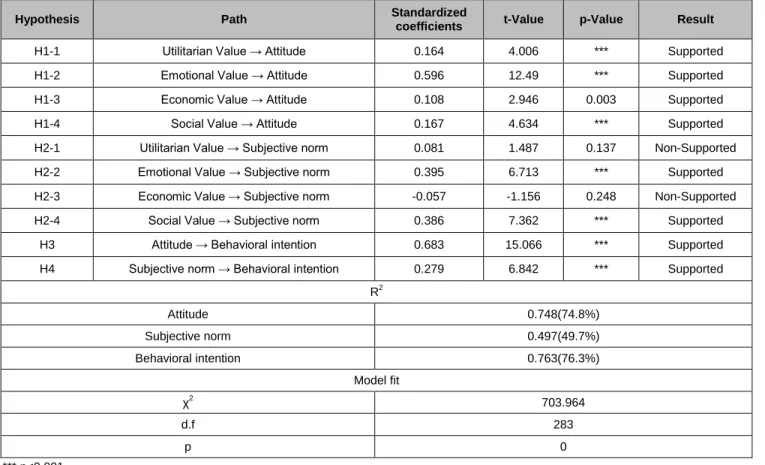
The overall model between the study units of this study, namely functional value, emotional value, economic value, social value, attitude, subjective norms, and the behavioral intention, was verified using an SEM. The result showed that χ2=703.964, df=283, χ2/df=2.488, p-value =0.000), GFI=0.893, NFI=0.932, CFI=0.958, AGFI=0.868, RMR=0.040, RMSEA=0.057. The result of the analysis of the R2, with which the intrinsic variables are explained by extrinsic variables showed that attitude was 0.748 (74.8%,) subjective norms 0.497 (49.7%), and the behavioral intention was 0.763 (76.3%).
The result of the analysis of the structural model for verifying the hypotheses on the relationship between the study units such as functional value, emotional value,
economic value, social value, attitude, subjective norms, and the behavioral intention was as shown in Table 4.
H1 concerns the relationship between the value of traditional markets and attitude. As for the verification of H1-1 that utilitarian value would have an impact on attitude, the path coefficient was 0.164, while the t-value was 4.006, indicating that utilitarian value had a significant positive impact on attitude (p<0.01). Therefore, H1-1 was supported.
Next, the verification H1-2 that emotional value would have an impact on attitude showed that the path coefficient was 0.596 and t-value 12.490, indicating that emotional value had a significant positive impact on attitude (p<0.01).
Therefore, H1-2 was supported. As for the verification of H1-3 that economic value would have an impact on attitude, the path coefficient was 0.108, while the t-value was 2.946, indicating that economic value had a significant positive
impact on attitude (p<0.01). Thus, H1-3 was supported.
Lastly, the verification H1-4 that social value would have an impact on attitude showed that the path coefficient was
0.167 and t-value 4.634, indicating that social value had a significant positive impact on attitude (p<0.01). As can be observed, H1-4 was supported.
Table 4: Standardized Parameter E stimates
Hypothesis Path Standardized
coefficients t-Value p-Value Result
H1-1 Utilitarian Value → Attitude 0.164 4.006 *** Supported
H1-2 Emotional Value → Attitude 0.596 12.49 *** Supported
H1-3 Economic Value → Attitude 0.108 2.946 0.003 Supported
H1-4 Social Value → Attitude 0.167 4.634 *** Supported
H2-1 Utilitarian Value → Subjective norm 0.081 1.487 0.137 Non-Supported
H2-2 Emotional Value → Subjective norm 0.395 6.713 *** Supported
H2-3 Economic Value → Subjective norm -0.057 -1.156 0.248 Non-Supported
H2-4 Social Value → Subjective norm 0.386 7.362 *** Supported
H3 Attitude → Behavioral intention 0.683 15.066 *** Supported
H4 Subjective norm → Behavioral intention 0.279 6.842 *** Supported
R2
Attitude 0.748(74.8%)
Subjective norm 0.497(49.7%)
Behavioral intention 0.763(76.3%)
Model fit
χ2 703.964
d.f 283
p 0
*** p<0.001
χ2=703.964, df=283, χ2/df=2.488, p-value =0.000), GFI=0.893, NFI=0.932, CFI=0.958, AGFI=0.868, RMR=0.040, RMSEA=0.057
H2 concerns the relationship between the value of traditional markets and subjective norms. First, the verification of H2-1 that utilitarian value would have an impact on subjective norms showed that the path condensation was 0.081 while the t-value was 1.487, indicating that utilitarian value did not have a significant positive impact on subjective norms (p>0.01). Therefore, H2-1 was dismissed. Next, the verification of H2-2 that emotional value would have an impact on subjective norms showed that the path condensation was 0.395, while the t- value was 6.713, indicating that emotional value had a statistically significant positive impact on subjective norms (p<0.01). As such, H2-2 was supported. As for the verification of H2-3 that economic value would have an impact on subjective norms, the path coefficient was -0.57, while the t-value was -1.156, indicating that emotional value did not have a significant positive impact on attitude (p> 0.01). Hence, H2-3 was dismissed. Lastly, the verification of H2-4 that social value would have an impact
on subjective norms showed that the path condensation was 0.386 and the t-value was 7.362, indicating that social value had a significantly positive impact on subjective norms (p<0.01). Accordingly, H2-4 was supported.
H3 was about the relationship between attitude and behavioral intent. The result of the verification of H3 that attitude would have an impact on behavioral intent showed that the path coefficient was 0.683, while the t-value was 15.066, indicating that attitude had a significant positive impact on behavioral intent (p<0.01). For that reason, H3 was supported.
Lastly, H4 concerned the relationship between subjective norms and behavioral intent. The result of the verification of H4 that subjective norms would have an impact on behavioral intent showed that the path coefficient was 0.279 and the t-value was 6.842, indicating that subjective norms had a significant positive impact on behavioral intent (p<0.01). As a result, H4 was supported.
5. Discussion and Conclusion
To enhance the perception of the value of traditional markets to the consumers, this study examined the influence of the perceived value, which are composed of the functional value, emotional value, economic value, and social value, upon subjective norms, as well as the influence of the attitudes and subjective norms on behavioral intention.
The theoretical implications of this study are as follows;
First, this study was conducted by categorizing the perceived value into the categories of utilitarian value, emotional value, social value, and economic value. In general, the study of perceived value is being studied in a single dimension or two dimensions, utilitarian value and hedonistic value. However, in this study, the effect of multi- dimensional perceived values on the intention to visit traditional markets was studied. Second, this study was based on the reasoned action theory (Fishbein & Ajzen, 1975) to verify the influence of the perceived value of traditional markets upon loyalty. According to the VBN theory, it was found that values affect norms through belief, but in this study, it was shown that perceived values directly affected subjective norms. Moreover, this study was verified by developing a structure in which perceived values influenced attitudes, subjective norms, and loyalty.
Third, the result of the verifications in this study showed that consumer attitude was influenced by functional, emotional, economic, and social value, while subjective norms were influenced significantly by emotional and social value but not by functional and economic value. This is in line with the findings of Hanzaee and Ramezani (2011) where it was found that subjective norms were influenced by the expectations held by family members or friends.
That is, the functional value and economic value were intrinsic structures (Chen & Chen, 2013) so that they may not influence on the subjective norms which are influenced by other people.
The practical implications of this study are as follows;
First, traditional markets must develop products and customer experiences that are distinct from other markets.
Many traditional markets tend to sell the same products.
However, to differentiate a traditional market from other competitive markets, it is necessary to develop products and customer experiences unique to each traditional market so that consumers will be able to experience various and unique aspects of each market with its own characteristics.
For example, traditional markets can be differentiated from other markets by introducing food using local specialties or coins that can only be used in traditional markets.
First, it is necessary to develop products of a certain quality that are differentiated from those of other markets.
In traditional markets, similar goods are sold by many
different merchants. If customers don’t like the quality of the products they bought from a traditional market, they may criticize traditional markets in general, rather than only the specific shop that sold it. Therefore, the manager of a traditional market must make sure that the merchants in the market do not sell defective or harmful products or foods and be able to implement quality control effectively.
Second, traditional markets must sell products of a certain quality or higher. The traditional market sells a variety of products by various merchants. When a customer has a problem with the quality of a product purchased in the traditional market, they can blame the entire traditional market, not only the store they purchased. This will not only harm the image of the traditional markets in general, but it could cause long-term repercussions where people lose their trust in traditional market goods. Therefore, traditional market managers should manage market merchants to refrain from selling junk food or low-quality products. Third, traditional markets must provide their customers with services to make them shop for the pleasurable experience to make them want to come again.
Normally, it is not as comfortable to shop in a traditional market as in supermarkets or department stores. For example, even though the government is providing them with financial aids to build parking lots, a lot of these markets still suffer from the insufficiency in parking spaces.
In many cases, even those limited parking spaces are occupied by the vehicles of the merchants all day until the market is closed in the evening. Because of this, the customers cannot find a space in the parking lot. This poses a serious problem of inaccessibility and comfortability to the consumers because it would hinder them from buying many things in traditional markets since they would not be able to bring a car. Therefore, the managers of the parking facilities in traditional markets must build a system to allow only the customers to park in the parking lot. Also, traditional markets should provide shopping carts and baskets to make the shopping experience more comfortable.
The government is offering funds for the carts or baskets, but many traditional markets do not provide them to their customers in fear of losing them or damages. That being the reason, it would be imperative for the managers of traditional markets to develop a measure against lost or damaged carts and baskets, so that the customers may use them freely and comfortably for their shopping experience.
Fourth, traditional markets must price their products reasonably. Customers expect traditional markets to have products of affordable prices. However, some merchants who overcharge may compromise the reputations of the markets. For example, the fraudulent behaviors of cheating the scale or selling expired products may provide the customers with a negative value, resulting in lost trust and consumers may not come to the traditional markets again.