한수지 51(1), 91-94, 2018
91
Copyright © 2018 The Korean Society of Fisheries and Aquatic Science pISSN:0374-8111, eISSN:2287-8815 Korean J Fish Aquat Sci 51(1),91-94,2018
Note
서 론
수산물산거점유통단지
(FPC, Fisheries Products Processing
& Marketing Center)
는수산물의선도유지를위해신속하게가공하여유통하는것에중점을두고있어
, FPC
앞부두에하역이이루어지면
,
선별과정을거쳐-45℃
에서급냉한뒤, -30℃
부근의냉동창고에보관된다
.
하지만,
유통기준에따라냉동 보관되어소비지까지유통되어야하나,
실제유통과정중에는 취급부주의로인하여냉동보관온도가유지되지않거나이동 중에상온에장시간노출되어신선한상태로생산이되었음에 도불구하고,
유통과정속에서선도가바뀔수있는경우가발 생하고있다.
그러나,
유통과정중온도변화를가시적으로확인할수있는표시기술이아직도구축되어있지못한실정이 다
(Lee and Jo, 2011).
현재
,
수산물의신선도가유통과정중에잘유지되고있는지 를소비자가확인할수있도록하는시간온도지시계(TTI, time- temperature indicator)
에대한연구가이루어지고있으며,
이를 수산물에적용하기위해냉동·
냉장수산물에대한적용가능성 에대해보고되고있다(Endoza et al., 2004; Giannakourou et al., 2005; Nuin et al., 2008; Tsironi et al., 2009). TTI
의작동원 리는기계적,
화학적,
효소적,
미생물학적변화들을가시적반응 으로표현하며,
시간별로온도에의존하여감시하는장치이다(Pacquit et al., 2008).
이와같이TTI
의경우일부에서상용화 가되고있지만,
식품분야에서는여러가지의이유로실용화의냉동 수산물의 저장 온도 관리를 위한 Time-temperature Indicator와 비전 기반 Indicator 분석 프로그램 개발
장명기·홍창욱·최재혁·김꽃봉우리
1·최정욱
1·남택정
1,2·안동현
3*
디바이스넷, 1부경대학교 수산과학연구소, 2부경대학교 식품영양학과, 3부경대학교 식품공학과/식품연구소
A Time-temperature Indicator for A Vision Based-Detection System for Managing the Storage Temperature of Frozen Fish Products
Myung-Kee Jang, Chang-Wook Hong, Jae-Hyuk Choi, Koth-Bong-Woo-Ri Kim
1
, Jeong-Wook Choi1
, Taek-Jeong Nam1,2
and Dong-Hyun Ahn3*
Devicenet Research Institute, Devicenet, Anyang 14056, Korea
1Institute of Fisheries Sciences, Pukyong National University, Busan 46041, Korea
2Department of Food Science and Nutrition, Pukyong National University, Busan 48513, Korea
3Department of Food Science and Technology/Institute of Food Science, Pukyong National University, Busan 48513, Korea
We develop a time-temperature indicator (TTI) that can determine whether thawing of fish and other fishery products has occurred during frozen storage. A polypropylene tube with an internal diameter of 3 mm was prepared and cut to a length of 14 to 20 mm. One end of the tube was thermally sealed and 0.1% acetic acid was injected into the other end; the tube was then frozen at 20℃. Then the open side of the frozen tube was blocked by sinking the tube into a 10% gelatin solution. The tube was attached to a polyvinyl packaging bag along blue litmus paper and the bag was put into a freezer at -20℃. After freezing, the bag was removed to an ambient temperature of 20℃, and the time de- pendence of the color change of the litmus paper was observed. The color changed from blue to red, with the length of the red region increasing with time. Our TTI can be used as a part of a visible detection system and the detection program can conduct the elapsed time analysis on the length of the red region of the litmus paper indicating the degree of thawing. Thus, the TTI is a useful tool in the temperature management of frozen fish and fishery products.
Key words: Time-temperature indicator, Vision-based indicator detecting program, Frozen fish products
This is an Open Access article distributed under the terms of the Creative Commons Attribution Non-Commercial Licens (http://creativecommons.org/licenses/by-nc/3.0/) which permits unrestricted non-commercial use, distribution, and reproduction in any medium, provided the original work is properly cited.
https://doi.org/10.5657/KFAS.2018.0091 Korean J Fish Aquat Sci 51(1) 91-94, February 2018
Received 5 December 2017; Revised 16 January 2018; Accepted 13 February 2018
*Corresponding author: Tel: +82. 51. 629. 5831 Fax: +82. 51. 629. 5824
E-mail address: [email protected]
장명기
ㆍ
홍창욱ㆍ
최재혁ㆍ
김꽃봉우리ㆍ
최정욱ㆍ
남택정ㆍ
안동현92
어려움을겪고있다
(Kang et al., 2014).
따라서,
국내에서수산 물에적용하여간편하고경제적으로이용이가능한신선도판 별을위한indicator
의개발이필요한실정이다.
이에본연구에서는
1
년동안냉동고등어의신선도를이화학적지표로판정한결과
-30℃
의온도가유지될경우고등어의신선도에미치는영향은매우작은수준임을확인하였다
.
즉,
유 통중의온도변화가없다면이러한신선도에는영향을미치지 않을것이라는결론에도달하였다.
따라서,
냉동수산물의온도 관리를추적하기위한TTI
를개발하기위해,
해동유무에따른 가시적인변화를시각적으로감지할수있도록냉동된산성용 액이해동되었을때확산되어색변화를관찰할수있는TTI
를개발하고
vision
을기반으로한프로그램을이용하여색변화를분석하는방법을개발하였다
.
재료 및 방법
색 변화에 의한 해동 판별 indicator 제조
냉동수산물의해동유무를확인하기위한방법으로아세트 산
(Sigma-Aldrich Chemical Co., USA)
을증류수에0.1%
중 량비의농도로희석하여준비하였다.
푸른색리트머스시험지(Sigma-Aldrich Chemical Co., USA)
는폭이1 cm
로절단한 여과지에고정시켜준비하였다.
직경3 mm
인폴리프로필렌튜 브(straw)
를1.4 cm, 1.7 cm, 2.0 cm
로절단한후한쪽끝을알 코올램프를이용하여용해한후밀착시켜봉합하였다.
각각의튜브에
0.1%
아세트산용액을마이크로니들팁을이용하여10
µL, 30 µL, 50 µL
씩을주입하였다.
산성용액이주입된튜브의 열린끝을45℃
로중탕되어있는10%
젤라틴(Sigma–Aldrich Chemical Co., USA)
용액에담근후실온에서굳혀입구를막았다
. Fig. 1
에서와같이산성용액튜브를푸른색리트머스시험지가부착된여과지
(Whatmann No. 4)
여백에리트머스시험지와간격을
2.0 mm
로하여고정시켜indicator
를완성하였다. 비전 기반 indicator 분석용 프로그램
Indicator
의색변화를분석하기위해서는VIS (vision inspec- tion system)
가필요하며,
본연구에사용된vision camera
는basler acA2000-50gc color CCD (Ahrensburg, Germany)
를 사용하였고, lens
는Edmund Optics, 8.5 mm/F1.3, C Mount (Barrington, USA)
를 사용하였다. Indicator
의 색 변화 길이 를분석하는software
는national instruments (Austin, USA)
사의그래픽기반의프로그램인vision builder for automated inspection
를사용하여개발하였다.
해동 시간에 따른 indicator 변화 측정
제작한
indicator
를 폴리비닐 진공포장지에 부착한 후-20±2℃
냉동고(F-A125GD, LG Electronics, Korea)
에서24
시간동결시켰다.
동결중인포장지들을꺼내어실온(20℃)
에서방치하며
30
분또는60
분후튜브에서산성용액이용출됨에 따른리트머스시험지의색변화를관찰하였다.
해동이끝난후, indicator sample 20
개를대상으로이미지를캡쳐한후,
측정프 로그램을통하여측정하였고,
오차를확인하였다.
통계처리
분석결과는평균과표준편차
(mean±SD)
로나타내었으며,
각실험군간의유의성은
SPSS
프로그램(Statistical Package for Social Science, SPSS Inc., Chicago, IL, USA)
을이용하여 나타내었다.
반복측정에의한ANOVA test
로검증한후, Dun- can's multiple range test
를통하여P<0.05
수준에서유의성을 비교하였다.
결과 및 고찰
수산물은저장과정중선도저하가빠르게일어나기때문에
FPC
에서는냉동보관하여가공·
유통을하는시스템을갖추고있다
.
따라서,
냉동보관시스템의철저한관리를위해서는이 를시각적으로간편하게판별할수있는TTI
의개발이필요하 다.
현재식품에서의TTI
의적용가능성을파악하기위해상용 화되어있는TTI
에대한분석이이루어져왔으며(Kang et al.,
2014),
냉장수산물에서도이를이용하여 적용가능성을살펴보았다
(Park et al., 2014).
하지만,
상용화되어있는TTI
는고 가의비용문제로적용하기가어려운문제점이있어,
본연구에 서는냉동수산물의온도관리를위해간편하게판별할수있는 값싼TTI
를개발하였다.
본연구에서개발한TTI
의기본원리는
pH 4.0
범위의산성용액을푸른색리트머스시험지를붉게변하게하는시약으로사용하는것이다
.
냉동수산물보관시설 이나유통중에온도가증가하게되면,
냉동되어있는산성용액 이해동됨에따라유출되게되고시험지로확산되어색이변화 하는것을관찰하는것이다.
이에산성물질의하나인아세트산 을증류수에희석한후폴리프로필렌튜브등에넣어밀봉한후 포장재에부착하는방식으로TTI
를제작하였다.
일반적으로리 Fig. 1. Design of visible indicator with different dosage of acetic acid and tube length for storage temperature management of fro- zen fish.냉동수산물 온도 관리 TTI 개발
93
트머스시험지는산도
(pH)
의변화를쉽게측정하는도구로서,
붉은색리트머스시험지는염기성조건(pH 8.0
이상)
에서푸른 색으로색깔이변하고,
푸른색리트머스시험지는산성(pH 6.0
이하)
에서붉은색으로색깔이변한다.
식품및식품원료의해 동유무를가시적으로판별할수있는포장재에부착할수있는indicator
제조에있어서,
산성용액을담을튜브등은유연성을 갖고있는재료로제조한것이유리튜브나경화튜브보다파손 을방지할수있어효과적이었다.
Table 1
과Fig. 2 (A, B)
는해동유무판별TTI
가실온에서방 치하는동안의색변화와길이변화의정도를나타낸것이다.
산 성용액튜브의길이가길어질수록,
해동시간이길어질수록색 변화도를더명확히확인할수있었다. 1.2 cm
의튜브는30
분 동안실온에방치하였을때모두용출되어나와60
분후색변화 길이를측정하였을때,
유의적인차이가없었다.
반면에1.5 cm
와
1.8 cm
튜브에서는색변화길이의차이를가시적으로도확인할수있었다
.
특히1.8 cm
튜브는보다명확한가시적인차이 를확인할수있었다.
상용화되어있는
TTI
의경우는색변화를관찰하기위해일반적으로
CIE system
의L*, a*, b*
값으로산출을많이하지만(An and Yoo, 1999; Park et al., 2014),
본연구에서는해동후 산성용액이리트머스시험지로확산되는정도를확인해야하기때문에통상적인색차계를사용할수가없다
.
따라서, Fig.
2
에서의TTI
의색변화와시간을측정하기위해VIS
와vision
builder
를통한분석용프로그램을개발하였다.
측정대상은시간별로가장큰가시적인효과를나타낸
1.8 cm
튜브를사용한리트머스시험지
30 mm
길이를사용하였다.
먼저, VIS
를사용 하여캡쳐한이미지를1
차적으로시험지가존재하는부분만을 마스킹하였다.
그런다음,
용액이주입되는부분의좌표값은프 로그램에서edge
를감지하게되고,
색변화가일어나는패턴을 정의하여색변화패턴좌표를도출하였다.
패턴은파란색과붉 은색이같은비율로변화하는지점의색패턴으로정의하였다[Fig. 2 (C,D)].
대상TTI
의동작은선형적으로진행되기때문에TTI
시작점과,
패턴의중심좌표의거리를pixel
값으로측정한 다음, pixel
과TTI
의동작factor
를곱하여,
해동시간을산출하 였다.
사용한factor
값은0.1604 min/pixel
이였으며,
측정가능 한최소의시간은0.1604 min
이였다. TTI
를20℃
에노출한다Table 1. Length of color change in litmus during thaw periods (N=20)
Tube length (Dosage, μL) Length of color change in litmus (cm)
30 min after thawing 60 min after thawing
1.2 cm (10 μL) 0.72±0.11a1 0.73±0.16a
1.5 cm (30 μL) 1.03±0.09b,x2 1.24±0.09b,y
1.8 cm (50 μL) 1.19±0.08c,x 2.62±0.21c,y
Thawing temperature was 20℃. 1Means in the same column with various superscripts (a-c) are significantly different (P<0.05). 2Means in the same row with various superscripts (x-y) are significantly different (P<0.05).
Fig. 2. Picture of thawed indicator (A, 30 min; B, 60 min) and image capture (C, 15 min; D, 60 min) for dosage of 50 µL using program.
(A)
(C)
(B)
(D)
장명기
ㆍ
홍창욱ㆍ
최재혁ㆍ
김꽃봉우리ㆍ
최정욱ㆍ
남택정ㆍ
안동현94
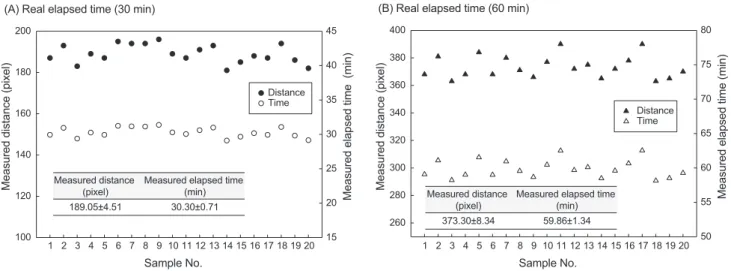
음
30
분과60
분후에분석용프로그램으로측정한결과(Fig. 3),
제작된TTI
를통해해동후시간변화를표현할수있었고, VIS
로측정한후분석용프로그램으로색변화종료지점을검출하 여,
색변화가일어나는시간을수치화가가능하였다.
따라서
,
본연구에서개발된TTI
는FPC
에서의냉동수산물 보관시설이나,
유통중에온도시스템의이상으로발생할수있 는온도증가의변화를빠르고간편하게가시적또는비가역적 으로확인하는데이용될수있고, vision
기반의detecting
프로 그램을통해정량적인데이터를수집후유통품질을관리하는 데에활용될수있을것이다.
사 사
이논문은
2017
년해양수산부재원으로한국해양과학기술진흥원의지원을받아수행된연구임
(
과제명,
지능형수산물품질 판정시스템기술개발).
References
An DJ and Yoo SS. 1999. Application of time-temperature indi- cators for cooling and frozen food storage and distribution.
Korean J Packaging Sci Technol 5, 25-29.
Endoza TFM, Welt BA, Otwell S, Teixeira AA, Kristonsson H and Balaban MO. 2004. Kinetic parameter estimation of time-temperature integrators intended for use with pack- aged fresh seafood. J Food Sci 69, FMS90-FMS96. https://
dx.doi.org/10.1111/j.1365-2621.2004.tb13377.x.
Giannakourou MC, Koutsoumanis K, Nychas GJE and Taoukis PS. 2005. Field evaluation of the application of time tem- perature integrators for monitoring fish quality in the chill chain. Int J Food Microbiol 102, 323-336. https:// dx.doi.
org/10.1016/j.ijfoodmicro.2004.11.037.
Kang JW, Choi JH, Park SY, Kim MJ, Kim MJ, Lee MH, Jung WJ and Lee SJ. 2014. Mathmatical anlysis on TTI’s estima- tion accuracy of food shelf life depending on its discrepancy in temperature dependence. Korean J Packag Sci Tech 20, 85-89.
Lee SH and Jo HY. 2011. Agriculture Forestry and Fisheries Quality Management, distribution method R&D Trends and Implications. Korea Institute of Science & Technol- ogy Evaluation and Planning. Seoul, Korea. Retrived from http://www.kistep.re.kr/c3/sub3.jsp on Oct 20, 2017.
Nuin M, Alfaro B, Cruz Z, Argarate N, George S, Le Marc Y, Olley J and Pin C. 2008. Modelling spoilage of fresh turbot and evaluation of a time-temperature integrator (TTI) label fluctuating temperature. Int J Food Microbiol 127, 193-199.
https:// dx.doi.org/10.1016/j.ijfoodmicro.2008.04.010.
Pacquit A, Crowley K and Diamond D. 2008. Smart packag- ing technologies for fish and seafood products. In: Smart Packaging Technologies for Fast Moving Consumer Goods.
Kerry J and Butler P, eds. Jon Wily & Sons Ltd., Chichester, England, 75-96.
Park SY, Kang JW, Choi JH, Kim MJ, Lee MH, Jung SW and Lee SJ. 2014. Monitoring of chilled fish quality by using time-temperature integrator (TTI): application at a mock store. Korean J Packaging Sci Technol 20, 91-96.
Tsironi T, Dermesonlouoglou E, Giannakourou M and Taoukis P. 2009. Shelf life modelling of frozen shrimp at variable temperature conditions. LWT-Food Sci Technol 42, 664- 671. https://dx.doi.org/10. 1016/j.lwt.2008.07.010.
Fig. 3. Test results of elapsed time indicator after thawing using vision builder for automated inspection. A is the test result of time-temper- ature indicator (TTI) after real thawing for 30 min and B is the test result of TTI after real thawing for 60 min.
(A) Real elapsed time (30 min)
Sample No.
1 2 3 4 5 6 7 8 9 10 11 12 13 14 15 16 17 18 19 20
Measured distance (pixel)
100 120 140 160 180 200
Measured elapsed time (min)
15 20 25 30 35 40 45
Distance Time
(B) Real elapsed time (60 min)
Sample No.
1 2 3 4 5 6 7 8 9 10 11 12 13 14 15 16 17 18 19 20
Measured distance (pixel)
260 280 300 320 340 360 380 400
Measured elapsed time (min)
50 55 60 65 70 75 80
Distance Time
Measured distance
(pixel) Measured elapsed time (min)
189.05±4.51 30.30±0.71 Measured distance
(pixel) Measured elapsed time (min) 373.30±8.34 59.86±1.34