1. Introduction
Extreme climate change events have caused damage worldwide. According to IPCC 5th Assessment Report,
flooding damage associated with heavy rain or landslides has increased globally by approximately 88%. Frequent local downpours occur frequently every summer in East Asia including China, Korea and Japan,
Comparison of SAR Backscatter Coefficient and Water Indices for Flooding Detection
Yunjee Kim
1)· Moung-Jin Lee
2)†Abstract: With the increasing severity of climate change, intense torrential rains are occurring more frequently globally. Flooding due to torrential rain not only causes substantial damage directly, but also via secondary events such as landslides. Therefore, accurate and prompt flood detection is required. Because it is difficult to directly access flooded areas, previous studies have largely used satellite images. Traditionally, water indices such as the normalized difference water index (NDWI) and modified normalized difference water index (MNDWI) which are based on different optical bands acquired by satellites, are used to detect floods. In addition, as flooding likelihood is greatly influenced by the weather, synthetic aperture radar (SAR) images have also been used, because these are less influenced by weather conditions. In this study, we compared flood areas calculated from SAR images and water indices derived from Landsat-8 images, where the images were acquired at similar times.
The flooded area was calculated from Landsat-8 and Sentinel-1 images taken between the end of May and August 2019 at Lijiazhou Island, China, which is located in the Changjiang (Yangtze) River basin and experiences annual floods. As a result, the flooded area calculated using the MNDWI was approximately 21% larger on average than that calculated using the NDWI. In a comparison of flood areas calculated using water indices and SAR intensity images, the flood areas calculated using SAR images tended to be smaller, regardless of the order in which the images were acquired. Because the images were acquired by the two satellites on different dates, we could not directly compare the accuracy of the water-index and SAR data. Nevertheless, this study demonstrates that floods can be detected using both optical and SAR satellite data.
Key Words: Flood, Sentinel-1, Landsat-8, Normalized Difference Water Index (NDWI), Modified Normalized Difference Water Index (MNDWI)
Letter
Received August 13, 2020; Revised August 18, 2020; Accepted August 21, 2020; Published online August 25, 2020
1)
Researcher, Environmental Assessment Group, Korea Environment Institute
2)
Director, Center for Environmental Data Strategy, Korea Environment Institute
†
Corresponding Author: Moung-Jin Lee ([email protected])
This is an Open-Access article distributed under the terms of the Creative Commons Attribution Non-Commercial License
(http://creativecommons.org/licenses/by-nc/3.0) which permits unrestricted non-commercial use, distribution, and reproduction in
any medium, provided the original work is properly cited.
and in particular local downpours have been more severe than usual for more than a month since June 2020. The Changjiang (Yangtze) River which passes through central China, is the third-longest river in the world, after the Nile River and Amazon River. The Changjiang River floods every year, causing substantial damage. As of 2014, the Three Gorges Dam (TGD), which is located in the middle part of the Changjiang River, is one of the largest dam in the world (Dai et al., 2014). The TGD attracted controversy due to its perceived lack of stability even before construction started. Because local downpours have been more severe than usual in 2020, there is great concern that the dam will collapse. The TGD greatly influences drought and flooding in the areas along the Changjiang River, affecting people living in the Changjiang River basin, salinity levels in the East China Sea and East Sea, and the ecosystems associated with the river (Yang et al., 2006). In Korea, torrential downpours continued for several days from the end of June, 2020, leading to a period of heavy rainfall. As a result, on August 3, 2020, the warning level was upgraded to “severe” given the additional torrential rain anticipated (Ministry of the Interior and Safety (MOIS) Press release, 2020). Flood damage resulting from this type of rainfall event occurs over a broad area. Currently, floods are occurring more frequently than in the past, resulting in large-scale damage. It is more efficient to survey these areas via remote sensing, using satellite images that capture large areas at regular intervals. Accordingly, several previous studies have relied on satellite imagery (Chini et al., 2017; Martinis et al., 2013; Ogilvie et al., 2015;
Schlaffer et al., 2015; Sivanpillai et al., 2020). Globally, a number of satellites are available, with the surface water detection method (based on calculating water indices using a combination of different bands from an optical satellite) commonly employed. And several recent studies have also used the flood pixel detection method which is based on backscatter coefficient of SAR intensity images. The advantage of optical images
is that the subject is captured as it actually appears; thus, visual analysis of the images is more intuitive.
However, usable optical images are not easy to obtain as the capture process is significantly affected by cloud cover (Refice et al., 2014; Uddin et al., 2019). In addition, floods change rapidly. As such, prompt detection of floods is important, but is can be difficult to acquire cloud-free images in a timely manner. In contrast to optical images, SAR images are largely unaffected by weather. Hence, many precedent studies regarding flooding using such images have been carried out (Martinez et al., 2007; Martinis et al., 2015).
This study aims to compare flood detection results from the normalized difference water index (NDWI), modified normalized difference water index (MNDWI), and backscatter coefficients derived from SAR intensity images. Lijiazhou Island, which is located in the Changjiang River basin where flooding occurs to some extent every summer, was selected as the study area. In the Changjiang River basin, flood damage occurs regularly. Lijiazhou Island is a suitable site for time series analysis, as flooding starts at the end of May / early June every year, and reaches a maximum at the end of July (after which the water drains away rapidly).
This pilot study will inform a future time-series analysis. Here, we aimed to determine whether flooding in the study area could be monitored over time and compared the flood detection results of methods based on water indices and backscatter coefficients.
Specifically, this study attempted to detect changes in flooding based on data derived from Landsat-8 and Sentinel-1 images acquired between June and September of 2019 at 1-month intervals.
2. Study area and Dataset
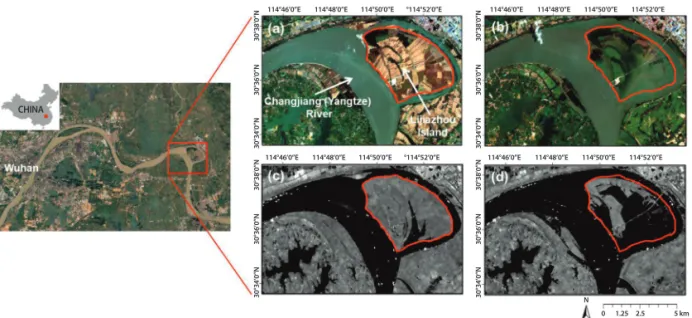
Lijiazhou Island is located at the center part of Changjiang River, approximately 55 km west of Wuhan;
it is completely surrounded by the river (Fig. 1). On the
island which area is 2048.83 ha, cropland accounts for more than 92% of the land area, and most of the terrain consists of lowland (average altitude of 21.2 m). Due to its geographic characteristics, flooding occurs here every summer. Aside from a bridge, there are few artificial structures on the island; thus, damage on the island is not significant. However, according to the Chinese Academy of Sciences (2016), large-scale harbor construction is scheduled to take place in the area. Therefore, it is important that flood occurrence, duration, and changes be monitored.
Almost no flooding was detected in the satellite image of the study area acquired on May 22, 2019, but flooding was in progress 5 days later (May 27) (Fig.
1(c)). The flooded area increased gradually, and more than 60% of the study area was flooded in images acquired on July 24 and July 25 (Fig. 1(b), (d)).
In this pilot study, we aimed to monitor flooding on Lijiazhou Island based on two water indices (NDWI and MNDWI) and backscatter coefficients. To this end, four Sentinel-1 GRD images and four Landsat-8 images captured between May and September 2019 at intervals of approximately 1 month were used. The monthly flood status based on these images is described in Table 1.
Sentinel-1 captures and provides most of the mid- latitude regions with dual polarization (VV + VH).
According to previous study, it was confirmed that Fig. 1. Images of the study area (red outline) before flooding occurred and during the maximum flood period, acquired
from Landsat-8 on (a) May 22 and (b) July 25, 2019, and from Sentinel-1 on (c) May 27 and (d) July 26, 2019.
CHINA
114°46’0”E 114°48’0”E 114°50’0”E °114°52’0”E 114°46’0”E 114°48’0”E 114°50’0”E 114°52’0”E
30°34’0”N30°36’0”N
N
0 1.25 2.5 5 km
30°34’0”N30°36’0”N
30°34’0”N30°36’0”N30°38’0”N 30°34’0”N30°36’0”N30°38’0”N
Table 1. Monthly flood status in 2019 based on Landsat-8 and Sentinel-1 data
Month Date
(YYYY.MM.DD) Time
(UTC) Satellite Resolution
(m) Flood status
May 2019.05.22 02:49:45.9813780Z Landsat-8 30 Pre-flood
2019.05.27 10:19:30.828440-10:19:55.827007 Sentinel-1A 10 In progress June 2019.06.20 10:19:32.123221-10:19:57.121494 Sentinel-1A 10 In progress
2019.06.23 02:49:59.6635900Z Landsat-8 30 In progress
July 2019.07.25 02:50:07.7098820Z Landsat-8 30 Peak flooding
2019.07.26 10:19:34.403579-10:19:401474 Sentinel-1A 10 Peak flooding
August 2019.08.17 02:56:27.0051780Z Landsat-8 10 Floods diminishing
2019.08.19 10:19:36.038117-10:20:01.035975 Sentinel-1A 30 Floods diminishing
floods were better detected in VV polarization data than VH polarization data (Refice et al., 2014). Therefore, VV polarization data was used in this study.
Additionally, NASA Shuttle Radar Topography Mission (SRTM) Digital Elevation Model (DEM) and 2017 land-cover data were used (Fig. 2). The land- cover dataset included data sampled in 2015 at a resolution of 30 m which were then resampled to 10 m resolution in 2017 (Gong et al., 2019). Sentinel-1 GRD images were used after resampling to a 10 m resolution to ensure compatibility with the land-cover data, and for more efficient calculations.
3. Methods
Each satellite image was preprocessed: backscatter coefficients were extracted from SAR images and water indices from Landsat-8 images.
1) Water area extraction from NDWI and MNDWI
For Landsat images, the top of atmosphere (TOA) reflectance was calculated using the atmospheric correction method provided by NASA, as follows:
ρ
λ′ = M
l·Q
c+ A
l(1) where ρ
λ′ is the TOA reflectance, M
lis the band- specific multiplicative rescaling factor, Q
cis the
quantized and calibrated standard product pixel value (DN) and A
lis the band-specific additive rescaling factor. The values were acquired from the metadata.
ρ
λ= ρ
λ′·cosec(θ
SEA) (2) In this study, ρ
λvalues for which solar angle was considered in previous TOA reflectance calculations were used.
The NDWI was designed by McFeeters (1996) and is the most basic index that extracts water. It is calculated using the following equation (McFeeters, 1996):
NDWI = (3) This index was designed to maximize water reflectance using green and NIR wavelengths, and has been used in many previous studies to detect water pixels (Ganaie et al., 2013; Gautam et al., 2015; Han- Qiu et al., 2005).
The MNDWI is a water index designed to compensate for the shortcomings, which are increasing the reflectance of both built-up land and water pixels, of the NDWI. The MNDWI is calculated using the following equation (Xu, 2006):
MNDWI = (4) An α-stable distribution was fitted to the histogram calculated for each index, and the point at which the histogram and fitting curve intersected was taken as the
Green – NIR Green + NIR
Green – MIR Green + MIR Fig. 2. The characteristic of the geographic and land cover in study area. (a) DEM, (b) land cover.
114°46’0”E 114°48’0”E 114°50’0”E °114°52’0”E 114°46’0”E 114°48’0”E 114°50’0”E 114°52’0”E
30°34’0”N30°36’0”N30°38’0”N 30°34’0”N30°36’0”N30°38’0”N
N N
0 1.25 2.5 5 km
Bareland Impervious surface Water
Wetland Grassland Forest Cropland
0 1.25 2.5 5 km 0 50
DEM [m]
values at intersection points were taken as threshold values. Additionally, the proportion of each image occupied by water varied; therefore, each histogram was derived using data acquired over four time periods.
In May, water occupied less than 2% of the image;
hence, threshold values could not be determined based on the histogram distribution. Therefore, the threshold values calculated for June were used instead.
2) Water area extraction from Sentinel-1 backscatter coefficient
Sentinel-1 GRD data include noise, such as thermal and speckle noise; thus, calibration needs to be carried out in advance. Preprocessing, including basic thermal noise removal and radiometric/geometric calibration, was conducted using Sentinel application platform (SNAP) software. After basic preprocessing, speckle noise was calibrated using a non-local (NL) filter, which removed noise while maintaining the geometric features in the image so that it is suitable for flood detection (Kim et al., 2020).
After basic preprocessing, as described above, noise was removed using an NL filter to obtain more accurate results. Because the NL filter can remove noise while maintaining the geometric characteristics of an image, it effectively removed speckle noise from the SAR images. It is important to calibrate for speckle noise, as water appears to be shaded in SAR images. Thus, the accuracy of the results depends on how well speckle noise has been calibrated for.
After applying the NL filter, the value at the point at which an α-stable distribution intersected with the intensity histogram was set as the threshold value, just as the method used for the water indices. Because water is represented by relatively low values in the negative parts (in dB) in an intensity image, only negative values at the intersection points were taken as threshold values.
In July, the proportion of the intensity image occupied
histogram could not be fitted properly. Therefore, the α-stable distribution was fitted after values of less than -20 dB were excluded from the histogram derived from the intensity images captured in July.
4. Results
In this study, water areas calculated using the two water indices and SAR intensity images were compared. Because flood characteristics tend to change rapidly, it is very important to use data collected the same time period when using different data types. Due to the different revisit time of two different satellites and the limitations in the availability of usable data with low cloud cover, the data obtained at the similar time as possible among the available data were used.
According to the results obtained from the intensity images and two water indices, flooding was in progress in June, 2019 and peak flooding occurred in July with over 60% of the study area being covered by floodwater. Thereafter, a large amount of floodwater drained away in August (Fig. 3(b)-(d), (f)-(h), (j)-(l)).
The sampling dates of two satellites differed by only 1-3 days from June to August, and the results did not differ significantly between the satellites. However, in May, the acquisition dates differed by 5 days, and the results were significantly different. Water was detected from only less than 30% of the water and wetland area in the land-cover of the Landsat-8 images acquired on May 22 (Fig. 3(e), (i)). By contrast, in the SAR intensity image acquired on May 27, water was detected in the most portion of water and wetland area (Fig. 3(a)).
Hence, flooding occurred after May 22 and progressed quickly thereafter mainly around the wetlands.
Except in June data, Landsat data were acquired
before Sentinel data. Landsat data were acquired 5 days
earlier in May, a day earlier in July, and 2 days earlier
Fig. 3. Flood areas calculated from SAR intensity images acquired on (a) May 27, (b) June 20, (c) July 26, and (d) August 19, 2019; from the NDWI based on Landsat-8 images acquired on (e) May 22, (f) June 23, (g) July 25, and (h) August 17, 2019; and from (i-l) the MNDWI based on Landsat-8 images acquired on the same dates as for the NDWI.
Fig. 4. Comparison of flood area between SAR data and Landsat data.
114°46’0”E 114°48’0”E 114°50’0”E 114°52’0”E 114°46’0”E 114°48’0”E 114°50’0”E 114°52’0”E 114°46’0”E 114°48’0”E 114°50’0”E 114°52’0”E
114°46’0”E 114°48’0”E 114°50’0”E 114°52’0”E 114°46’0”E 114°48’0”E 114°50’0”E 114°52’0”E 114°46’0”E 114°48’0”E 114°50’0”E 114°52’0”E
114°46’0”E 114°48’0”E 114°50’0”E 114°52’0”E 114°46’0”E 114°48’0”E 114°50’0”E 114°52’0”E 114°46’0”E 114°48’0”E 114°50’0”E 114°52’0”E
114°46’0”E 114°48’0”E 114°50’0”E 114°52’0”E 114°46’0”E 114°48’0”E 114°50’0”E 114°52’0”E 114°46’0”E 114°48’0”E 114°50’0”E 114°52’0”E 30°38’0”N30°36’0”N30°34’0”N30°38’0”N30°36’0”N30°34’0”N30°38’0”N30°36’0”N30°34’0”N30°38’0”N30°36’0”N30°34’0”N 30°38’0”N30°36’0”N30°34’0”N30°38’0”N30°36’0”N30°34’0”N30°38’0”N30°36’0”N30°34’0”N30°38’0”N30°36’0”N30°34’0”N 30°38’0”N30°36’0”N30°34’0”N30°38’0”N30°36’0”N30°34’0”N30°38’0”N30°36’0”N30°34’0”N30°38’0”N30°36’0”N30°34’0”N
N
0 1.25 2.5 5 km
1400
1200
1000
800
600
400
200 Water+Wetland Water
MAY JUN JUL AUG Month
A re a [ h a ]
σ0 NDWI MNDWI