Changes in the Cesarean Section Rate in Korea (1982–2012) and a Review of the Associated Factors
Although Cesarean section (CS) itself has contributed to the reduction in maternal and perinatal mortality, an undue rise in the CS rate (CSR) has been issued in Korea as well as globally. The CSR in Korea increased over the past two decades, but has remained at approximately 36% since 2006. Contributing factors associated with the CSR in Korea were an improvement in socio-economic status, a higher maternal age, a rise in multiple pregnancies, and maternal obesity. We found that countries with a no-fault compensation system maintained a lower CSR compared to that in countries with civil action, indicating the close relationship between the CSR and the medico-legal system within a country. The Korean government has implemented strategies including an incentive system relating to the CSR or encouraging vaginal birth after Cesarean to decrease CSR, but such strategies have proved ineffective. To optimize the CSR in Korea, efforts on lowering the maternal childbearing age or reducing maternal obesity are needed at individual level. And from a national view point, reforming health care system, which could encourage the experienced obstetricians to be trained properly and be relieved from legal pressure with deliveries is necessary.
Keywords: Cesarean Section Rate; Korea; Statistics; Trends Sung-Hoon Chung,1* Hyun-Joo Seol,2*
Yong-Sung Choi,1 Soo-young Oh,3 Ahm Kim,4 and Chong-Woo Bae1 Departments of 1Pediatrics, and 2Obstetrics and Gynecology, Kyung Hee University School of Medicine, Seoul; 3Department of Obstetrics and Gynecology, Samsung Medical Center, Sungkyunkwan University School of Medicine, Seoul; 4Department of Obstetrics and Gynecology, Asan Medical Center, University of Ulsan College of Medicine, Seoul, Korea
*Sung-Hoon Chung and Hyun-Joo Seol equally contributed as the first author in this study.
Received: 17 May 2014 Accepted: 2 July 2014 Address for Correspondence:
Chong-Woo Bae, MD
Department of Pediatrics, Kyung Hee University Hospital at Gangdong, 892 Dongnam-ro, Gangdong-gu, Seoul 134-727, Korea
Tel: +82.2-440-6130, Fax: +82.2-440-7175 E-mail: [email protected]
http://dx.doi.org/10.3346/jkms.2014.29.10.1341 • J Korean Med Sci 2014; 29: 1341-1352
INTRODUCTION
The Cesarean section rate (CSR) is percentage of the number of Cesarean section (CS) deliveries among the total number of de- liveries. In 1985, the World Health Organization (WHO) stated that the countries with some of the lowest perinatal mortality rates have a low CSR—less than 10% (1)—and then cautioned that the rising CSR would be reduced to an acceptable level (2, 3).
Despite the WHO’s recommendation, global data shows a rise in the CSR over the past 30 yr due to a rise in primiparas, higher ma- ternal age, universal use of electronic fetal heart rate monitoring, increased CSs of breech presentation, and increased CS on ma- ternal request (4).
The Korean Health Insurance Review and Assessment Service (KHIRA) has published a “Cesarean delivery evaluation report”
every year since 2001 and published through its website, repre- senting the official Korean data, and supplied this information to the Organisation for Economic Co-operation and Develop- ment (OECD). It is an annual report targeting all medical insti- tutions involved with deliveries for the purpose of providing in- formations about selecting the most appropriate medical ser- vice for consumers, preventing childbirth-related complications, improving national health, and, ultimately, reducing the CSR.
KHIRA evaluates and ranks medical institutions according to a 9-grade system of classification. Medical institutions graded two places from the bottom receive financial penalties. This policy was initially successful but later had a negligible effect on reduc- ing the CSR. As a result, the CSR has stabilized but remains at a high level in Korea (5).
At present, there is no representative study describing the cur- rent status of the CSR in Korea. We evaluated the CSR during re- cent decades by comparing data from Korea with those from OECD countries and analyzed contributing factors associated with the CSR in Korea. We also provide basic reference about the CSR, investigate the activities to reduce the Korean CSR, and try to find ways of reducing the CSR.
DATA COLLECTION
We gathered our data from reports published by a national agen- cy in Korea from 1982 to 2012. Data prior to 2000 were obtained from “Cesarean delivery survey in Korea (2000)” (6) published by the Korean National Health Insurance System (KNHIS) and from the “National survey on fertility and family health and welfare in Korea (2003)” (7), published by the Korea Institute for Health and Social Affairs (KIHSA). Data from 2001 to 2012 were obtained Obstetrics & Gynecology
from “Cesarean delivery evaluation report” (KHIRA, 2013) (8) and “Social indicators in Korea” by Statistics Korea (2012) (9).
The data from KNHIS and KIHSA before 2000 were based only on the local survey, not the national survey. However, the survey conducted by KHIRA since 2001 has been worthy of note as a national complete enumeration survey. We used annual data regarding the total number of live births, multiple births,
multiple birth deliveries, and multiple birth rates as published by the Korean Statistical Information Service of Statistics Korea (10). All of the data sources defined the CSR as percentage of the number of CS deliveries among the total number of deliveries.
We analyzed the annual data on total number of live births, mul- tiple births, multiple birth deliveries, total deliveries, vaginal de- liveries, and CS deliveries. We investigated annual changes in the CSR and the CSR in primiparas, the CSR by maternal age, medical institutions, and districts.
We checked the CSR of OECD countries (34 member coun- tries in January 2014) using OECD health data from 1990 to 2012 (11). The CSR from OECD countries were calculated from CS surgical procedures per 100 live births (OECD-CS-SPR), unlike Korean reports. We also compared the mean values of the an- nual CSR of OECD countries with those of Korea.
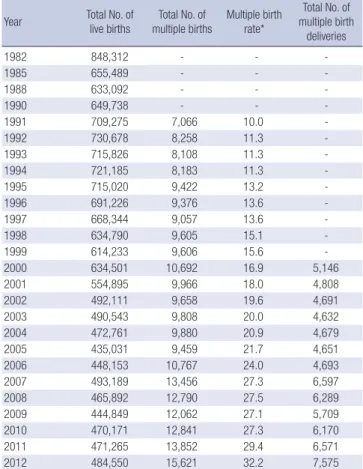
BIRTHS, DELIVERIES, AND THE CSR IN KOREA Total number of live births, multiple births, multiple birth deliveries, and multiple birth rates in Korea (1982-2012) Table 1 shows the total number of live births, multiple births, and multiple birth deliveries in Korea from 1982 to 2012. Remark- ably, the total number of live births decreased from 848,312 in 1982 to 484,550 in 2012. However, the total number of multiple births increased from 7,066 in 1991 to 15,621 in 2012; as a result, multiple birth rates (the number of multiple births per 1,000 live births) increased from 10.0 in 1991 to 32.2 in 2012—more than a three-fold rise.
The trend in childbearing age in Korea
According to data from Statistics Korea, the mean childbearing age in Korea rose steadily from 29.5 in 2002 to 31.8 in 2013, as shown in Table 2. The percentage of pregnant women aged over 35 yr increased rapidly from 8.3% in 2003 to 20.2%—one in five mothers—in 2013. This ratio for maternal age is the highest in Table 1. The total number of live births, multiple births, and multiple birth deliveries
in Korea (1982-2012)
Year Total No. of
live births
Total No. of multiple births
Multiple birth rate*
Total No. of multiple birth
deliveries
1982 848,312 - - -
1985 655,489 - - -
1988 633,092 - - -
1990 649,738 - - -
1991 709,275 7,066 10.0 -
1992 730,678 8,258 11.3 -
1993 715,826 8,108 11.3 -
1994 721,185 8,183 11.3 -
1995 715,020 9,422 13.2 -
1996 691,226 9,376 13.6 -
1997 668,344 9,057 13.6 -
1998 634,790 9,605 15.1 -
1999 614,233 9,606 15.6 -
2000 634,501 10,692 16.9 5,146
2001 554,895 9,966 18.0 4,808
2002 492,111 9,658 19.6 4,691
2003 490,543 9,808 20.0 4,632
2004 472,761 9,880 20.9 4,679
2005 435,031 9,459 21.7 4,651
2006 448,153 10,767 24.0 4,693
2007 493,189 13,456 27.3 6,597
2008 465,892 12,790 27.5 6,289
2009 444,849 12,062 27.1 5,709
2010 470,171 12,841 27.3 6,170
2011 471,265 13,852 29.4 6,571
2012 484,550 15,621 32.2 7,575
Birth statistics by Statistics Korea (9). *Multiple birth rate/1,000 live births.
Table 2. Comparison of the mean maternal age by true birth order in England (and Wales) and Korea (2002-2013)
Year All births True birth order
First Second Third Fourth
England Korea England Korea England Korea England Korea England Korea
2013 - 31.8 - 30.7 - 32.6 - 34.4 - 34.4
2012 29.8 31.6 30.7 30.5 32.0 32.4 32.7 34.2 33.4 34.2
2011 29.7 31.4 30.6 30.3 32.1 32.2 32.8 34.1 33.4 34.1
2010 29.6 31.3 30.5 30.1 32.0 32.0 32.7 34.0 33.4 34.0
2009 29.5 31.0 30.4 29.9 32.0 31.8 32.6 33.9 33.4 33.9
2008 29.5 30.8 30.3 29.6 31.9 31.7 32.6 33.8 33.4 33.8
2007 29.5 30.6 30.3 29.4 91.9 31.5 32.6 33.6 33.4 33.6
2006 29.5 30.4 30.2 29.3 31.8 31.3 32.6 33.5 33.2 33.5
2005 29.5 30.2 30.1 29.1 31.7 31.0 32.5 33.3 33.3 33.3
2004 29.4 30.0 30.0 28.8 31.6 30.8 32.5 33.1 33.2 33.1
2003 29.4 29.7 29.9 28.6 31.5 30.4 32.5 32.9 33.1 32.9
2002 29.3 29.5 29.7 28.3 31.4 30.2 32.3 32.7 33.1 32.7
Statistics Korea, Korean Statistical Information Service (10), and Office for National Statistics (births in England and Wales) (13).
Korea
England
USA
<20 20-24 25-29 30-34 35-39 40-44 ≥45
0 10 20 30 40 50 60 70 80 90 100 (%)
5.1
4.6
7.7
2.3
15.3
12.0 26.2
17.9
23.2
49.4
27.7
28.4
16.3
29.3
25.6 0.6
0.1
1.6
0.3 3.6
2.8
Mean maternal age: 31.6
Mean maternal age: 29.8
Mean maternal age: 25.8
Fig. 2. Maternal age at birth in the USA, England, and Korea in 2012 (10, 14, 15).
The mean maternal age was higher in Korea (31.6 yr) compared to that in the USA (25.8 yr) and England (29.8 yr) in 2012.
Mexico Latvia
BulgariaRomaniaLithuania United Sta
tes
Extonia PolandIceland Slovak Republic
Israel (3)Hungar y
Czech Republic
NorwayAustriaCanada Cyprus (1,
2) FinlandBelgium
OECD a vera
ge
New ZealandPortugalAustraliaSlovenia IrelandSwedenDenmark FranceGreece Netherlands
Japan LuxembourgSwitzerland
Spain Korea Italy German
y
United Kingdom 31
30 29 28 27 26 25 24 23 22 21
Fig. 1. Mean age of the women at the birth of the first child in 2009 (12). (Modified using the OECD report by updating the Korean data). The mean age was higher in Korea (29.9 yr) compared to that in OECD countries (27.8 yr) in 2009.
27.8
29.9
the world and represents a very serious problem in Korea, which is yet to be resolved (10).
Fig. 1 shows the mean childbearing age at the birth of the first child in OECD countries in 2009. The mean childbearing age is 29.9 yr in Korea, which ranks fourth from the highest, 27.8 for OECD countries, and 25.0 in the United States. The United King- dom ranks first with a mean age of 30.0 (12).
Table 2 compares the mean maternal age by true birth order in England and Korea. England shows negligible change—from a mean of 29.3 in 2002 to 29.8 in 2012—whereas Korea shows noticeable change—from a mean of 29.5 in 2002 to 31.6 in 2012 and 31.8 in 2013 (10, 13).
Fig. 2 demonstrates the maternal age at birth in the United States, England, and Korea (10, 14, 15). The percentage of wom- en aged 30-34 yr is 25.6% for the United States and 29.3% for England, but Korea shows a very high percentage at 49.4%. Ko- rea also shows the highest percentage (16.3%) of women aged 35-39 yr among three countries and higher mean maternal age (31.6 yr) than the United States (25.8 yr) and England (29.8 yr).
Changes in the total number of deliveries, vaginal deliveries, CS deliveries, CSR, and CSR in primiparas in Korea (1982-2012)
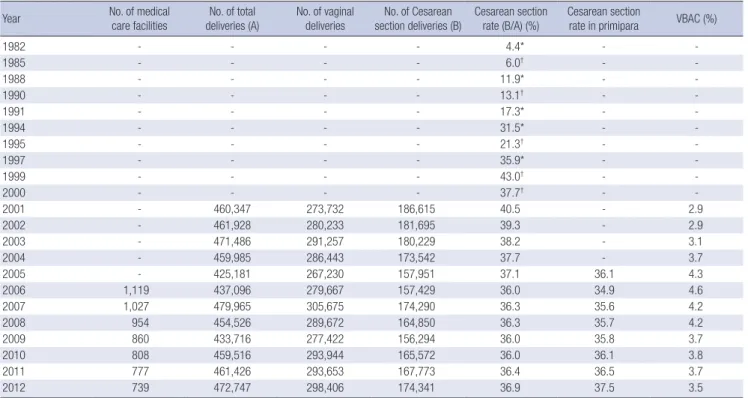
The number of maternity units including all tertiary and general hospitals, private clinics, midwifery clinics, and public health centers decreased largely from 1,119 in 2006 to 739 in 2012, while the number of total deliveries increased slightly from 460,347 in 2001 to 472,747 in 2012, as shown in Table 3 (6-9). The number of vaginal deliveries showed a very small rise from 273,732 in 2001 to 298,406 in 2012. On the contrary, CS deliveries showed a slight reduction for the same period—from 186,615 to 174,341. The CSR increased from 4.4% in 1982 to 43% in 1999 and then gradu- ally decreased to 36% in 2006. Since 2006, the CSR has remained virtually unchanged. The CSR in primiparas decreased from
36.1% in 2005 to 34.9% in 2006 and then slightly increased to 37.5% in 2012. Vaginal birth after Cesarean (VBAC) is the propor- tion of mothers who delivered vaginally after CS deliveries. VBAC increased from 2.9% in 2001 to 4.6% in 2006 and then decreased to 3.5% in 2012.
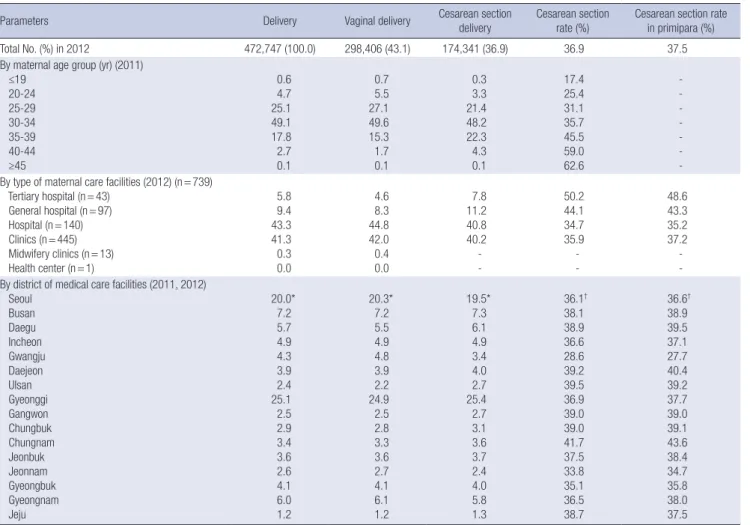
Analysis of the CSR by maternal age and type/location of maternity units in Korea (2011-2012)
Table 4 shows changes in the CSR with maternal age and type/
location of maternity units in Korea (2011-2012). In 2011, the per- centage of deliveries by maternal age range was as follows: 0.6%
in women aged≤19 yr, 4.7% in women aged 20-24 yr, 25.1% in women aged 25-29 yr, 49.1% in women aged 30-34 yr, 17.8% in women aged 35-39 yr, 2.7% in women aged 40-44 yr, and 2.7% in women aged≥45 yr. The number of deliveries for women aged over 35 yr was 20.6%. The CSR by maternal age range was as fol- lows: 17.4% in women aged≤19 yr, 25.4% in women aged 20–24
yr, 31.1% in women aged 25–29 yr, 35.7% in women aged 30–34 yr, 45.5% in women aged 35-39 yr, 59.0% in women aged 40–44 yr, and 62.6% in women aged≥45 yr. The CSR increased with mater- nal age. The CSR for women aged over 35 yr was 47.8%. For the same period, the CSR by maternal age in the United States was as follows: 22.4% in women aged≤19 yr, 28.0% in women aged 20–
24 yr, 31.5% in women aged 25–29 yr, 35.7% in women aged 30–
34 yr, 45.5% in women aged 35-39 yr, 49.2% in women aged≥40 yr (14). Again, the CSR increased with maternal age (14). The CSR for both countries was similar for women aged 24-34 yr, but in Korea, the CSR was higher in women aged over 35 yr (10). In 2012, the percentage of deliveries by type of maternity units was as follows: tertiary hospitals 5.8%, general hospitals 9.4%, and hospitals 43.3%, private clinics 41.3%, midwifery clinics 0.3%, and public health centers 0.0%. The highest proportion of deliv- eries occurred in hospitals and private clinics. The CSR by mater- nity units was as follows: tertiary hospitals 50.8%, general hospi- tals 44.1%, hospitals 34.7%, and private clinics 35.9%. The highest CSR occurred in tertiary hospitals, where CS deliveries comprised about half of all deliveries. The CSR by maternity units for primip- aras was as follows: tertiary hospitals 48.6%, general hospitals 43.3%, hospitals 35.2%, and private clinics 37.2%.
In terms of geographical location of maternity units, in 2012 the three highest CSR occurred in Chungcheongnam-do (41.7%), Ulsan (39.5%), Daejeon (39.2%), and while the three lowest CSR
occurred in Gwangju (28.6%), Jeollanam-do (33.8%), and Gyeongsangbuk-do (35.1%). The CSR is higher than 34% for all regions of Korea except Gwangju.
COMPARISON OF THE OECD-CESAREAN SECTION SURGICAL PROCEDURES IN OECD COUNTRIES (1990–2011) AND IN KOREA (2001–2011), AND ITS RELATIONSHIP WITH THE MEDICO-LEGAL SYSTEM
OECD-CS SPR in Korea (2001-2011)
The CSR in OECD countries is calculated by CS surgical proce- dure as per 100 live births (OECD-CS SPR). For Korea, the OECD-CS SPR was 33.6 in 2001, 36.9 in 2002, 36.7 in 2003 and 2004, 36.3 in 2005, 35.1 in 2006, 35.4 in 2007 and 2008, 35.1 in 2009, and 35.2 in 2010 and 34.6 in 2011 (Table 5) (11).
OECD-CS SPR in OECD countries (1990-2011)
Table 5 shows the trend of OECD-CS SPR in OECD countries from 1990 to 2011. In 2011, the mean OECD-CS SPR was 26.9.
According to the most recent data, the five countries ranked highest for OECD-CS SPR were Mexico (49.0), Turkey (46.2), Chile (37.7), Italy (37.7), and Portugal (34.8), while Korea (34.6) was ranked sixth. Northern European countries such as Iceland (14.7), Netherland (15.6), Finland (16.2), Sweden (16.2), and Table 3. Cesarean section rate in Korea (1982-2012)
Year No. of medical
care facilities No. of total
deliveries (A) No. of vaginal
deliveries No. of Cesarean
section deliveries (B) Cesarean section
rate (B/A) (%) Cesarean section
rate in primipara VBAC (%)
1982 - - - - 4.4* - -
1985 - - - - 6.0† - -
1988 - - - - 11.9* - -
1990 - - - - 13.1† - -
1991 - - - - 17.3* - -
1994 - - - - 31.5* - -
1995 - - - - 21.3† - -
1997 - - - - 35.9* - -
1999 - - - - 43.0† - -
2000 - - - - 37.7† - -
2001 - 460,347 273,732 186,615 40.5 - 2.9
2002 - 461,928 280,233 181,695 39.3 - 2.9
2003 - 471,486 291,257 180,229 38.2 - 3.1
2004 - 459,985 286,443 173,542 37.7 - 3.7
2005 - 425,181 267,230 157,951 37.1 36.1 4.3
2006 1,119 437,096 279,667 157,429 36.0 34.9 4.6
2007 1,027 479,965 305,675 174,290 36.3 35.6 4.2
2008 954 454,526 289,672 164,850 36.3 35.7 4.2
2009 860 433,716 277,422 156,294 36.0 35.8 3.7
2010 808 459,516 293,944 165,572 36.0 36.1 3.8
2011 777 461,426 293,653 167,773 36.4 36.5 3.7
2012 739 472,747 298,406 174,341 36.9 37.5 3.5
Cesarean delivery survey in Korea (2000) by Korea National Health Insurance Service (6). Cesarean section rate is the number of Cesarean section deliveries among the total number of deliveries, expressed as a percentage. *The 2003 national survey on fertility and, family health and welfare in Korea by the Korea Institute for Health and Social Af- fairs (7); †Cesarean delivery evaluation report in Korea (2013) by the Korea Health Insurance Review and Assessment Service (8), and social indicators in Korea (2013) by Sta- tistics Korea (9). VBAC, vaginal birth after cesarean.
Norway (16.5) ranked low for OECD-CS SPR (11).
Comparison of the OECD-CS SPR in Korea and the mean OECD-CS SPR by yr (2001-2011)
Fig. 3 compares the OECD-CS SPR of Korea with the mean OECD-CS SPR from 2001 to 2011. In Korea, the OECD-CS SPR was 33.6 in 2001, rose to 35.4 in 2007 and 2008, and decreased slightly to 34.6 in 2011. The mean OECD-CS SPR rose from 20.2 in 2001 to 26.9 in 2011. However, the mean OECD-CS SPR in Korea was higher every year than the mean overall OECD-CS SPR (11).
The relationship between the OECD-CS SPR and the medico-legal system
To understand the relationship between the CSR and the medi- co-legal system, we analyzed the correlation between the re- sponsibility of doctors and the CSR within the medico-legal sys- tem, focusing on six OECD countries and Korea (Fig. 4) (11, 16, 17). The OECD-CS SPR in Sweden has remained stable at < 20 (12.1 in 1998 and 16.2 in 2011)—partially owing to the no-fault
compensation system for legal damages. Meanwhile, the OECD- CS SPR of the United States and Australia and Korea—with civil litigation system by fault liability—is increasing gradually: 32.8 and 32.2, respectively, in 2011.
POLICIES AND PERSPECTIVES FOR CS DELIVERY IN KOREA
Principal findings of this study
The main results of this study are summarized as follows. 1) The number of live births in Korea has decreased markedly—by 43%
—over a recent 30-yr period, and the number of medical facili- ties involved with deliveries has decreased by 34% over a recent 6-yr period. 2) The CSR of Korea has increased over recent de- cades like other developed countries, but has decreased since 2000. Subsequently, the CSR has remained at around 36–37%
since 2006, although it has increased in primiparas. 3) Multiple pregnancies and maternal age—high-risk factors for a rise in CSR—have increased steadily in Korea. In particular, the mean Table 4. Cesarean section rate by maternal age, type, and district of the medical care facilities in Korea (2011, 2012)
Parameters Delivery Vaginal delivery Cesarean section
delivery Cesarean section
rate (%) Cesarean section rate in primipara (%)
Total No. (%) in 2012 472,747 (100.0) 298,406 (43.1) 174,341 (36.9) 36.9 37.5
By maternal age group (yr) (2011) ≤19
20-24 25-29 30-34 35-39 40-44 ≥45
0.6 4.7 25.1 49.1 17.8 2.7 0.1
0.7 5.5 27.1 49.6 15.3 1.7 0.1
0.3 3.3 21.4 48.2 22.3 4.3 0.1
17.4 25.4 31.1 35.7 45.5 59.0 62.6
- - - - - - - By type of maternal care facilities (2012) (n = 739)
Tertiary hospital (n = 43) General hospital (n = 97) Hospital (n = 140) Clinics (n = 445) Midwifery clinics (n = 13) Health center (n = 1)
5.8 9.4 43.3 41.3 0.3 0.0
4.6 8.3 44.8 42.0 0.4 0.0
7.8 11.2 40.8 40.2 - -
50.2 44.1 34.7 35.9 - -
48.6 43.3 35.2 37.2 - - By district of medical care facilities (2011, 2012)
Seoul Busan Daegu Incheon Gwangju Daejeon Ulsan Gyeonggi Gangwon Chungbuk Chungnam Jeonbuk Jeonnam Gyeongbuk Gyeongnam Jeju
20.0*
7.2 5.7 4.9 4.3 3.9 2.4 25.1 2.5 2.9 3.4 3.6 2.6 4.1 6.0 1.2
20.3*
7.2 5.5 4.9 4.8 3.9 2.2 24.9 2.5 2.8 3.3 3.6 2.7 4.1 6.1 1.2
19.5*
7.3 6.1 4.9 3.4 4.0 2.7 25.4 2.7 3.1 3.6 3.7 2.4 4.0 5.8 1.3
36.1† 38.1 38.9 36.6 28.6 39.2 39.5 36.9 39.0 39.0 41.7 37.5 33.8 35.1 36.5 38.7
36.6† 38.9 39.5 37.1 27.7 40.4 39.2 37.7 39.0 39.1 43.6 38.4 34.7 35.8 38.0 37.5
Values are presented as percentage unless otherwise indicated. Cesarean delivery evaluation report in Korea (2013) by the Korea Health Insurance Review and Assessment Ser- vice (8) and social indicators in Korea (2012) by Statistics Korea (9). Cesarean section rate is the number of Cesarean section deliveries among the total number of deliveries, ex- pressed as a percentage. *The first, second, and third columns indicate 2011 data; †The fourth and fifth columns indicate 2012 data.
Table 5. Cesarean section surgical procedures per 100 live births in OECD countries (1990-2011) Countries1990199119921993199419951996199719981999200020012002200320042005200620072008200920102011 Australia17.517.918.218.819.219.319.320.120.921.723.125.126.828.228.230.030.630.630.831.232.232.2* Austria-------13.914.615.916.818.019.820.722.823.825.126.527.128.228.328.3 Belgium10.511.612.012.912.913.513.713.814.415.916.316.317.417.617.819.319.819.419.519.319.919.9* Canada18.417.917.517.517.517.517.918.418.819.620.922.223.424.825.326.226.226.626.426.226.126.1* Chile--------------------37.737.7* Czech Republic7.68.48.89.110.110.111.611.812.612.312.913.314.115.316.017.118.319.620.521.222.523.3 Denmark12.412.312.212.512.512.510.911.411.912.212.913.616.015.316.517.317.417.716.620.521.221.2* Estonia----------14.615.515.016.417.218.919.020.020.020.720.319.8 Finland13.614.314.514.615.415.615.715.615.415.815.816.516.416.216.316.216.116.216.415.916.116.2 France-------15.616.316.817.217.818.518.618.619.119.419.919.820.020.220.2 Germany15.715.215.916.617.117.217.618.119.119.820.922.023.724.826.026.727.828.529.430.331.431.1 Greece---------------------- Hungary--------------27.128.228.228.830.531.832.833.4 Iceland11.811.413.413.013.814.115.216.315.917.317.716.817.417.916.415.617.216.916.115.8-14.7 Ireland10.511.612.012.9-13.414.515.317.519.820.721.221.823.423.624.323.826.525.626.526.626.6* Israel--------12.913.914.716.116.816.717.618.618.618.819.519.219.319.8 Italy20.822.623.224.124.826.126.926.930.732.433.334.936.237.338.439.139.539.238.638.838.537.7 Japan---------------------- Korea-----------33.636.936.736.736.335.135.435.435.135.234.6 Luxembourg16.517.017.4-16.816.416.416.918.121.021.924.325.626.124.024.124.425.726.826.325.727.6 Mexico----24.225.325.427.727.427.928.230.433.234.737.038.239.540.743.942.044.849.0 Netherlands7.47.78.08.49.29.710.110.411.111.311.913.613.513.513.613.613.813.914.314.815.615.6* New Zealand12.113.012.513.814.415.115.716.518.218.420.221.222.222.222.523.024.423.223.324.123.824.3 Norway12.812.512.612.512.612.612.712.913.713.513.715.616.115.615.215.915.917.217.116.5-16.5† Poland----13.815.215.616.1-----15.716.418.519.219.019.322.826.129.9 Portugal---19.821.221.622.023.423.924.623.925.425.726.627.027.831.031.232.733.0-34.8 Slovak Republic8.79.19.910.611.211.512.213.013.313.914.716.617.818.519.220.721.923.524.727.026.126.1* Slovenia8.68.99.29.69.49.210.010.210.310.111.012.513.714.414.215.416.416.817.017.719.019.4 Spain14.215.016.217.317.818.819.319.620.320.921.422.223.223.624.225.025.925.324.725.025.024.9 Sweden--------12.114.214.515.616.116.516.716.917.217.216.716.916.416.2 Switzerland18.617.7----------24.225.127.528.530.232.032.532.432.833.0 Turkey----------------31.438.041.443.745.746.2 United Kingdom---------------21.021.121.623.223.723.824.1 United States22.722.622.321.821.220.820.720.821.222.022.924.426.127.529.130.331.131.832.332.932.832.8 Mean13.714.014.215.615.816.016.416.717.118.018.520.221.421.822.523.224.124.825.225.826.226.9 Organization for Economic Co-operation and Development (OECD) health data by OECD (11). *2010; †2009.
maternal age was 31.6 yr in 2012—significantly above the ma- ternal age of 25.8 yr in the United States and 29.8 yr in England for the same year. 4) The CSR of northern European countries exempted from responsibility with no-fault compensation sys- tem for birth injury remained low. Meanwhile, the CSR of the United States and Australia with civil litigation system by fault liability has gradually risen.
The rise in the CSR in Korea and other countries
The WHO defined the optimal CSR as 10%-15% in 1985, and re- ported that, at a CSR higher than 15%, the risk to maternal and neonatal health exceeded the benefit (1). However, about 15 yr on, the actual CSR was higher than 15% in more than half of countries (69/137) that took part in the survey for the World Health Report in 2010 (18). Furthermore, the CSR over the last 10-yr period has risen. By 2011, the CSR had risen to 32.9 in the United States and to 24.1 in England (11). This was almost two or three times higher than the optimal CSR recommended by the WHO in 1985. The optimal recommended CSR varies among countries, so the ideal CSR has not yet been agreed upon (19, 20).
The CSR in Korea increased from 4.4% in 1982, rose steeply to 43.0% in 1999, and since then has showed a slight decline. Again, it has remained at around 36%-37%. A similar pattern of increas- ing CSR is observable in almost all developed countries. In the United States, the CSR was only 5% in 1970 but increased dra- matically to 21% in 1995 and to 32.8% in 2011 (21, 22). In Eng- land, under progressive healthcare services, it increased from 9%
in 1980 to 25.5% in 2012 (15).
The positive contribution of CS: childbirth safety
In developing countries with a high mortality rate, there is a posi-
tive connection between the adaptive rise in the CSR and de- crease in maternal and perinatal mortality (20). In 1982, the CSR in Korea was only 4.4%. And the perinatal mortality rate was high as 21.3%, but then decreased to 6.0% in 1996. Therefore, the rise in the CSR from the 1980s to the mid-1990s in Korea is thought to have contributed to an improvement in maternal and child health (23-28). When Korea joined the OECD membership in 1996, as a result of continuous economic growth, the CSR in Ko- rea was 35.9%, and rose markedly to 43.0% in 1999. The trend to- ward a rise in CSR was found commonly among most OECD countries as well as in Korea.
The rise in the CSR in Korea and associated factors
The socio-economic status in Korea rose in the 1980s and 1990s, leading to a rise in the educational level in females. There was a five-fold increase in the national income per head, from 2,355 USD in 1985 to 11,292 USD in 2000. In 1985, 60% of Korean fe- males aged 15-44 yr were educated to a level below middle school and about 6.4% of females progressed to university. Since then, the female educational level has risen, and more than 30%
of females progressed to university level education in 2000 (9, 29, 30). According to the study by Lee et al. (31), the rise in the CSR in the 1980s seemed to correlate with the female educational level, so the higher the education level, the higher the CSR. The CSR in university graduates was 2.61 times higher than that in those educated to a level below middle school. In other words, we can assume that the sudden rise in the CSR from the 1980s to the early 1990s was influenced by economic determinants such as a rise in national income, an improvement in female socio- economic status, and an accessibility of medical facilities. How- 50
45 40 35 30 25 20 15 10 5
0 2001 2002 2003 2004 2005 2006 2007 2008 2009 2010 2011
20.2 33.6
21.4 36.9
21.8 36.7
22.5 36.7
23.2 36.3
24.1 35.1
24.8 35.4
25.2 35.4
25.8 35.1
26.2 35.2
26.9 34.6
Fig. 3. Comparison of the rate of OECD Cesarean section surgical procedures per 100 live births (OECD-CS SPR) in Korea with the mean OECD-CS SPR in OECD coun- tries from 2001 to 2011 (11). The OECD-CS SPR in Korea was higher than the mean OECD-CS SPR in OECD countries.
CS surgical procedure/100 births
OECD CS SPR
Year
OECD mean Korea
40 35 30 25 20 15 10 5
Fig. 4. The Cesarean section rate in 2011 according to legal pressure (11, 16, 17).
The following systems were considered: no-fault compensation system in Sweden, government sponsored no-fault compensation system and unitary compensation sys- tem in New Zealand, fault liability system in Japan, mistake lawsuit system in Eng- land, and civil litigation system in the USA, Australia, and Korea (Grouping by system:
Group I, Sweden and New Zealand; Group IIa, Japan; Group IIb, England; Group III, USA, Australia, and Korea).
Cesarean section rate (%)
Group l Sweden 16.2%
Group l New Zealand
24.3% Group lIa Japan 19.2%
Group lIb England 24.1%
Group lII Australia 32.2%
Group lII USA 32.8%
Group lII Korea 34.6%
Grouping by medico-legal system
ever, the correlation between the female educational level and the CSR changed over time; in 1994, there was no significant dif- ference between the two variables. The CSR in well-educated fe- males was lower than that in those educated to a level below middle school (odds ratio, 0.44; 0.24-0.79, P = 0.011) (31). Name- ly, neither the rise in female educational level nor the improve- ment in health care indicators alone could explain the cause of the rise in the CSR in Korea in the 1990s. Additionally, the study in China showed that the rise in the CSR between 1993 and 2008 was more influenced by the medical service system than by the socio-economic and income status of each individual (32).
Our study showed that, in Korea, maternal age is increasing steadily and that the mean childbearing age in 2012 was 31.6 yr.
Maternal age in this population was markedly higher than that in the United States (25.8 yr) and in England (29.8 yr) for the same year. Furthermore, the ratio of mothers aged 30-34 yr was 49.4%.
This rate was very high compared with that in the United States (25.6%) and England (29.3%). Many earlier studies from across the world have linked older maternal age with the rise in the CSR (33).
Older maternal age is one cause of the rising CSR because of the increased likelihood of the development of chronic diseases (e.g., diabetes, hypertension) before pregnancy and diseases during pregnancy (e.g., gestational diabetes, gestational hyper- tension, placenta previa, and abruptio placentae), which increase antepartum and intrapartum complications (34). An epidemio- logical study of childbirth in Australia showed that, between 1984 and 2003, the likelihood ratio of an emergency or sched- uled CSR was 2.7 and 5.4 respectively, in mothers aged over 40 yr (35). Furthermore, according to a recent study in England, the percentage of mothers aged over 40 yr rose by 80% between 2006 and 2011 and the CSR in mothers aged 40 yr rose from 34.6% to 53.7% over the same period (36). Our study showed that the per- centage of mothers aged over 40 yr in Korea more than doubled between 2002 (5.5%) and 2012 (11.4%)—over a period of 10 yr (10). This indicates that the rise in the CSR was related to the rise in older mothers in Korea.
Twin pregnancies have increased by about 50% in Korea, and the rise in the birth of twins appears to have influenced the rise in the CSR. The frequency of metabolic syndromes has also risen recently in Korea (37). It would be associated with maternal obe- sity and influence gestational diabetes, and gestational hyper- tension, leading, in turn, to a rise in the CSR and severe compli- cations such as pulmonary embolism. A pre-gestational body mass index of over 25.0 kg/m2 increases the likelihood of the CSR and small-for-gestational-age infants (38).
The primary CSR is the percentage of Cesarean births to women who have not had a previous CS delivery in a given year. Primary CS delivery has been shown to be one of the causes of repeat CS delivery. A rise in primary CSR leads to a rise in the CSR, so low- ering the primary CSR contributes to a reduction in the CSR. In the United States, a decrease in the CSR from 1985 to 1996 was
influenced by the reduction in primary CSR, as well as by the rise in VBAC (39). However, the primary CSR in the United States in- creased from 14.6% in 1996 to 23.1% in 2010, and the CSR also in- creased to 32.8% (40). The CSR of primiparas in Korea has been rising: 34.9% in 2006 and 37.5% in 2012. It seems likely that the pri- mary CSR in Korea will show a similar pattern, because primary CS delivery has mainly occurred in primiparas.
The main causes of primary CS in Korea are cephalopelvic dis- proportion, fetal malpresentation, and fetal distress (6). The rea- sons for the rise in the primary CSR are a rise in failed labor, a re- duction in operative vaginal delivery, a rise in a diagnosis of fetal distress by the use of fetal electronic monitoring, and preference for CS in cases of breech or multiple deliveries. Compared with other races, in asian women, the primary CSR for failure to prog- ress is quite high because they have a relatively small pelvic cavity (41). Furthermore, maternal aging is a major problem in Korea, as mentioned previously. The percentage of pregnant women aged over 35 yr increased from 8.4% in 2001 to 21.6% in 2012, so the rise in primary CSR was likely due to increased failed labor in older pregnant women. This inevitable phenomenon of maternal ag- ing was believed to be a result of the rise in female social activity.
Moreover, as woman’s right to choose the mode of delivery needs to be respected, CS on maternal request without indication is one of causes of the rise in the primary CSR. Studies showed that 7%-8% of CS deliveries in England and the United States had done on maternal request, and a survey in Korea reported that 6%-7% of CS deliveries was taken on maternal request without indication (42-44). Doctors are having difficulty in declining CS delivery by maternal request. One European study explored the attitudes of obstetricians. More than 75% of German and English doctors accepted CS delivery by maternal request, as did even 22% of doctors in the Netherland where the CSR were lowest. As- sociated factors were fear of litigation, country of practice, and working in a university-affiliated hospital (45).
Even though no nationwide survey has been conducted on CS on maternal request in Korea, it seems to be difficult for clini- cians to insist on vaginal delivery on medical grounds rather than accept a maternal request for CS delivery. Moreover, medi- co-legal system in Korea would make the clinicians accept a ma- ternal request for CS without hesitation if obstetricians kept be- ing blamed for attempting vaginal delivery in place of perform- ing CS in litigation.
HAS THE STRATEGY OF THE KOREAN GOVERNMENT TO REDUCE THE CSR BEEN PROVEN EFFECTIVE?
Introduction of an incentive system linked to the CSR The Korean government and KHIRA have started an annual evaluation of the CSR among all medical facilities involved with deliveries in an effort to reduce CS without indication intended
initiated by medical staff and optimize the CSR. Public release of an evaluation report on Cesarean delivery was initiated through the KHIRA website in 2005. The national medical insurance in- stitute then introduced a “Pay for Performance” policy in 2007. It ranked hospitals according to their CSR, granted financial incen- tives or penalties, and tried to induce an eventual reduction in the CSR. However, the repeated release of information on the CSR coupled with financial incentives failed to reduce the CSR, which was revealed to have remained the same in Korea be- tween 2006 and 2012 (5). Recently, the government announced that the policy of granted financial incentives or penalties ac- cording to CSR will be discontinued. This infers that the high CSR in Korea is not linked to the financial interests of doctors. In fact, there was no statistical correlation between increased CSR and doctors’ income in a survey of private clinics in the metro- politan area of Korea in 2000, when the CSR was very high (46).
Furthermore, the financial benefit to doctors from CS is negligi- ble because the medical charge for CS is very low in Korea. Like- wise, a similar situation exists in Taiwan whereby a financial in- centive policy failed to reduce the CSR (47). A report from the United States demonstrated that doctors’ income had very little effect on increasing the CSR; furthermore, financial incentives failed to reduce the CSR (48, 49).
Encouraging viginal birth after Cesarean (VBAC)
Repeated CS is the major cause of a high CSR. There are two ways of reducing it: 1) by conducting VBAC in pregnant women with a previous CS delivery, and 2) by reducing the primary CSR.
A high CSR is a global trend in developed countries. In the Unit- ed States, the CSR rose rapidly until the early 1980s. The Ameri- can College of Obstetricians and Gynecologists (ACOG) con- ducted an extensive campaign for VBAC and recommended VBAC to all pregnant women with a previous CS delivery and no specific contraindications (50). As a result, the VBAC rate in- creased significantly from 5% in 1985 to 28.3% in 1996, with a concomitant reduction in the CSR of around 20% (51). However, complications such as uterine rupture, neonatal death, and brain injury also increased, which led to increased medical, so- cial, and lawsuit costs. Obstetricians then avoided VBAC, and the percentage of VBAC decreased to 8.3% in 2007 (52, 53). ACOG stated that VBAC should be performed after individual risks and benefits must be fully evaluated because failed VBAC could re- sult in increased maternal and perinatal morbidity compared to elective cesarean section and that VBAC should be conducted in centers where immediate emergency CS can be performed (54).
In Korea, despite the experts’ concerns about VBAC (55), KHIRA included VBAC as a major monitoring index for the evaluation of CS delivery to encourage obstetricians to advocate VBAC. How- ever, the percentage of VBAC did not increase significantly; it was 2.9% in 2001, 4.6% in 2006, and reduced to 3.5% in 2012. These percentages are very low compared with the 20%-55% in OECD
countries (39); VBAC had no effect on lowering the CSR in Ko- rea. Obstetricians avoid VBAC as they fear medico-legal issues in cases of severe complications and the poor cost-effectiveness in terms of general equipment and personnel expenses (56, 57).
Both VBAC and planned CS have advantages and disadvantages, and further studies are required to establish appropriate indica- tions and safety (58). Therefore, governmental support, such as a medico-social insurance system and financial support to main- tain equipment and man power, should precede the wide spread promotion of VBAC because the safety and effectiveness of VBAC is not totally evident.
Diagnosis-related groups may increase the primary CSR in Korea
Diagnosis-related groups (DRG) for some surgical procedures have been enforced in all medical facilities in Korea since 2013;
that is, CS is also included for prospective payment system based on DRG and the medical charge cannot be changed. For exam- ple, hospitals cannot charge additional costs to a national medi- cal insurance organization for unexpected CS after failure to in- duce labor. The labor induction failure rate rises to 49% in preg- nant women with 41 weeks or more of gestation and have a low Bishop score, and is even higher in pregnant women aged over 35 yr (59, 60). Therefore, under the DRG system of Korea, there is continued concern about the high primary CSR and low rate of labor induction. Because the induction of labor carries a higher risk of CS than spontaneous labor, discretion should be exercised for when carrying out nonmedically indicated induction of labor to reduce the primary CSR, especially for the convenience of pregnant women and doctors (60-64).
The no-fault compensation system may contribute to the decrease in the primary CSR in Korea
We analyzed the CSR of OECD countries and found that in coun- tries where a no-fault compensation system was established for medico-legal issues, the CSR remains at a low level—around 20% or less—especially in northern European countries. In con- trast, in those countries with a fault liability system, such as the United States and Australia, the CSR is higher than 30%. In Ko- rea, because a fault liability system is applied in medico-legal cases, it is assumed that any further reduction in the CSR might not be possible. Conversely, the decrease in CSR can be expected to follow a no-fault compensation system like in Sweden. In real- ity, one Australian study revealed that the CSR in New Zealand—
where the government sponsored a no-fault compensation sys- tem—was 24.7% in 2007; however, in Australia with a fault liabili- ty system it was 32.3% under the same treatment protocol. They suggested that if the Australian government would adopt a no- fault system, CSR would decrease by 7% due to decreased defen- sive treatment and this eventually further improve the maternity service for the next generation (65).
The birth environment in Korea
Korea had the lowest birth rate out of the OECD countries (1.19 per 1,000 live births) in 2008; however, it has risen slightly to 1.23 in 2012 but still remains lower than the mean rate of the OECD countries (10). Besides the low birth rate, the number of medical facilities involved with deliveries decreased and the sharply re- duction in obstetricians became one of the most pressing social issues in Korea. Vaginal delivery in nulliparous woman is more time consuming than CS, and at the same time requires a skilled clinicians who can do exact and rapid clinical decision-making and are ready to perform operative vaginal delivery if necessary under possibility of medical litigations. It is hardly to say that the CSR in Korea would be decreased by reducing primary CSR at poor medical environment presently (66). Fortunately, unlike other OECD countries where the CSR is continuously increasing, the CSR remains constant in Korea, and it is assumed that this results from an improved perception of CS among pregnant women and a relatively stable medical service (31).
SUMMARY AND CONCLUSION
The CSR has risen steadily over the last three decades in devel- oped countries because of reduced operational risks owing to ad- vances in medical techniques. Maternal and perinatal mortality is high in resource-limited countries, and it has been proved—both medically and epidemiologically—that CS can contribute to a re- duction in maternal and perinatal mortality (67, 68). On the other hand, as CS can increase maternal complications such as hemor- rhage, infection, pulmonary embolism, and amniotic embolism compared with vaginal delivery (65), it should be conducted with caution from the doctors’ viewpoint as well as from that of the pregnant women.
The CSR in Korea had been constantly increasing, then gradu- ally decreased since 2000, and has remained at 36%-37% since 2006. Factors that lead to a rise in CSR are increased maternal age, multiple pregnancies, and maternal obesity. In particular, Korea has become an aging society in which the mean age of pregnant women was 31.6 yr in 2012, contrasting with 25.8 and 29.8 yr in the United States and England, respectively. It is inferred that this older maternal age leads to a further rise in the CSR.
The Korean government introduced a “Pay for Performance”
policy from 2007, but this failed to reduce the CSR, which has re- mained constant since 2006. Furthermore, the widespread pro- motion of VBAC does not seem to have been successful because its safety and effectiveness is not established and Korean moth- ers tend to have an only child as the Statistics Korea announced that the birth rate was 1.19 in 2013 (70).
There is no doubt that reducing the primary CSR is the most important way of decreasing the CSR (21, 71). Compared with the primary CSR of the United States or England, that in Korea has increased in parallel with the sharp rise in maternal age. De-
spite this, from July 2013, the government has enforced a DRG system even in tertiary centers that are responsible for high-risk deliveries and deliveries in older mothers. This is very likely to in- crease the primary CSR. Additionally, a recent government poli- cy relating to fault liability has increased the tendency of obstetri- cians to avoid deliveries (72). These trends could lead to a lack of experienced obstetricians who can cope with high-risk deliver- ies. Lastly, this study demonstrated that the CSR is closely linked with the compensation system for medico-legal problems.
In conclusion, to reduce the CSR, social efforts such as a per- ceptional change regarding CS, lowering the maternal age, and maintaining health and proper weight are essential. Moreover, governmental efforts to encourage experienced obstetricians to exercise discretion in their decision to perform CS and to reduce the legal implications regarding delivery should be assured.
DISCLOSURE
The authors have no conflicts of interest to disclose.
ORCID
Sung-Hoon Chung http://orcid.org/0000-0002-0352-9722 Hyun-Joo Seol http://orcid.org/0000-0003-0303-7813 Yong-Sung Choi http://orcid.org/0000-0001-9181-7849 Soo-young Oh http://orcid.org/0000-0003-3002-0048 Ahm Kim http://orcid.org/0000-0002-9285-1106 Chong-Woo Bae http://orcid.org/0000-0002-0965-5674 ACKNOWLEDGMENTS
The authors would like to thank Mr. Hwa-Jin You (You & Law Law Office, Korea) for his contribution by critical review of this paper.
REFERENCES
1. Appropriate technology for birth. Lancet 1985; 2: 436-7.
2. Villar J, Valladares E, Wojdyla D, Zavaleta N, Carroli G, Velazco A, Shah A, Campodónico L, Bataglia V, Faundes A, et al. Caesarean delivery rates and pregnancy outcomes: the 2005 WHO global survey on mater- nal and perinatal health in Latin America. Lancet 2006; 367: 1819-29.
3. Lumbiganon P, Laopaiboon M, Gülmezoglu AM, Souza JP, Taneepan- ichskul S, Ruyan P, Attygalle DE, Shrestha N, Mori R, Nguyen DH, et al.
Method of delivery and pregnancy outcomes in Asia: the WHO global sur- vey on maternal and perinatal health 2007-08. Lancet 2010; 375: 490-9.
4. Williams JW. Cesarean delivery and peripartum hysterectomy. In: Cun- ningham FG, Williams JW. editors. Williams Obstetrics. 23th ed. New York: McGraw-Hill Medical, 2010, p544-9.
5. Jang WM, Eun SJ, Lee CE, Kim Y. Effect of repeated public releases on ce- sarean section rates. J Prev Med Public Health 2011; 44: 2-8.
6. Korea National Health Insurance Service. Cesarean delivery survey in Korea, 2000. Seoul: Korea National Health Insurance Service, 2001, 1-8.