INTRODUCTION
Mast cells (MCs) play a key role in food allergy.1-3 They also play an important role in host defense and have unique protec- tive activity against toxins and venoms.4 They are derived from hematopoietic stem cells, which give rise to MC progenitors that circulate in the blood and enter the tissues, where they un- dergo differentiation and maturation to become mature MCs.
The different microenvironments found in tissues modulate the morphology and features of MCs, and therefore specific subpopulations are observed in distinct tissues.5 Mouse MCs are classified based on their anatomic location into 2 groups, mucosal MCs (MMCs) and connective tissue MCs (CTMCs).6 In humans, tissue distribution is not as clearly demarcated as in rodents.7 Most human tissues have a mixed population of MC types that are distinguished on the basis of their protease com- position. Tryptase-only MCs are located predominantly in the alveolar wall and gastric mucosa, similar to MMCs in rodents.
Chymase-only MCs, or both tryptase- and chymase-positive MCs are located predominantly in the skin and intestinal sub- mucosa like CTMCs in rodents. For all subsets, recent evidence
suggests that the expression of their secretory granule proteases is directed by the local tissue in which the cells reside.8 It is also known that they differ in their amine content as well as in some of their functional properties,6 but the biological implications of these differences are still poorly understood.
MC knockout mice and MC knockin approaches, as well as other unique humanized mouse models, have been developed to study MC functions in vivo.9,10 There is also a need for reduc- tionist model systems that can be used for mechanistic studies or drug screening. Isolation of tissue MCs from the gastrointes- tinal tract,11 skin and lung,12 or peritoneal cavity13 have been de- scribed, but the low rates of isolated cells as well as the high sam- ple handling make these techniques burdensome and difficult
Original Article
Allergy Asthma Immunol Res. 2018 May;10(3):268-277.
https://doi.org/10.4168/aair.2018.10.3.268 pISSN 2092-7355 • eISSN 2092-7363
Immune Characterization of Bone Marrow-Derived Models of Mucosal and Connective Tissue Mast Cells
Sara Benedé,* Evan Cody, Charuta Agashe, M. Cecilia Berin
Department of Pediatrics, Mindich Child Health and Development Institute, Immunology Institute, Icahn School of Medicine at Mount Sinai, New York, NY, USA
This is an Open Access article distributed under the terms of the Creative Commons Attribution Non-Commercial License (http://creativecommons.org/licenses/by-nc/4.0/) which permits unrestricted non-commercial use, distribution, and reproduction in any medium, provided the original work is properly cited.
Purpose: It is well appreciated that mast cells (MCs) demonstrate tissue-specific imprinting, with different biochemical and functional properties between connective tissue MCs (CTMCs) and mucosal MCs (MMCs). Although in vitro systems have been developed to model these different sub- sets, there has been limited investigation into the functional characteristics of the 2 major MC subsets. Here, we report the immunologic character- ization of 2 MCs subsets developed in vitro from bone marrow progenitors modeling MMCs and CTMCs. Methods: We grew bone marrow for 4 weeks in the presence of transforming growth factor (TGF)-β, interleukin (IL)-9, IL-3, and stem cell factor (SCF) to generate MMCs, and IL-4, IL-3, and SCF to generate CTMCs. Results: CTMCs and MMCs differed in growth rate and protease content, but their immune characteristics were remark- ably similar. Both subsets responded to immunoglobulin E (IgE)-mediated activation with signaling, degranulation, and inflammatory cytokine re- lease, although differences between subsets were noted in IL-10. CTMCs and MMCs showed a similar toll-like receptor (TLR) expression profile, dominated by expression of TLR4, TLR6, or both subsets were responsive to lipopolysaccharide (LPS), but not poly(I:C). CTMCs and MMCs express receptors for IL-33 and thymic stromal lymphopoietin (TSLP), and respond to these cytokines alone or with modified activation in response to IgE cross-linking. Conclusions: The results of this paper show the immunologic characterization of bone marrow-derived MMCs and CTMCs, providing useful protocols for in vitro modeling of MC subsets.
Key Words: Mucosal mast cells; connective tissue mast cells; mast cell subsets
Correspondence to: Sara Benedé, PhD, Department of Pediatric Allergy &
Immunology, Box 1198. Icahn School of Medicine at Mount Sinai. One Gustave L. Levy Place. New York, NY 10029, USA.
Tel: +1-212-824-8442, E-mail: [email protected] Received: August 18, 2017; Revised: December 8, 2017;
Accepted: December 12, 2017
•There are no financial or other issues that might lead to conflict of interest.
to scale up. A number of systems have been developed which allow investigators to readily obtain sufficient quantities of MCs generated from progenitors derived from bone marrow, peri- pheral blood, or cord blood.13-15 Using different growth factors that mimic the microenvironments of different tissues enables differentiation of progenitors into different subsets of MCs. Here, we present the characterization of 2 in vitro models of MCs de- rived from bone marrow that mimic mucosal and connective tissue subsets. Moreover, we describe their response to immu- noglobulin E (IgE)-dependent and -independent activation.
MATERIALS AND METHODS Mice
Balb/c and C57BL/6 mice were obtained from Charles River Laboratories (Wilmington, MA, USA). All animal procedures were approved by the Institutional Animal Care and Use Com- mittee of the Icahn School of Medicine at Mount Sinai (approv- al number LA11-00273).
Bone marrow-derived MCs
Bone marrow cells were collected from femurs from 4-to–8- month-old mice and cultured in Dulbecco’s Modified Eagle Me- dium with glucose and L-glutamine, supplemented with 10%
fetal bovine serum, penicillin/streptomycin, and sodium pyru- vate (all from GibcoTM, ThermoFisher Scientific, Waltham, MA, USA) plus 25 ng/mL recombinant murine stem cell factor (SCF) (all cytokines and growth factors were from Peprotech, Rocky Hill, NJ, USA) and 30 ng/mL interleukin (IL)-3. Bone marrow MCs were differentiated into either a MMCs with additional IL-9 at 5 ng/mL and transforming growth factor (TGF)-β at 1 ng/mL or a CTMC with IL-4 at 1 ng/mL. MCs were cultured in 75-cm2 tissue culture flasks, incubated at 37°C in a humidified incubator under 5% (v/v) CO2 for a minimum of 4 weeks and up to 8 weeks before they were used for functional assays. Twice a week, the medium was changed by transferring the cell sus- pension to a 50-mL conical polypropylene centrifuge tube, and centrifuging for 10 minutes at 200×g, at room temperature. The culture flasks were changed every time the medium was changed.
The maturity and purity of the cells were examined by flow cy- tometric analysis for the expression of c-Kit (eBioscience, San Diego, CA, USA) and FcεRI (Biolegend, San Diego, CA, USA).
Real-time polymerase chain reaction (RT-PCR)
RT-PCR was performed starting from 1 µg of total RNA, using SuperScript II reverse transcriptase (InvitrogenTM, ThermoFish- er Scientific). Then, cDNA was amplified using the Power SYBR Green PCR Master Mix (Applied BiosystemsTM, ThermoFisher Scientific) and run on CFX384 TouchTM real-time PCR detection system (Bio Rad, Hercules, CA, USA), using the primers describ- ed in Table 1. β-Actin was used as the housekeeping gene. Rela- tive expression that refers to data normalized to the housekeep-
ing gene or fold increase compared with levels measured in non- activated cells by using ∆∆CT threshold cycle me thod of calcula- tion was used to represent the data. All amplifications were car- ried out in triplicate.
Flow cytometry
Cells stained with live/dead fixable blue dead cell staining kit (ThermoFisher Scientific) were blocked with anti-CD16/32 an- tibody (eBioscience) and stained with specified antibodies. For intracellular staining, cells were fixed and permeabilized with fixation/permeabilization working solution (BD Biosciences, San Jose, CA, USA) according to the manufacturer’s instructions.
Antibodies used included those recognizing CD107a, c-kit, phos- pho-Syk, ST2, CD127 (eBioscience), FcεRI (Biolegend), and thy- mic stromal lymphopoietin receptor (TSLPR; R&D Systems, Min- neapolis, MN, USA). Cells were acquired on a BD LSR Fortessa cytometer (BD Biosciences). Data was analyzed using the Flow- Table 1. List of primers for RT-PCR
Gene Forward sequence 5’-3’ Reverse primer 5’-3’
β-actin GTGGGCCGCTCTAGGCACCAA CTCTTTGATGTCACGCACGATTTC MMCP-1 CAGATGTGGTGGGTTTCTCA GCTCACATCATGAGCTCCAA MMCP-2 AGGCCCTACTATTCCTGATGG ATGTAAGGACGGGAGTGTGG MMCP-4 GCTACCTGTGGTGGGTTTCT TCACATCATGAGCTCCAAGG MMCP-5 CAGGCCCTGGATCAATAAGA GGCACACAAAACCTGCACTA MMCP-6 CTATCCAGGGTCAGGCAAGA GACAGGGGAGACAGAGGACA MMCP-7 GACCCCAACAAGGTCAGAGT TGTAGAAGTCGGGGTGTGTG nMC-CPA TCCAGGAACCAAAACTCCAC CATTGAGGCATGGTTTGTG IL-3 ATAGGGAAGCTCCCAGAACC TTTCCACGAATTTGGACAGG IL-4 CTCGTCTGTAGGGCTTCCAA TCTGCAGCTCCATGAGAACA IL-6 TTGCCTTCTTGGGACTGATG ACAGGTCTGTTGGGAGTGGT IL-10 TGCTATGCTGCCTGCTCTTA TCATTTCCGATAAGGCTTGG IL-13 CCATCCCATCCCTACAGAAA GAAATGTGCTCAAGCTGCTG IL-17 TCTCTGATGCTGTTGCTGCT AGTCCTTGGCCTCAGTGTTT IL-33 ATCGGGTACCAAGCATGAAG GTCAACAGACGCAGCAAATG IFN-γ GCTTTAACAGCAGGCCAGAC GGAAGCACCAGGTGTCAAGT TNF-α CAAAGGGAGAGTGGTCAGGT GCACCTCAGGGAAGAATCTG TSLP GTCACTGCCATGATGAGGTG CTGGGTCTGAACCCTTTGAC TLR-1 GGATTTGTCCCACAATGAGC TATAGGCAGGGCATCAAAGG TLR-2 CATCGCTTTTTCCCAATCTC GAAGTCAGCCCAGCAAAATC TLR-3 TCGGATTCTTGGTTTCAAGG TTCCCAGACCCAGTCTCTGT TLR-4 AATGCCCTATTGGATGGAAA AGGCCCCAGAGTTTTGTTCT TLR-5 AGTCCTGGAGCCTGTGTTGT GAGATGAGGCGTCTGGAGAG TLR-6 TGCCTCCATGAGAGGAACTT GGGGAGACAGCACAAAGATG TLR-7 TGCTGTGTGGTTTGTCTGGT TTGACCTTTGTGTGCTCCTG TLR-8 TGGCCAGAAGACAAAACAAA GCCCACCTTTTCCTATCTCC TLR-9 TGGCTATGCGTACACTGGAG GTGTGGCTCAGGCTCAGATT TLR-11 TCCACTTGCATTTCCTCTCC TTTTTCCCAAGGTCAAGTGC TLR-12 CCTGCATTGACCACCCTTAG GCTTCAGGCTCAAGGTATGC TLR-13 TGTTCCGAGCAACTTTTTCC CAGAGGGTCAAATTGGTGGT
Benedé et al. Volume 10, Number 3, May 2018
Jo software (TreeStar Inc., Ashland, OR, USA).
MC staining
MCs were cytospun onto glass slides at 150 rpm for 5 minutes and stained with toluidine blue according to Kovarova [16] or chloroacetate esterase according to Friend et al. [17].
MC stimulation
For activation through cross-linking of the IgE receptor, MCs were initially sensitized for 1 hour with 1 µg/mL monoclonal mouse anti-2,4-dinitrophenol (DNP) IgE antibody (Sigma-Al- drich, St. Louis, MO, USA) or 100 ng/mL purified mouse IgE an- tibody (BD Biosciences) in complete media without exogenous cytokines. After washing by centrifugation at 200×g for 10 min- utes, MCs were suspended at 1×10⁶ cells/mL (5×10⁵ cells/mL for N-acetyl-β-D-hexosaminidase release assay) and activated
with 1 µg/mL rat anti-mouse IgE antibody (BD Biosciences) or 100 ng/mL DNP-HSA (Sigma-Aldrich). In some experiments, IL-33 or thymic stromal lymphopoietin (TSLP) (both from Pep- rotech) were added to the culture medium at 100 ng/mL. Lipo- polysaccharide (LPS), Poly(I:C) (both from InvivoGen, San Di- ego, CA, USA) and Compound 48/80 (Sigma-Aldrich), were add- ed to the culture at doses indicated prior to supernatant harvest after 24 hours.
N-acetyl-β-D-hexosaminidase release assay
For detection of the granular enzyme β-hexosaminidase, an enzymatic colorimetric assay was used as previously described.18 Briefly, after activation of 100 µL of MCs in HEPES degranulation buffer, 50 µL of supernatant was transferred to a 96-well plate and mixed with 100 µL of substrate solution (3.5 mg/mL p-nitro- phenyl-N-acetyl-β-D-glucosaminide dissolved in 40 mM citric
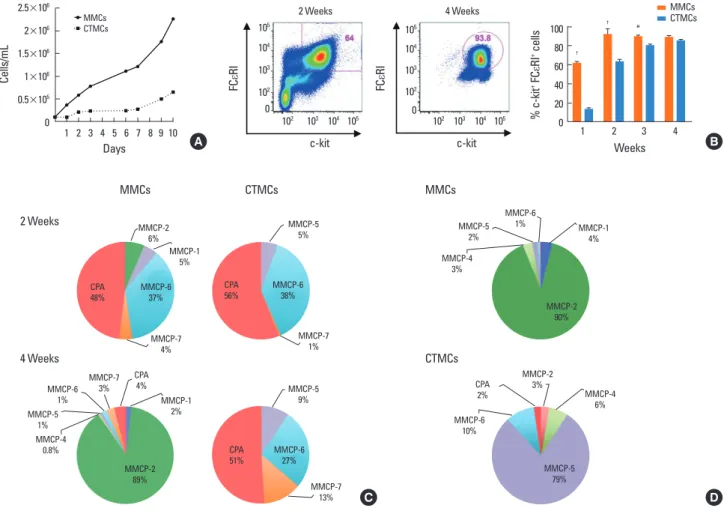
Fig. 1. Maturation and differentiation of MMCs and CTMCs from bone marrow progenitors. (A) Growth rates of MMCs and CTMCs. (B) Representative staining of FcεRI and c-kit expression after 2 or 4 weeks of culture with growth factors (left), and percentage of FcεRI+/c-kit+ cells after 1, 2, 3, or 4 weeks of culture with growth factors. (C) RT-PCR for MMCP-1, MMCP-2, MMCP-4, MMCP-5, MMCP-6, MMCP-7, MMCP-8, and CPA in MMCs and CTMCs after 2 or 4 weeks of culture of bone marrow progenitors from Balb/c mice with growth factors. Relative expression refers to data normalized to the housekeeping gene. Data are expressed has the per- centage distribution of the total protease expression. Data represent the mean of 3 different experiments. (D) As in C, but using bone marrow from C57BL/6 mice and analyzed at 4 weeks. MMC, mucosal mast cell; CTMC, connective tissue mast cell; RT-PCR, real-time polymerase chain reaction; MMCP, mouse mast cell prote- ase; CPA, carboxypeptidase. *P<0.05; †P<0.0001.
Figure 1
c‐kit c‐kit
FCεRI FCεRI
2 Weeks 4 Weeks
A B
C D
Cells / mL
MMCsCTMCs
MMCs CTMCs MMCs
CTMCs
Cells/mL
1 2 3 4 5 6 7 8 9 10 Days
MMCs CTMCs 2.5×10⁶
2×10⁶ 1.5×10⁶ 1×10⁶ 0.5×10⁵ 0
Figure 1
c‐kit c‐kit
FCεRI FCεRI
2 Weeks 4 Weeks
A B
C D
Cells / mL
MMCsCTMCs
MMCs CTMCs MMCs
CTMCs
Figure 1
c‐kit c‐kit
FCεRI FCεRI
2 Weeks 4 Weeks
A B
C D
Cells / mL
MMCsCTMCs
MMCs CTMCs MMCs
CTMCs
2 Weeks
FCεRI
102 103 104 105 c-kit 105
104 103 102 0
4 Weeks
FCεRI
102 103 104 105 c-kit 105
104 103 102
0 ++% c-kit FCεRI cells
1 2 3 4
Weeks 100
80 60 40 20 0
†
† *
MMCsCTMCs
A B
C D
MMCs
MMCP-6
1% MMCP-1
4%
MMCP-5 2%
MMCP-4 3%
MMCP-2 90%
MMCs 2 Weeks
4 Weeks
CTMCs
CTMCs
MMCP-5 5%
MMCP-7 1%
CPA
56% MMCP-6
38%
MMCP-6 1%
MMCP-7 3%
MMCP-1 2%
MMCP-2 89%
MMCP-5 1%
MMCP-4 0.8%
CPA
4% MMCP-5
9%
MMCP-6 27%
MMCP-7 13%
CPA51%
MMCP-2
3% MMCP-4
6%
MMCP-6 10%
MMCP-5 79%
CPA 2%
MMCP-2 6%
MMCP-1 5%
CPA48% MMCP-6 37%
MMCP-7 4%
Immune Characterization of Bone Marrow-Derived Mast Cells AAIR
acid, pH 4.5). The remaining cells (50 µL) were lysed with 150 µL of 0.1% triton X-100 and the same procedure was done. The mixtures were incubated at 37°C for 90 minutes. After incubation, 100 µL of glycine (400 mM, pH 10.7) was added to each well,
and the absorbance at 405 nm was measured using a POLAR- star Microplate Reader (BMG LabTech, Ortenberg, Germany).
The percentage of β-hexosaminidase release was calculated as a percentage of the total β-hexosaminidase content as follows:
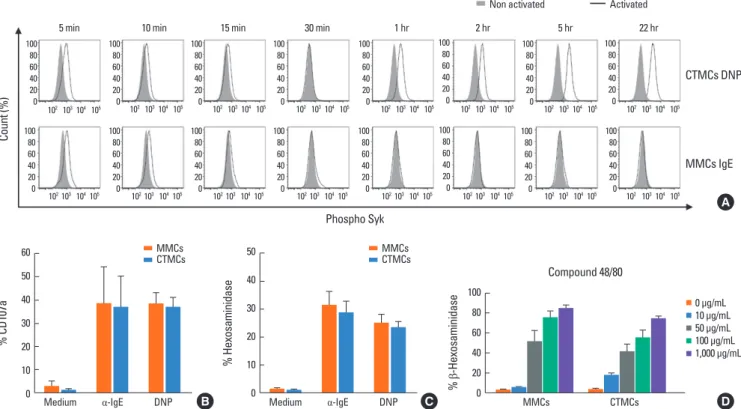
Fig. 3. Activation of MMCs and CTMCs after stimulation through FcεRI. (A) Intracellular expression of phospho-Syk, (B) surface expression of CD107a, and (C) de- granulation, measured as percentage of β-hexosaminidase secretion, in sensitized MMCs and CTMCs with mouse IgE or anti-DNP IgE after 30 minutes of activation with α-IgE or DNP-HSA. (D) Percentage of β-hexosaminidase secreted by MMCs and CTMCs after stimulation with compound 48/80. Data correspond to bone mar- row-derived MCs obtained from Balb/c mice. MMC, mucosal mast cell; CTMC, connective tissue mast cell; IgE, immunoglobulin E; DNP, 2,4-dinitrophenol; DNP-HAS, dinitrophenylated human serum albumin; MC, mast cell.
Count (%)
Phospho Syk
CTMCs DNP Non activated Activated
5 min 10 min 15 min 30 min 1 hr 2 hr 5 hr 22 hr
MMCs IgE
100 80 60 40 20 0
100 80 60 40 20 0
100 80 60 40 20 0
100 80 60 40 20 0
100 80 60 40 20 0
100 80 60 40 20 0
100 80 60 40 20 0
100 80 60 40 20 0
100 80 60 40 20 0 100
80 60 40 20 0
100 80 60 40 20 0
100 80 60 40 20 0
100 80 60 40 20 0
100 80 60 40 20 0
100 80 60 40 20 0 100
80 60 40 20 102 103 104 105 0
102 103 104 105 102 103 104 105 102 103 104 105 102 103 104 105 102 103 104 105 102 103 104 105 102 103 104 105 102 103 104 105 102 103 104 105 102 103 104 105 102 103 104 105 102 103 104 105 102 103 104 105 102 103 104 105 102 103 104 105
% CD107a
Medium α-IgE DNP 60
50 40 30 20 10 0
MMCsCTMCs
% Hexosaminidase
Medium α-IgE DNP 50
40
30
20
10
0
MMCsCTMCs
% β-Hexosaminidase
MMCs CTMCs
100 80 60 40 20 0
0 μg/mL 10 μg/mL 50 μg/mL 100 μg/mL 1,000 μg/mL Compound 48/80
A
B C D
Fig. 2. Metachromatic staining of MMCs and CTMCs with toluidine blue or the chloroacetate esterase dyes. (A) Metachromatic staining with toluidine blue or (B) choroacetate esterase. Cytospins of MCs were prepared at 150 rpm for 5 minutes. Images are representative of 3 samples per condition. Data correspond to bone marrow-derived MCs obtained from Balb/c mice. MMC, mucosal mast cell; CTMC, connective tissue mast cell.
B
CTMCs MMCs
Toluidine blue Chloroacetate esterase Figure 2
A B
CTMCs MMCs
Toluidine blue Chloroacetate esterase
A B
CTMCs MMCs
Toluidine blue Chloroacetate esterase
A B
CTMCs MMCs
Toluidine blue Chloroacetate esterase Figure 2
A B
CTMCs MMCs
Toluidine blue Chloroacetate esterase Figure 2
A B
CTMCs MMCs
Toluidine blue Chloroacetate esterase
A B
CTMCs MMCs
Toluidine blue Chloroacetate esterase
A B
CTMCs MMCs
Toluidine blue Chloroacetate esterase Figure 2
A B
Toluidine blue Chloroacetate esterase
MMCs
CTMCs
A
Benedé et al. Volume 10, Number 3, May 2018
β-hexosaminidase release (%)
=
=
×100
Enzyme immunoassays
Supernatants of cultured cells were collected 2 or 24 hours af- ter addition of stimuli, IL-4, IL-6, IL-10, IL-13, IL-17, IL-33, in- terferon (IFN)-γ, tumor necrosis factor (TNF)-α, and TSLP were measured by enzyme-linked immunosorbent assay (ELISA) fol- lowing the manufacturer’s instructions (eBioscience).
Statistical analysis
All statistical analyses were performed using GraphPad Prism software version 7.0e (GraphPad Software, Inc., La Jolla, CA, USA). Two-tailed Student’s t test, 1-way analysis of variance (ANOVA) or 2-way ANOVA were used for determining statisti- cal significance (P<0.05). Results are expressed as mean±stan- dard error of the mean.
RESULTS
Differentiation and maturation of bone marrow-derived MCs MMCs from Balb/c mice were differentiated with SCF, IL-3, TGF-β, and IL-9, while CTMCs were differentiated in the pres- ence of SCF, IL-3, and IL-4. We observed a relatively slow growth rate in CTMCs compare with MMCs, probably due to the pres- ence of IL-9 in the media which promotes MCs proliferation (Fig. 1A). Expression of c-kit and FcεRI occurred more rapidly in MMCs with approximately 92% of cells being double positive after 2 weeks of culture, while CTMCs did not reach double ex- pression until the third week (Fig. 1B). At 2 weeks of culture, both subsets showed a similar protease profile, predominantly expressing mouse mast cell protease (MMCP)-6 and carboxy- peptidase (CPA) (Fig. 1C). After 4 weeks of culture, the protease profile became distinct and MMCs had a dominant expression of MMCP-2 and also expressed MMCP-1, while CTMCs expressed elevated levels of MMCP-5, MMCP-6, MMCP-7, and CPA. As shown in Fig. 1D, bone marrow from C57BL/6 mice showed a similar skewing of MMCs with dominant expression of MMCP- 2 and MMCP-1, while CTMC were more highly skewed toward MMCP-5 expression.
MMCs and CTMCs were stained using toluidine blue or chlo- roacetate esterase. CTMCs, but not MMCs, demonstrated strong
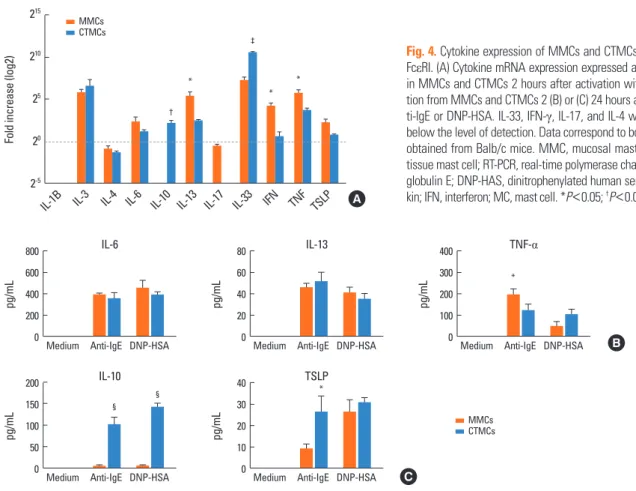
Fig. 4. Cytokine expression of MMCs and CTMCs after activation through FcεRI. (A) Cytokine mRNA expression expressed as fold change by RT-PCR in MMCs and CTMCs 2 hours after activation with α-IgE. Cytokine secre- tion from MMCs and CTMCs 2 (B) or (C) 24 hours after stimulation with an- ti-IgE or DNP-HSA. IL-33, IFN-γ, IL-17, and IL-4 were measured, but were below the level of detection. Data correspond to bone marrow derived MCs obtained from Balb/c mice. MMC, mucosal mast cell; CTMC, connective tissue mast cell; RT-PCR, real-time polymerase chain reaction; IgE, immuno- globulin E; DNP-HAS, dinitrophenylated human serum albumin; IL, interleu- kin; IFN, interferon; MC, mast cell. *P<0.05; †P<0.01; ‡P<0.001; §P<0.0001.
Fold increase (log2)
IL-1B IL-3 IL-4 IL-6 IL-10 IL-13 IL-17 IL-33 IFN TNF TSLP 215
210 25 20 2-5
†
*
‡
*
* MMCsCTMCs
A
pg/mL
Medium Anti-IgE DNP-HSA 800
600 400 200 0
IL-6
pg/mL
Medium Anti-IgE DNP-HSA 80
60 40 20 0
IL-13
*
pg/mL
Medium Anti-IgE DNP-HSA 400
300 200 100 0
TNF-α
B
MMCsCTMCs
pg/mL
Medium Anti-IgE DNP-HSA 200
150 100 50 0
IL-10
§
§
pg/mL
Medium Anti-IgE DNP-HSA 40
30 20 10 0
TSLP*
C β-hexosaminidase released
Total β-hexosaminidase present in supernatant and cell contents
2×Δsupernatant (A405 nm)
Δsupernatant (A405 nm)+{4×Δcell lysate (A405 nm)}
staining with toluidine blue. In contrast, both CTMCs and MMCs could be stained with chloroacetate esterase dye (Fig. 2A and B).
Activation, degranulation, and cytokine production of MMCs and CTMCs
MCs were sensitized either with polyclonal mouse IgE or anti- DNP IgE. Activation of MMCs and CTMCs with anti-IgE or spe- cific antigen (dinitrophenylated human serum albumin [DNP- HSA]) resulted in an increase in intracellular phospho-Syk, sur- face expression of the granule protein LAMP-1 (CD107), and degranulation (β-hexosaminidase release) (Fig. 3A-C) in a dose- dependent manner (data not shown). When MCs were activat- ed, the levels of phospho-Syk decreased to the levels of non-ac- tivated cells after 30 minutes from the addition of stimuli. Sur- prisingly, when MCs were activated using the system Anti-DNP/
DNP-HAS (human serum albumin), but not IgE/anti-IgE, we observed a biphasic increase in phospho-Syk that increased again after 1 hour and was sustained even after 24 hours from initial activation (Fig. 3A). Similar responses to polyclonal or
monoclonal activation were observed for MMCs and CTMCs.
Compound 48/80 is a polymer that has been used to trigger MC degranulation in an IgE-independent manner and has been described as selective for CTMCs. MMCs and CTMCs degranu- lated after stimulation with compound 48/80 in a dose-depen- dent manner (Fig. 3D). CTMC were slightly more sensitive to 48/80, and degranulated at 10 µg/mL, while the threshold was 50 µg/mL for MMCs. However, at higher doses both CTMCs and MMCs responded to 48/80 with degranulation.
We examined cytokine mRNA expression and secretion. Two hours after activation, mRNA expression of IL-3, IL-6, IL-13, IL- 33, IFN-γ (in MMCs), TNF-α, and TSLP was increased by IgE cross-linking. The levels of IL-13, IFN-γ, TNF-α, and TSLP were higher in MMCs than in CTMCs (Fig. 4A), while IL-33 expres- sion was higher in CTMCs than in MMCs. Interestingly, IL-10 induction was only detected in CTMCs, but not MMCs. Two hours after activation, MMCs and CTMCs produced and se- creted similar levels of IL-6, IL-13, and TNF-α (Fig. 4B). Twenty- four hours after activation, TSLP was detected in both MMCs
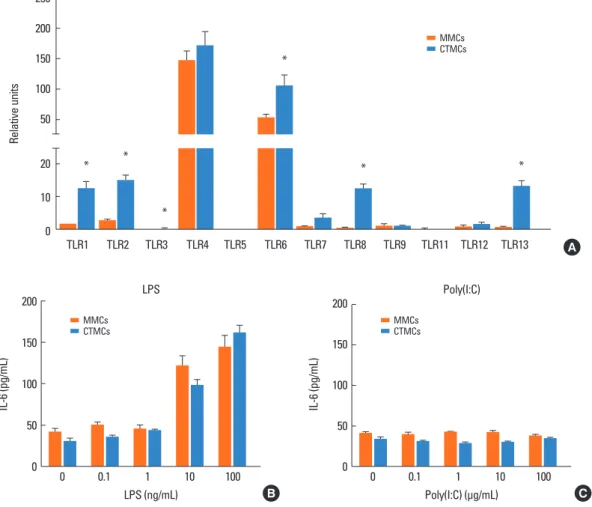
Fig. 5. TLRs on MMCs and CTMCs. (A) TLR1, TLR2, TLR3, TLR4, TLR5, TLR6, TLR7, TLR8, TLR9, TLR11, TLR12, and TLR13 expression by MMCs and CTMCs, expressed as relative expression compared to housekeeping gene. IL-6 secretion from MMCs and CTMCs after stimulation with a dose range of LPS (B) or poly(I:C) (C) for 24 hours in the absence of anti-IgE. Data correspond to bone marrow derived MCs obtained from Balb/c mice. TLR, toll-like receptor; MMC, mucosal mast cell; CTMC, connective tissue mast cell; IL, interleukin; LPS, lipopolysaccharide; IgE, immunoglobulin E; MC, mast cell. *P<0.05.
Relative units
TLR1 TLR2 TLR3 TLR4 TLR5 TLR6 TLR7 TLR8 TLR9 TLR11 TLR12 TLR13 250
200 150 100 50
* * **
*
*
* *
MMCsCTMCs
20 10 0
A
IL-6 (pg/mL)
0 0.1 1 10 100
LPS (ng/mL) 200
150 100 50 0
LPS
MMCsCTMCs
B
IL-6 (pg/mL)
0 0.1 1 10 100
Poly(I:C) (μg/mL) 200
150 100 50 0
Poly(I:C)
MMCsCTMCs
C
Benedé et al. Volume 10, Number 3, May 2018
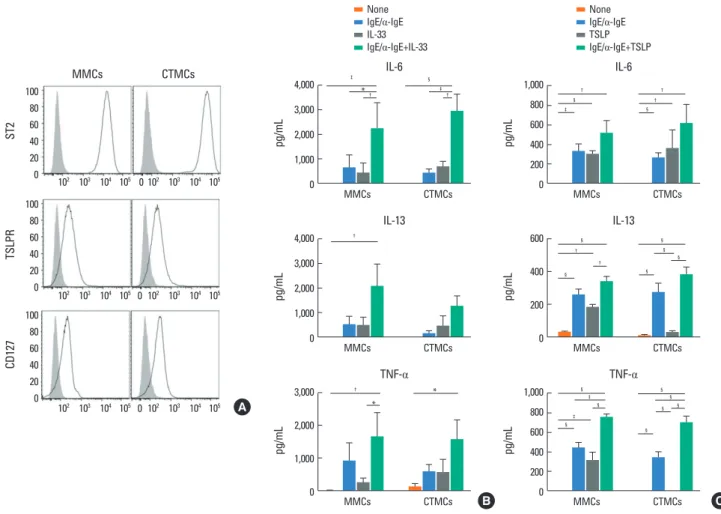
Fig. 6. Effect of IL-33 and TSLP on MMCs and CTMCs. (A) ST2, TSLPR, and CD127 expression by MMCs and CTMCs in the absence of anti-IgE stimulation. IL-6, IL- 13, and TNF-α secretion by MMCs and CTMCs after 24 hours of stimulation with 100 ng/mL IL-33 (B) or TSLP (C), alone or in the presence of anti-IgE. Showed data correspond to bone marrow-derived MCs obtained from Balb/c mice. Note the difference in scale between (B) and (C). IL, interleukin; TSLP, thymic stromal lympho- poietin; MMC, mucosal mast cell; CTMC, connective tissue mast cell; TSLPR, thymic stromal lymphopoietin receptor; IgE, immunoglobulin E; TNF, tumor necrosis fac- tor; MC, mast cell. *P<0.05; †P<0.01; ‡P<0.001; §P<0.0001.
NoneIgE/α-IgE IL-33 IgE/α-IgE+IL-33
NoneIgE/α-IgE TSLP IgE/α-IgE+TSLP
MMCs CTMCs
ST2
102 103 104 105 0 102 103 104 105 100
80 60 40 20 0
TSLPR
102 103 104 105 0 102 103 104 105 100
80 60 40 20 0
CD127
102 103 104 105 0 102 103 104 105 100
80 60 40 20 0
‡ §
*† ‡†
pg/mL
4,000 3,000 2,000 1,000 0
IL-6
MMCs CTMCs
† †
§ †
‡ §
pg/mL
1,000 800 600 400 200 0
IL-6
MMCs CTMCs
†
pg/mL
4,000 3,000 2,000 1,000 0
IL-13
MMCs CTMCs
§ §
† §
§
† §
§
pg/mL
600
400
200
0
IL-13
MMCs CTMCs
§ §
§
‡
§ §
‡
§
§
§
pg/mL
1,000 800 600 400 200 0
TNF-α
MMCs CTMCs
† *
*
pg/mL
3,000
2,000
1,000
0
TNF-α
MMCs CTMCs
A
B C
and CTMCs, and IL-10 was detected in CTMC (Fig. 4C). The cy- tokines IL-3, IL-4, IL-17, IL-33, and IFN-γ were below the level of detection by ELISA in the supernatants of activated MCs.
Expression of toll-like receptors (TLRs) in MMCs and CTMCs MCs have been described to express different numbers of TLRs, which can contribute to their host defense function. We exam- ined expression of TLR1-TLR13 by RT-PCR (Fig. 5A). Relative expression of TLRs 4 and 6 dominated, with low level of other TLRs. CTMC had significantly higher levels of TLR1, TLR2, TLR3, TLR6, TLR8, and TLR13 compared to MMCs. Stimulation of CTMCs and MMCs with the TLR4 ligand LPS, but not the TLR3 ligand poly(I:C), resulted in activation shown by IL-6 secretion (Fig. 5B and C). Similar results were obtained from CTMCs and MMCs derived from C57BL/6 mice (not shown).
Effect of IL-33 and TSLP on MMCs and CTMCs
In addition to responding through IgE receptors and TLRs,
MCs can also sense and respond to cytokines in the environ- ment. We examined the response of MMCs and CTMCs to IL-33 and TSLP. MMCs and CTMCs express high levels of the IL-33 re- ceptor ST2 and also express 2 components of the TSLPR and the IL-7R alpha chain (CD127) (Fig. 6A). IL-33 increased cytokine production by MMCs and CTMCs, alone or in combination with IgE cross-linking (Fig. 6B). Similarly, TSLP enhanced the produc- tion of IL-6, IL-13, and TNF-α at baseline and in combination with IgE cross-linking in MMCs (Fig. 6C). Similar results were obtained for IL-6 and IL-13 secretion by CTMCs after TSLP stimulation. TNF-α secretion by CTMCs was only increa sed by TSLP when it was applied in combination with IgE cross-link- ing.
DISCUSSION
In this manuscript, we provide a systematic characterization of the immune profile of bone marrow-derived models of MCs
representing mucosal and connective tissue sites. Our findings are presented as a useful toolkit to have appropriate reduction- ist model systems in order to study the cell biology of MCs.
MCs derive from mononuclear precursor cells and undergo their final phase of differentiation in tissues under the control of local tissue factors. MCs have been generated in vitro from mouse bone marrow, most commonly using recombinant IL-3 (or con- ditioned media from IL-3 -secreting cell lines). In 1993, Eklund et al.19 described that the combination of SCF and the cytokine IL-9 could induce the expression of MMCP-1 and MMCP-2, 2 proteases associated with MMCs, while IL-4 suppressed the in- duction of these 2 proteases. Miller et al.20 reported that TGF-β, a cytokine highly expressed in the intestinal microenvironment, also enhanced the expression of MMCP-1. Our goal was to use these approaches described for the generation of CTMCs and MMCs to describe and compare the functional characteristics of these 2 MC subsets. Although it has been described that the sensitivity of the MCs and surface density of FcεRI on MC sur- face is also influenced by IgE concentration in the culture me- dium,21 we did not use it to avoid sensitization of the cells.
Consistent with the literature,17,22,23 We show that culture of bone marrow cells with SCF, IL-3, and IL-4 for 4 weeks gener- ates cells that express proteases compatible with CTMCs (MMCP- 4, MMCP-5, MMCP-6, MMCP-7, and CPA), while growth of bone marrow cells with SCF, IL-3, TGF-β, and IL-9 generates cells that express proteases compatible with MMCs (MMCP-1 and MMCP- 2). Moreover, we found MMCP-2 expression to be a good mark- er for MMCs, as it has previously been confirmed in murine tis- sues by immunohistochemistry.5 This was true for both Balb/c and C57BL/6 mice, allowing for the use of widely available ge- netically modified mice. It should be noted that C57BL/6 mice have a naturally occurring mutation in MMCP-7, and this pro- tease is not a useful biomarker of MC activation for this strain of mouse.24 In humans, MCs are not classified based on their ana- tomic location, but the content of MC-specific proteases chy- mase and tryptase is the main criterion for MC subtypes,25-27 be- ing the human MCs that only express tryptase more likely MMCs and the human MCs that express chymase and tryptase like CTMCs.28,29 The yield and rate of growth was substantially great- er for cells grown under MMC conditions probably due to the presence of IL-9 in the media, which promotes MC prolifera- tion.30 We then examined the functional characteristics of MCs grown under these different conditions. We observed that MMCs, but not CTMCs, could be easily stained with toluidine blue dye, as it has previously been described by Broome and Villarreal in 2012.31 Both in vitro systems could be readily activated by simi- lar stimuli, including cross-linking of surface-bound monoclo- nal and polyclonal IgE as well as non-IgE stimuli, including 48/80, the TLR4 ligand LPS, and cytokines, such as IL-33 and TSLP. We did not observe selectivity of 48/80 for CTMCs using this in vi- tro model system, although CTMCs showed a greater sensitivi- ty to 48/80 than MMCs, as has been described in vivo.32 In ad-
dition to activation through IgE and cytokines, MCs are sensors that can respond through pattern recognition receptors to mi- crobial patterns. There are 10 human TLRs (TLR1-TLR10) and 12 mouse TLRs (TLR1-TLR9 and TLR11-TLR13),33 with no mouse homolog for TLR10.34 Expression of TLR1-TLR10 with the ex- ception of TLR8 has been identified on human MCs.35-40 The TLRs appear to be widely expressed by murine MCs, with ex- pression of TLR1-TLR4 and TLR6-TLR9 identified at least at the mRNA level,41-47 which is very consistent with our in vitro sys- tems. We found that CTMCs expressed significantly higher lev- els of several TLRs (TLR1, TLR2, TLR3, TLR6, TLR8, and TLR13) compared to MMCs. However, MMCs and CTMCs were simi- larly responsive to LPS stimulation, and TLR4 was similarly high- ly expressed by the 2 subsets, consistent with previous reports.48 The role of microbial factors in shaping MC function is of inter- est as there is growing evidence for an important regulatory in- fluence of the microbiota in pathologies, such as food allergy.49 Expression of TLR5 has not been demonstrated on murine MCs41,42,44,45 and we did not detect its expression in either of the 2 in vitro MC systems.
Phospho-Syk signaling, degranulation as measured by release of β-hexosaminidase and expression of LAMP-1 (CD107) on the cell surface, and release of the cytokines IL-6, IL-13, and TNF-α were common to both CTMCs and MMCs after stimulation thr- ough cross-linking of IgE. The induction of IL-10 was observed at both the mRNA and protein levels after IgE cross-linking in CTMCs, but not MMCs. Therefore, whether MCs promote or suppress regulatory T cell responses may depend on their tis- sue programming.
An additional mechanism of non-IgE-mediated activation of MCs occurs through cytokines. Epithelial-derived cytokines, in- cluding IL-33 and TSLP, play a key role in driving food allergy and atopic dermatitis, as shown in models of sensitization through either the skin or the gastrointestinal tract.50-54 Our data demon- strated that both MMCs and CTMCs have the capacity to respond to IL-33 and TSLP, and respond with cytokine production in the absence of degranulation. Therefore, the epithelial-derived cy- tokine environment is another layer of regulation dictating the inflammatory tone of tissue MCs.
In summary, we present a methodological description of in vitro modeling of gastrointestinal and skin MCs derived from bone marrow progenitors of mice. We show that the cytokine milieu not only determines the protease content of the MCs, but influences their function through production of tolerogenic and inflammatory cytokines and expression of innate immune receptors. These reductionist model systems are useful experi- mental tools for mechanistic studies or therapeutic screens in the context of pathologies involving MCs, such as allergy.
ACKNOWLEDGMENTS
This work was supported by grants from National Institute of
Benedé et al. Volume 10, Number 3, May 2018
Allergy and Infectious Diseases (NIAID; R01 AI093577).
ORCID
Sara Benedé https://orcid.org/0000-0002-9288-9438 Evan Cody https://orcid.org/0000-0003-0445-1119 Charuta Agashe https://orcid.org/0000-0001-8820-8655 M. Cecilia Berin https://orcid.org/0000-0002-9051-9249 REFERENCES
1. Brandt EB, Strait RT, Hershko D, Wang Q, Muntel EE, Scribner TA, et al. Mast cells are required for experimental oral allergen-induced diarrhea. J Clin Invest 2003;112:1666-77.
2. Sun J, Arias K, Alvarez D, Fattouh R, Walker T, Goncharova S, et al.
Impact of CD40 ligand, B cells, and mast cells in peanut-induced anaphylactic responses. J Immunol 2007;179:6696-703.
3. Reber LL, Marichal T, Mukai K, Kita Y, Tokuoka SM, Roers A, et al.
Selective ablation of mast cells or basophils reduces peanut-induced anaphylaxis in mice. J Allergy Clin Immunol 2013;132:881-888.e1- 11.
4. Galli SJ, Tsai M. IgE and mast cells in allergic disease. Nat Med 2012;
18:693-704.
5. Xing W, Austen KF, Gurish MF, Jones TG. Protease phenotype of constitutive connective tissue and of induced mucosal mast cells in mice is regulated by the tissue. Proc Natl Acad Sci U S A 2011;108:
14210-5.
6. Moon TC, St Laurent CD, Morris KE, Marcet C, Yoshimura T, Sekar Y, et al. Advances in mast cell biology: new understanding of het- erogeneity and function. Mucosal Immunol 2010;3:111-28.
7. Welle M. Development, significance, and heterogeneity of mast cells with particular regard to the mast cell-specific proteases chy- mase and tryptase. J Leukoc Biol 1997;61:233-45.
8. Gurish MF, Austen KF. Developmental origin and functional spe- cialization of mast cell subsets. Immunity 2012;37:25-33.
9. Galli SJ, Tsai M, Marichal T, Tchougounova E, Reber LL, Pejler G.
Approaches for analyzing the roles of mast cells and their proteas- es in vivo. Adv Immunol 2015;126:45-127.
10. Bryce PJ, Falahati R, Kenney LL, Leung J, Bebbington C, Tomasevic N, et al. Humanized mouse model of mast cell-mediated passive cutaneous anaphylaxis and passive systemic anaphylaxis. J Allergy Clin Immunol 2016;138:769-79.
11. Sellge G, Bischoff SC. Isolation, culture, and characterization of in- testinal mast cells. Methods Mol Biol 2006;315:123-38.
12. Kulka M, Metcalfe DD. Isolation of tissue mast cells. Curr Protoc Immunol 2010;Chapter 7:Unit 7.25.
13. Jensen BM, Swindle EJ, Iwaki S, Gilfillan AM. Generation, isolation, and maintenance of rodent mast cells and mast cell lines. Curr Pro- toc Immunol 2006;Chapter 3:Unit 3.23.
14. Stassen M, Arnold M, Hültner L, Müller C, Neudörfl C, Reineke T, et al. Murine bone marrow-derived mast cells as potent producers of IL-9: costimulatory function of IL-10 and kit ligand in the pres- ence of IL-1. J Immunol 2000;164:5549-55.
15. Vukman KV, Visnovitz T, Adams PN, Metz M, Maurer M, O’Neill SM. Mast cells cultured from IL-3-treated mice show impaired re- sponses to bacterial antigen stimulation. Inflamm Res 2012;61:79- 85.
16. Kovarova M. Isolation and characterization of mast cells in mouse
models of allergic diseases. Methods Mol Biol 2013;1032:109-19.
17. Friend DS, Ghildyal N, Austen KF, Gurish MF, Matsumoto R, Ste- vens RL. Mast cells that reside at different locations in the jejunum of mice infected with Trichinella spiralis exhibit sequential chang- es in their granule ultrastructure and chymase phenotype. J Cell Biol 1996;135:279-90.
18. Rådinger M, Jensen BM, Swindle E, Gilfillan AM. Assay of mast cell mediators. Methods Mol Biol 2015;1220:307-23.
19. Eklund KK, Ghildyal N, Austen KF, Stevens RL. Induction by IL-9 and suppression by IL-3 and IL-4 of the levels of chromosome 14- derived transcripts that encode late-expressed mouse mast cell pro- teases. J Immunol 1993;151:4266-73.
20. Miller HR, Wright SH, Knight PA, Thornton EM. A novel function for transforming growth factor-beta1: upregulation of the expres- sion and the IgE-independent extracellular release of a mucosal mast cell granule-specific beta-chymase, mouse mast cell prote- ase-1. Blood 1999;93:3473-86.
21. Frandsen PM, Krohn IJ, Hoffmann HJ, Schiøtz PO. The influence of IgE on cultured human mast cells. Allergy Asthma Immunol Res 2013;5:409-14.
22. Friend DS, Ghildyal N, Gurish MF, Hunt J, Hu X, Austen KF, et al.
Reversible expression of tryptases and chymases in the jejunal mast cells of mice infected with Trichinella spiralis. J Immunol 1998;160:
5537-45.
23. Stevens RL, Friend DS, McNeil HP, Schiller V, Ghildyal N, Austen KF. Strain-specific and tissue-specific expression of mouse mast cell secretory granule proteases. Proc Natl Acad Sci U S A 1994;91:
128-32.
24. Hunt JE, Stevens RL, Austen KF, Zhang J, Xia Z, Ghildyal N. Natural disruption of the mouse mast cell protease 7 gene in the C57BL/6 mouse. J Biol Chem 1996;271:2851-5.
25. Heutinck KM, ten Berge IJ, Hack CE, Hamann J, Rowshani AT. Ser- ine proteases of the human immune system in health and disease.
Mol Immunol 2010;47:1943-55.
26. Pejler G, Rönnberg E, Waern I, Wernersson S. Mast cell proteases:
multifaceted regulators of inflammatory disease. Blood 2010;115:
4981-90.
27. Pejler G, Abrink M, Ringvall M, Wernersson S. Mast cell proteases.
Adv Immunol 2007;95:167-255.
28. Irani AM, Goldstein SM, Wintroub BU, Bradford T, Schwartz LB.
Human mast cell carboxypeptidase. Selective localization to MCTC cells. J Immunol 1991;147:247-53.
29. Irani AA, Schechter NM, Craig SS, DeBlois G, Schwartz LB. Two types of human mast cells that have distinct neutral protease com- positions. Proc Natl Acad Sci U S A 1986;83:4464-8.
30. Feng LL, Gao JM, Li PP, Wang X. IL-9 contributes to immunosup- pression mediated by regulatory T cells and mast cells in B-cell non- hodgkin’s lymphoma. J Clin Immunol 2011;31:1084-94.
31. Broome M, Villarreal B. Differential staining of mast cells with tolu- idine blue. J Histotechnol 2012;35:27-30.
32. Ikawati Z, Hayashi M, Nose M, Maeyama K. The lack of compound 48/80-induced contraction in isolated trachea of mast cell-deficient Ws/Ws rats in vitro: the role of connective tissue mast cells. Eur J Pharmacol 2000;402:297-306.
33. Lee CC, Avalos AM, Ploegh HL. Accessory molecules for Toll-like receptors and their function. Nat Rev Immunol 2012;12:168-79.
34. Sandig H, Bulfone-Paus S. TLR signaling in mast cells: common and unique features. Front Immunol 2012;3:185.
35. McCurdy JD, Olynych TJ, Maher LH, Marshall JS. Cutting edge: dis-
tinct Toll-like receptor 2 activators selectively induce different class- es of mediator production from human mast cells. J Immunol 2003;
170:1625-9.
36. Okumura S, Kashiwakura J, Tomita H, Matsumoto K, Nakajima T, Saito H, et al. Identification of specific gene expression profiles in human mast cells mediated by Toll-like receptor 4 and Fcepsilon- RI. Blood 2003;102:2547-54.
37. Varadaradjalou S, Féger F, Thieblemont N, Hamouda NB, Pleau JM, Dy M, et al. Toll-like receptor 2 (TLR2) and TLR4 differentially activate human mast cells. Eur J Immunol 2003;33:899-906.
38. Kulka M, Alexopoulou L, Flavell RA, Metcalfe DD. Activation of mast cells by double-stranded RNA: evidence for activation through Toll-like receptor 3. J Allergy Clin Immunol 2004;114:174-82.
39. Kulka M, Metcalfe DD. TLR3 activation inhibits human mast cell attachment to fibronectin and vitronectin. Mol Immunol 2006;43:
1579-86.
40. Yoshioka M, Fukuishi N, Iriguchi S, Ohsaki K, Yamanobe H, Inukai A, et al. Lipoteichoic acid downregulates FcepsilonRI expression on human mast cells through Toll-like receptor 2. J Allergy Clin Im- munol 2007;120:452-61.
41. McCurdy JD, Lin TJ, Marshall JS. Toll-like receptor 4-mediated acti- vation of murine mast cells. J Leukoc Biol 2001;70:977-84.
42. Supajatura V, Ushio H, Nakao A, Okumura K, Ra C, Ogawa H. Pro- tective roles of mast cells against enterobacterial infection are me- diated by Toll-like receptor 4. J Immunol 2001;167:2250-6.
43. Masuda A, Yoshikai Y, Aiba K, Matsuguchi T. Th2 cytokine produc- tion from mast cells is directly induced by lipopolysaccharide and distinctly regulated by c-Jun N-terminal kinase and p38 pathways. J Immunol 2002;169:3801-10.
44. Ikeda T, Funaba M. Altered function of murine mast cells in response to lipopolysaccharide and peptidoglycan. Immunol Lett 2003;88:
21-6.
45. Matsushima H, Yamada N, Matsue H, Shimada S. TLR3-, TLR7-, and TLR9-mediated production of proinflammatory cytokines and
chemokines from murine connective tissue type skin-derived mast cells but not from bone marrow-derived mast cells. J Immunol 2004;
173:531-41.
46. Li G, Domenico J, Jia Y, Lucas JJ, Gelfand EW. NF-kappaB-depen- dent induction of cathelicidin-related antimicrobial peptide in mu- rine mast cells by lipopolysaccharide. Int Arch Allergy Immunol 2009;150:122-32.
47. Mrabet-Dahbi S, Metz M, Dudeck A, Zuberbier T, Maurer M. Mu- rine mast cells secrete a unique profile of cytokines and prostaglan- dins in response to distinct TLR2 ligands. Exp Dermatol 2009;18:
437-44.
48. Saluja R, Delin I, Nilsson GP, Adner M. FcεR1-mediated mast cell reactivity is amplified through prolonged Toll-like receptor-ligand treatment. PLoS One 2012;7:e43547.
49. Blázquez AB, Berin MC. Microbiome and food allergy. Transl Res 2017;179:199-203.
50. Blázquez AB, Mayer L, Berin MC. Thymic stromal lymphopoietin is required for gastrointestinal allergy but not oral tolerance. Gas- troenterology 2010;139:1301-9.
51. Tordesillas L, Goswami R, Benedé S, Grishina G, Dunkin D, Järvin- en KM, et al. Skin exposure promotes a Th2-dependent sensitiza- tion to peanut allergens. J Clin Invest 2014;124:4965-75.
52. Chu DK, Llop-Guevara A, Walker TD, Flader K, Goncharova S, Bou- dreau JE, et al. IL-33, but not thymic stromal lymphopoietin or IL- 25, is central to mite and peanut allergic sensitization. J Allergy Clin Immunol 2013;131:187-200.e1-8.
53. Han H, Thelen TD, Comeau MR, Ziegler SF. Thymic stromal lym- phopoietin-mediated epicutaneous inflammation promotes acute diarrhea and anaphylaxis. J Clin Invest 2014;124:5442-52.
54. Galand C, Leyva-Castillo JM, Yoon J, Han A, Lee MS, McKenzie AN, et al. IL-33 promotes food anaphylaxis in epicutaneously sensitized mice by targeting mast cells. J Allergy Clin Immunol 2016;138:1356- 66.