DOI: 10.4150/KPMI.2015.22.1.1
Simulation and Experiment of Injection Molding Process for Superalloy Feedstock
Im Doo Jung, Youngmoo Kima, and Seong Jin Park*
Department of Mechanical Engineering, Pohang University of Science and Technology, Pohang 790-784, Korea
aAgency for Defense Development, Daejeon 305-600, Korea
(Received January 22, 2015; Revised February 1, 2015; Accepted February 4, 2015)
···
Abstract Powder injection molding is an important manufacturing technology to mass produce superalloy compo- nents with complex shape. Injection molding step is particularly important for realizing a desired shape, which requires much time and efforts finding the optimum process condition. Therefore computer aided engineering can be very useful to find proper injection molding conditions. In this study, we have conducted a finite element method based simulation for the spiral mold test of superalloy feedstock and compared the results with experimental ones. Sensitivity analysis with both of simulation and experiment reveals that the melt temperature of superalloy feedstock is the most important factor for the full filling of mold cavity. The FEM based simulation matches well the experimental results. This study contributes to the optimization of superalloy powder injection molding process.
Keywords: Injection molding simulation, Powder Injection molding, Spiral mold, Short shot series test, Superalloy feed- stock
···
1. Introduction
A superalloy turbocharger has been developed to enhance the combustion efficiency of an engine by recycling heat energy of exhaust gas [1-3]. In order to improve its per- formance capability, the shape of the blade has been more complex [4]. Moreover, its material has been replaced by nickel-based superalloy from steel because of its excel- lent mechanical strength and oxidation resistance at the elevated temperature [5]. However, the superalloy obtained from casting metallurgy process exhibits degraded mechani- cal properties and workability due to its coarse and inho- mogeneous microstructures [6]. Therefore, a new processing technique should be introduced to achieve the following conditions simultaneously; excellent hot mechanical strength, homogeneous microstructures and complex aero-dynami- cal shape.
Powder injection molding (PIM) has been considered as an alternative manufacturing technique to fabricate the turbine blade because it enables production of small and precise metal components with sound microstructural
properties [7]. The process is composed of several proce- dures; production of a feedstock, injection molding with desired shape, debinding by removing the binder ingredi- ents, and consolidation to near full density. Among four steps, the injection molding is known to be a critical step to realize the desired shape [8]. Therefore, it is essential to optimize the injection molding process parameters, such as injection time, mold temperature, melt tempera- ture and packing pressure. Extensive trial-and-error pro- cedures to optimize the process conditions require excessive time and efforts, resulting in increasing produc- tion cost. Therefore, prior to the injection molding, com- puter simulation programs, such as Moldflow, have been applied to reduce fabrication cost [9-10]. However, there have been few researches on investigating the injection molding of superalloy feedstock for the turbocharger component.
In this study, we have investigated the flowability of superalloy feedstock by a ladder and a spiral molds. Its experimental results were compared to the simulation ones.
*Corresponding Author: Seong Jin Park, TEL: +82-54-279-2182, FAX: +82-54-279-5899, E-mail: [email protected]
<PM리뷰>
2. Experiment and Simulation Method
In the present study, we used gas-atomized Inconel 713C powders (Carpenter Technology Corp.) with an average particle size of 10 mm and spherical shape as shown in the SEM image of Fig. 1. The binder sys- tem used in this study was composed of paraffin wax (PW) as a main component to control viscosity, polypropylene (PP) and polyethylene (PE) as back- bone components, and stearic acid (SA) as a surface active agent. The superalloy feedstock was prepared by mixing superalloy powders and binders in a batch type mixer for 3 hours. A commercial injection mold- ing software, Moldflow, was used to simulate the short shot series test and the sprial mold test. The rheologi- cal and thermal properties were provided from our previous works to conduct the numerical calculation.
The simulation was based on the finite element method (FEM) with the governing equations, such as Hele-Shaw, Cross-WLF, and two-domain Tait PVT models. Tetrahedral elements were generated with 3D volume mesh type.
3. Results and Discussion
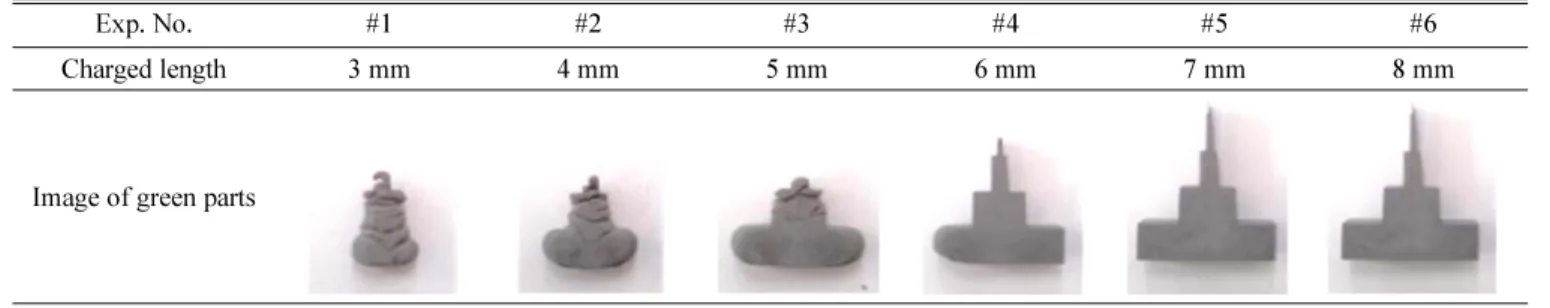
As shown in Table 1, a short shot series test has been conducted with the ladder mold by changing charge length of injection molding machine. One can see the filling pattern of superalloy feedstock from the long cuboid side to the thin cuboid side. In No. 4, left side of cuboid was filled faster than the other end. A jetting pat- tern was found in No. 1 and a fully filled component was found in No. 6. In Fig. 2, these filling patterns were com-
Fig. 1. SEM image of Inconel 713C powder.
Fig. 2. Comparison of short shot series test for experiment and simulation.
Table 1. Short-shot series test
Exp. No. #1 #2 #3 #4 #5 #6
Charged length 3 mm 4 mm 5 mm 6 mm 7 mm 8 mm
Image of green parts
Fig. 3. 3D mesh model for spiral mold simulation.
pared with simulation results. While the melt front shape of feedstock was different, the filling pattern of simula- tion matched well the experimental results.
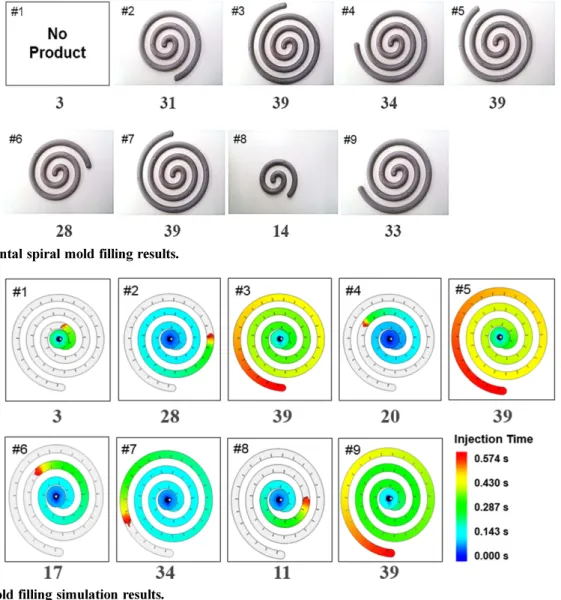
A spiral mold was employed for the injection molding experiments and simulations. In Fig. 3, the 3D mesh model of spiral mold is shown. The feedstock was injected through sprue and gate, which are orthogonal to the spiral mold surface. There are scale marks per every centimeter on the surface of spiral mold with total length of 39 cm. When the mold is fully filled, one reads thirty nine scale marks on molded part.
As shown in Table 2, L9 table of Taguchi method was used to conduct a sensitivity analysis for the spiral mold Table 2. L9 Taguchi table
#1 #2 #3 #4 #5 #6 #7 #8 #9
A (Injection Speed) 3 3 3 2 2 2 1 1 1
B (Packing Pressure) 1 2 3 1 2 3 1 2 3
C (Melt Temperature) 3 2 1 3 1 2 1 3 2
D (Mold Temperature) 1 2 3 3 1 2 2 3 1
Table 3. Levels for each process parameters
Level 1 Level 2 Level 3
A (Injection Speed, mm/s) 20 25 30
B (Packing Pressure, MPa) 117 147 177
C (Melt Temperature, oC) 150 160 170
D (Mold Temperature, oC ) 25 35 45
Fig. 4. Experimental spiral mold filling results.
Fig. 5. Spiral mold filling simulation results.
simulations and experiments. The injection speed, pack- ing pressure, melt temperature, and mold temperature for each three levels are summarized in Table 3. The nine experimental spiral mold results are shown in Fig. 4.
No. 1 process condition led to short-shot and No. 3, No.
5, and No. 7 led to full filling of the mold. Other condi- tions led to different level of filling as indicated in Fig. 4.
The same Taguchi method with L9 table was applied to simulation and the results are shown in Fig. 5. As in experimental result of No. 1, short shot appeared in No.1 of simulation. No. 3, No. 5 and No. 9 led to full filling while other conditions led to different level of filling. For the sensitivity analysis, the larger-the-better S/N ratio analysis was used as below:
where n is the number of levels for each parameters and yi is the mold filling percentage. As shown in Table 4 and Fig. 6, for the case injection speed (A), level 2 had the highest S/N ratio, which denotes that 25 mm/s could be a good injection speed condition for this spiral mold injec- tion molding of the superalloy feedstock. For both of the
packing pressure (B) and melt temperature (C), level 3 had the highest S/N ratio. Since they had higher S/N ratio in higher level, the optimum values can be at higher value than level 3. However, too high packing pressure and melt temperature are known to cause other side effect, such as flash generation or burning on the injec- tion molded part. For mold temperature (D), level 2 led to the highest S/N ratio, which indicates that 35oC can be an optimum mold temperature condition.
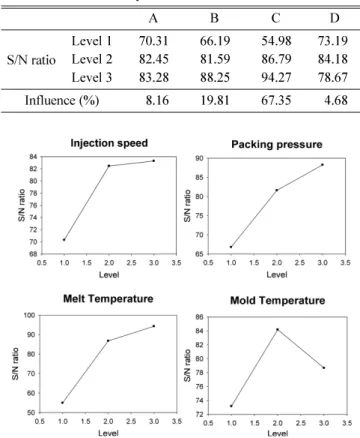
In the simulation, S/N ratios for each conditions are shown in Table 5 and Fig. 7. For the injection speed (A), level 3 led to the highest S/N ratio, which was slightly higher than level 2. While level 2 was slightly higher than level 3 in experiment, this is not a significant differ- ence with simulation. The packing pressure (B) and melt temperature (C) had level 3 as the highest S/N ratio, which are the same with the experiment. The mold tem- perature (D) also showed same pattern of S/N ratio, where level 2 had the highest S/N ratio.
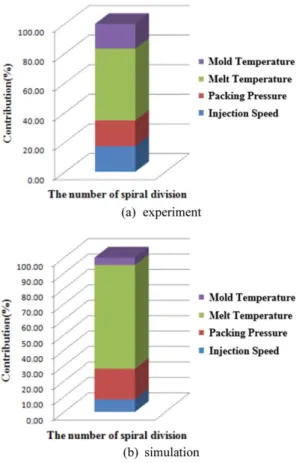
In Fig. 8, the influence factors of experiment and simu- lation are compared. For both of simulation and experi- ment, the melt temperature was the most influencing factor among four process condition factors. As shown in S N⁄ 10log 1
n--- 1 yi2
----
i 1=
∑n
⎝ ⎠
⎜ ⎟
⎛ ⎞
–
=
Table 4. S/N ratio analysis of experiment
A B C D
S/N ratio
Level 1 61.65 61.65 50.16 61.97 Level 2 88.66 84.35 90.03 88.88 Level 3 85.11 89.43 95.24 84.57 Influence (%) 17.22 17.48 48.60 16.70
Fig. 6. S/N ratio of spiral mold experiment.
Table 5. S/N ratio analysis of simulation
A B C D
S/N ratio
Level 1 70.31 66.19 54.98 73.19 Level 2 82.45 81.59 86.79 84.18 Level 3 83.28 88.25 94.27 78.67
Influence (%) 8.16 19.81 67.35 4.68
Fig. 7. S/N ratio of spiral mold simulation.
Fig. 8(b), the melt temperature effect was higher in the simulation than experiment. The packing pressure was also important influencing factor for the successful fill- ing for both of experiment and simulation. The mold temperature and injection speed were relatively less important than other factors.
4. Conclusions
Superalloy feedstock has been injection molded and simulated in a ladder mold and a spiral mold. Both of experiment and simulation showed that the melt tempera- ture was the most important factor for full filling of
superalloy feedstock in sprial mold among other process conditions as injection speed, packing pressure and mold temperature. For the packing pressure and melt temper- arute, higher level had higher S/N ratio, which indicates that higher packing pressure and higher melt temperature would lead to better result. The simulation of injection molding also matched well the experimental results. This experimental and computational study can be very useful for the powder injection molding of superalloy compo- nents.
Acknowledgments
This work was supported by the National Research Foundation of Korea (NRF) grant funded by the Korea government (NRF-2010-0026242/2011-0030075).
References
[1] C. Bell: Maximum Boost: Designing, Testing, and Install- ing Turbocharger Systems, Bentley publishers, Cambridge (1997) 31.
[2] A. Kusztelan, Y. F. Wao, D. R. Marchant and Y. Wang:
Int. J. Therm. Environ. Eng., 2 (2011) 75.
[3] P. R. Ghodke and J. G. Suryawanshi: Int. J. Mech. Eng.
Tech., 3 (2012) 620.
[4] B. I. Mamaev and M. R. Valeev: Therm. Eng., 57 (2010) 786.
[5] I. A Choudhury and M. A El-Baradie: J. Mater. Process.
Tech., 77 (1998) 278.
[6] E. A. Ezugwu: J. Soc. Tribologists Lub. Engs., 47 (1991) 751.
[7] J. L. Johnson, L. K. Tan, P. Suri and R. M. German:
PM2Tec2004, Chicago, 4 (2004) 89.
[8] C. M. Wang, R. L. Leonard and T. J. McCabe: P/M in aero- space defense and demanding applications, San Diego (1993) 7.
[9] L. Najimi and D. Lee: Int. J. Powder Metall., 30 (1994) 231.
[10] C. A. Hieber and S. F. Shen: J. Non-Newtonian Fluid.
Mech., 7 (1980) 1.
Fig. 8. Influence factor analysis for (a) experiment and (b) simulation.