Global Star Formation Efficiency of Local Galaxies
Hyunjin Shim*
Department of Earth Science Education, Kyungpook National University, Daegu 702-701, Korea
Abstract: This study presents the global star formation efficiency (SFE) of 272 local star-forming galaxies based on the HI gas mass, stellar mass, star formation rate (SFR), and morphology. The SFE increases as the stellar mass increases while the specific SFR decreases. The SFE is enhanced for galaxies with large Há equivalent widths, which is primarily due to the large SFR, not due to the large available amount of gas. The SFE is also enhanced by a factor of ~2 for merging systems compared to the normal spirals, showing that the merger-induced high pressure and density environment are crucial for the active star formation. Based on the SFR scaling relation, I present a SFR calibration formula using the HI gas mass.
Keywords: galaxies, star formation, evolution
Introduction
Star formation is a fundamental process that governs galaxy formation and evolution. The studies of star- forming galaxies at different redshifts (e.g., Steidel et al., 1999; Arnouts et al., 2005; Bouwens et al., 2006, 2007; Shim et al., 2011) provides strong constraints on the galaxy evolution as well as the cosmic chemical enrichment history. Thanks to the numerous deep, multi-wavelength surveys, our knowledge about star formation rate and stellar mass has been advanced significantly. Such physical properties are correlated with each other, implying the existence of global star formation scaling law that determines cosmic star formation history (Clark et al., 2008). However, whether the star formation scaling law is independent of galaxy properties is still a controversial issue.
The empirical star formation scaling law is represented by Kennicutt-Schmidt law (K-S law;
Schmidt, 1959; Kennicutt, 1998), describing that the star formation rate is proportional to the gas density
(ΣSFR/Σgas1.4). Stars form from neutral interstellar gas, particularly in dense and cold giant molecular clouds (e.g., McKee and Ostriker, 2007). The parameter that measures how efficient the star formation process is called the “star formation efficiency (SFE)”, which is defined by the ratio between the gas depletion timescale (Leroy et al., 2008) and the free-fall timescale for a star formation. Observationally, this is simply expressed as the amount of stars currently being formed (star formation rate; SFR) divided by the existing gas mass (e.g., Young et al., 1996;
Schiminovich et al., 2010; Combes et al., 2011).
While the K-S law is globally applicable, a simple expectation is that the SFE as well as the SFR increases as the gas mass increases. However, there exists a variation on the slope of the K-S relation for galaxies with different amount of SFR. Studies have reported that galaxies with large SFR, e.g., starbursts, ultra-luminous IR galaxies, and submm galaxies, show different characteristics in the ΣSFR-Σgas plane with a steeper slope (Genzel et al., 2010). This suggests that galaxies with large SFR have an enhanced SFE compared to the normal galaxies. It is not clear that the increase of the SFE in such galaxies is due to the local events such as the galaxy-galaxy interaction or to the internal characteristics of star formation itself as the SFR gets larger. On the other hand, Shiminovich et al. (2010) suggested that the SFE remains to be consistent at stellar mass range larger than 1010M⊙
*Corresponding author: [email protected]
*Tel: +82-53-950-5921
*Fax: +82-53-950-5946
This is an Open-Access article distributed under the terms of the Creative Commons Attribution Non-Commercial License (http://
creativecommons.org/licenses/by-nc/3.0) which permits unrestricted non-commercial use, distribution, and reproduction in any medium, provided the original work is properly cited.
regardless of stellar mass and light concentration, thus argued that the external process or feedback controlling the gas supply is the main driver for star formation regulation in massive galaxies.
Previous studies are carried out using relatively massive (>1010M⊙) galaxies. However, the mean stellar mass of star-forming galaxies decreases as the redshift increases, thus studies on SFE of star-forming galaxies with moderate stellar mass (<1010M⊙) is necessary as they signpost for high-redshift star forming galaxies. In this paper, I investigated the variation of the global SFE of local (z < 0.1) galaxies detected in blind HI survey whose stellar mass ranges between 107 M⊙<M*<1011M⊙. I compared the specific SFR and the SFE as a function of stellar mass, with the aid of the Hα equivalent width that reflects the specific SFR. The relation between the morphology and the SFE was explored. Finally I present the calibration formula to derive the SFR of a galaxy using the HI gas mass.
Sample
In order to assess the relation between the global star formation efficiency and the galaxy physical properties such as the SFR, I constructed a sample of galaxies by combining the HI survey and the optical spectroscopic data catalogs. I used the initial α. 40 data release of the ‘Arecibo Legacy Fast ALFA Survey (ALFALFA)’, a wide-field blind HI survey in the local universe (Haynes et al., 2011; Giovanelli et al., 2005). The HI catalog was cross-matched with the Sloan Digital Sky Survey (SDSS) spectroscopic data. I used the SDSS DR7 MPA-JHU value added catalog1) (Kauffmann et al., 2003; Brinchmann et al., 2004). By choosing the blind HI survey, the sample would be free of selection biases compared to other star-forming galaxy selection using color or flux limits.
The initial radio-to-optical matching radius was 3".
After finding the nearest optical position from the HI position, each object was visually inspected in the
SDSS images to check whether the identification is correct. I removed the active galactic nuclei-dominated systems using the Baldwin, Phillips and Terlevich (BPT; Baldwin et al., 1981) diagram. Finally, I am left with 272 objects with HI gas mass measured from the ALFALFA survey (MHI> 106 M⊙) whose spectra are available through SDSS spectroscopy. The ALFALFA- SDSS matched galaxies are at 0.01<z<0.1. Most of them (~95%) are at z<0.05.
Stellar mass, star formation rate, Hα equivalent width used in this paper are drawn from the MPA- JHU value added catalog. The values are obtained through the spectral and multi-wavelength photometry fitting using the methods described in Kauffmann et al. (2003), Salim et al. (2007) and Brinchmann et al.
(2004). All values are corrected for Galactic extinction and for the effect of the limited SDSS fiber aperture.
SSFR and SFE Scaling Relation
Two important parameters that describe the star formation in galaxies are the specific star formation rate (SSFR) and the star formation efficiency (SFE).
The specific SFR is defined as the SFR per unit stellar mass (e.g., Bauer et al., 2005). It represents the ratio between the ongoing star formation (SFR) and the accumulated star formation (M*).
SSFR=SFR/M*
The efficiency of star formation, SFE, is defined as the fraction of available gas converted into stars (e.g., Leroy et al., 2008). The SFE is expressed in many different forms, including the ratio between the gas- depletion timescale and the free-fall time (Krumholz and McKee, 2005) and the ratio between the gas mass and the star formation rate (Schiminovich et al., 2010). Here, I choose the latter to define the SFE.
SFE=SFR/Mgas
For the gas mass Mgas, I used the mass of neutral hydrogen following the way presented in Schiminovich
1) http://www.mpa-garching.mpg.de/SDSS/DR7/
et al. (2010). Note that both SSFR and SFE are global parameter over an entire galaxy, while the star formation is actually very local process dealing with
individual molecular clouds.
Fig. 1 shows how the two parameters- the SSFR and the SFE change as a function of stellar mass. In Fig. 1(a), it is apparent that the SSFR decreases as the stellar mass increases. The overplotted dot-dashed line indicates the star-forming main sequence of local (z<0.1) galaxies (SFR∝M0.77) from Elbaz et al.
(2007). The long-dashed line indicates constant SFR of 1 M⊙ yr−1. Galaxies with SSFR less than 10−11 yr−1 are systems with a negligible or very marginal ongoing star formation. Excluding such galaxies, the ALFALFA-SDSS matched galaxies show SSFR scaling relation close to that of star-forming main sequence galaxies.
While the SSFR scaling relation indicates that the low-mass galaxies are vigorously forming stars, Fig.
1(b) shows that low-mass galaxies have lower SFEs than massive galaxies. The SFE increases as the stellar mass increases at stellar mass range over 107-1010 M⊙
(see the dashed line for the best-fit linear relation between the SFE and the stellar mass). Due to the large scatter of ~0.5 dex, the Spearman’s correlation coefficient is 0.56, implying that the correlation between the two is relatively weak.
Above M*~1010 M⊙, Schiminovich et al. (2010) suggested that the SFE remains to be constant with a value of 10−9.5 yr−1 based on ~190 local (z<0.05) galaxies with ultraviolet (UV) and HI detection. The SFE of 10−9.5 yr−1 at 1010 M⊙ is slightly larger than the SFE value from ALFALFA-SDSS galaxies with the similar stellar mass (Fig. 1b). This is likely due to the possible bias towards strong starbursts in the Schiminovich et al. (2010) sample, since their sample selection is based on the UV-bright galaxies. Yet the depth of the HI data as well as the sample redshift range from the Schiminovich et al. (2010) sample is comparable with that of ALFALFA-SDSS matched galaxies used in this work. Thus there could be a critical mass limit (of ~1010 M⊙) that governs the variation in SFE of the star-forming galaxies. The comparison between the stellar mass and the gas mass (inset panel of Fig. 1b) also shows that the gas-to- stellar mass ratio changes as a function of stellar Fig. 1. (a) Specific star formation rate (SSFR), i.e., the SFR
divided by the stellar mass, as a function of stellar mass.
Filled circles are 272 ALFALFA-SDSS matched galaxies, squares are binned-averaged points from Schiminovich et al.
(2010). Dot-dashed line indicates the main sequence of local star-forming galaxies (Elbaz et al., 2007). (b) Star formation efficiency (SFE), i.e., the SFR divided by the HI gas mass, as a function of stellar mass. Filled circles are ALFALFA- SDSS matched galaxies, and squares are binned-average points from Schiminovich et al. (2010). Overplotted dashed line is the best-fit linear relation between the ∆log SFR/MHI
and the log M*. The discrepancy between this line and each data point is defined as ∆log SFR/MHI. The inset plot shows the comparison between the gas mass and the stellar mass.
mass. Especially at M*>1010 M⊙, the gas-to-stellar mass ratio decreases.
The stellar mass of 1010 M⊙ roughly corresponds to the halo mass of Mhalo~1012M⊙ considering the widely accepted baryonic fraction of dark matter halo (e.g., Crain et al., 2007). Such halo mass range is consistent with the range where the cold gas accretion gets shock heated (e.g., Dekel and Birnboim, 2006). Below that range, the increase of the SFE as a function of stellar mass might be a mere reflection of the general Kennicutt-Schmidt law (Schmidt, 1959; Kennicutt, 1998) where the SFR surface density is proportional to the power of a gas density (ΣSFR/Σαgas) with a power larger than 1. The SFE of ALFALFA-SDSS galaxies are well described with the general K-S law, although some low-mass galaxies with high SFE exist at M~
108 M⊙.
SFE Enhancement
In order to quantify the SFE enhancement, I used the offset of the SFE from the overall SFE-M* scaling relation (dashed line in Fig. 1b). The offset, ∆log SFR/MHI, is defined as the discrepancy between the expected log SFR/MHI value and the observed log SFR/MHI value. I investigated the variation of this offset in terms of Hα equivalent width and galaxy morphology.
H α Equivalent Width
Since the equivalent width (EW) is the ratio between the emission line and the stellar continuum, Hα EW has been generally considered to be a tracer for SSFR. The Hα emission line flux reflects the instantaneous star formation and the stellar continuum at the given wavelength represents the integrated stellar mass. The Hα EW is also affected by the initial mass function, metallicity, and the star formation history of a galaxy. Recent studies showed that a majority of star-forming galaxies have a large Hα EW at z>4 (Shim et al., 2011) and the mean Hα EW evolves with redshift (∝(1+z)1.8; Fumagalli et al.,
2012), suggesting that the Hα EW is definitely useful to diagnose the evolution of star formation as a function of redshift. Things expected from the large Hα EW of high-redshift star-forming galaxies is the enhanced SFR and thus enhanced specific SFR, which is even close to that of submm galaxies at z>2 (e.g, Daddi et al., 2009; Coppin et al., 2009). Would this Fig. 2. (a) Hα equivalent width and the deviation from the log SFR/MHI -log M* relation (dashed line in Fig. 1b). ∆log SFR/MHI shows how far the object is from the dashed line, thus ∆log SFR/MHI is large where the star formation effi- ciency is enhanced. The points show a positive correlation with a Spearman’s correlation coefficient 0.63. (b) HI gas fraction (MHI/M*) and the deviation from the log SFR/MHI - logM* relation. The Spearman’s correlation coefficient is 0.24, showing that there is little correlation between the two factors.
large SSFR of high-redshift star-forming galaxies be due to the large amount of embedded gas compared to the stellar mass or due to the highly efficient star formation yielding large SFR? If the stellar mass of a galaxy is fixed, it appears that galaxies with large Hα EW show the elevated SFE (Fig. 2). The SFE enhancement ∆log SFR/MHI and the Hα EW is positively correlated with a Spearman’s correlation coefficient of 0.63. The enhancement of the SFE is not due to the increase of the neutral gas fraction (MHI/M*), while the Spearman’s correlation coefficient is 0.24 for log MHI/M* and ∆log SFR/MHI. The correlation coefficient between the Hα EW and logMHI/M* is 0.43, thus I conclude that the large SSFR is primarily due to the large SFR, not due to the high neutral gas fraction. Physical processes to produce cold, dense giant molecular clouds are critical to result in the large SFR and SSFR observed in early
starburst galaxies.
Morphology
Galaxy interactions and mergers are in general considered to cause pressure-enhanced interstellar medium environment that allows the elevated SFR (e.g., Bournaud, 2010). The global SFE of the interacting galaxies has been found to be a factor of
~4 times larger than that of the isolated galaxies (Young et al., 1996) while the different morphological types among the spiral disks do not affect the SFE.
IR-luminous galaxies, most of which are mergers, are found to have higher SFE than normal galaxies (e.g., Gracia-Carpio et al., 2008; Combes et al., 2011). The increase of dense gas during the merging process is considered to be the main reason for the increase of global SFE.
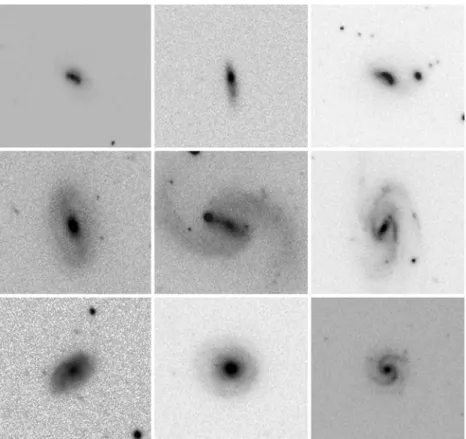
Fig. 3. Examples of the SDSS i-band image for galaxies in each morphological category. The top row shows galaxies classi- fied as merger/interacting systems, the middle row galaxies classified as barred spiral, and the bottom row galaxies classified as normal spiral. The size of each image is 70"×70".
Using the ALFALFA-SDSS matched galaxies, I investigated the SFE as a function of galaxy morphology. For simplicity, I classified the galaxies into i) merger/interacting systems, ii) barred spiral, and iii) normal spiral. The detailed morphological study is limited due to the resolution of SDSS images, thus I only used a clear cases representing mergers and barred spirals. Galaxies showing a clear tidal feature, multiple nuclei, or apparently interacting neighbor are classified as merger/interacting systems. The existence of an elongated bar was critical to classify each galaxy as barred spiral. Edge-on galaxies and distinctively small (half-light radius <2") galaxies are excluded. As a result, the sample consists of 35 mergers and 22 bar galaxies. The remaining galaxies are mostly disk spirals. The SDSS i-band stamp images of the representative mergers, barred spiral, and the normal spiral are given in Fig. 3.
Fig. 4 shows the distribution of the SFE offset from the best-fit for different morphological types of galaxies. When compared to the entire ALFALFA- SDSS matched galaxies (bottom panel of the Fig. 4),
mergers have the average SFE ~0.3 dex higher, corresponding to a factor of ~2. Barred spiral galaxies show the SFE consistent with that of normal spirals.
According to the Kolmogorov-Smirnov test, the SFE offset of the barred spirals and that of the entire galaxies are consistent at a probability level of ~80%.
On the other hand, the possibility that the mergers share the same SFE offset distribution as the entire galaxies is less than 0.1%. It is clear that galaxy- galaxy merging or interaction increases the global SFE. On the other hand, although galactic bar works as a channel of gas inflow thus may increase star formation in the center of a galaxy, the existence of bar seems not to raise the global SFE.
SFR-M
HIRelation
I have constructed a SFR-MHI relation to scale the neutral gas mass obtained from blind HI surveys into the SFRs. Based on the Fig. 5, I derived the conversion formula as follows assuming typical error of ~0.3 dex in the SFR and HI mass. The rms dispersion of the points from the linear fit is ~0.3.
Fig. 5. The relation between the star formation rate and the HI gas mass. The solid line is the best-fit linear relation, log SFR (M⊙ yr−1) = 1.1×log MHI (M⊙) -11.3. The dotted lines indicate the rms dispersion of the observed points from the fit. This relation applies for a wide MHI range, 108 M⊙
<MHI< 1011 M⊙. Fig. 4. Distribution of ∆log SFR/MHI for objects with differ-
ent morphologies. The bottom, middle, and top panels show
∆SFE distribution of all 272 objects, 22 objects with bars, and 35 objects that are apparent mergers, respectively.
log SFR (M⊙ yr−1)
=(1.1±0.3)×log MHI (M⊙)–(11.3±0.03) This formula is valid for a MHI range of 109-1010.5 M⊙. Local SFR density for a given survey volume can be calculated using the wide area HI survey (e.g., HIPASS, ALFALFA) based on this relation.
Summary
I explored SFR scaling relation using 272 local star- forming galaxies with HI measurement from the ALFALFA survey. The ratio between the SFR and the HI gas mass, SFR/MHI, was defined as global (galaxy-averaged) efficiency for star formation. I found that while specific SFR decreases as the stellar mass increases, the SFE increases as the stellar mass increases. The high SFE in massive galaxies was naturally expected from the K-S law for star formation rate density and gas density. Combining our result with previous works on more massive galaxies (M*>
1010 M⊙), the SFE increases below M*~1010 M⊙ and seems to be constant over the critical mass. This is a reflection of critical halo mass for shock heating during cold gas accretion. Hα EW is clearly correlated with the SFE enhancement, while the HI gas fraction compared to stars is not a main cause of SFE enhancement. Merging systems show a factor of ~2 enhanced SFE, confirming that galaxy-galaxy interactions, resulting in high pressure interstellar medium environment, are important for SFE enhancement.
Despite the considerable scatter, HI gas mass can be converted to SFR based on a simple linear relation.
References
Arnouts, S., et al., 2005, The GALEX VIMOS-VLT deep survey measurement of the evolution of the 1500Å luminosity function. The astrophysical journal letter, 619, 43-46, doi:10.1086/426733.
Baldwin, J.A., Phillips, M.M., and Terlevich, R., 1981, Classification parameters for the emission-line spectra of extragalactic objects. Publications of the astronomical society of the pacific. 93, 5-19, doi: 10.1086/130766.
Bauer, A., Drory, N., Hill, G.J., and Feulner, G., 2005,
Specific star formation rates to redshift 1.5. The astrophysical journal letter, 621, 89-92, doi:10.1086/
429289.
Bournaud, F., 2010, Star formation and structure formation in galaxy interactions and mergers. In Smith, B. et al.
(eds.), Proceedings of a conference held 19-22 July 2009 at east Tennessee state university. Astronomical society of the pacific, San Francisco, 2010, p.177.
Bouwens, R. J., Illingworth, G.D., Blakeslee, J.P., and Franx, M., 2006, Galaxies at z~6: the UV luminosity function and luminosity density from 506 HUDF, HUDF parallel ACS field, and GOODS i-dropouts. The astrophysical journal, 653, 53-85, doi:10.1086/498733.
Bouwens, R.J., Illingworth, G.D., Franx, M., and Ford, H., 2007, UV luminosity functions at z~4, 5, and 6 from the Hubble ultra deep field and other deep Hubble space telescope ACS fields: evolution and star formation history. The astrophysical journal, 670, 928- 958, doi:10.1086/521811.
Brinchmann, J., et al. 2004, The physical properties of star- forming galaxies in the low-redshift universe. Monthly notices of the royal astronomical society, 351, 1151-179, doi:10.1111/j.1365-2966.2004.07881.x.
Clark, P. C., Bonnell, I.A., and Klessen, R.S., 2008, The star formation efficiency and its relation to variations in the initial mass function. Monthly notices of the royal astronomical society, 386, 3-10, doi:10.1111/j.1365- 2966.2008.13005.x.
Combes, F., et al., 2011, Galaxy evolution and star formation efficiency at 0.2<z<0.6. Astronomy &
Astrophysics, 528, 124, doi:10.1051/0004-6361/201015739.
Coppin, K.E.K., et al., 2009, A submillimetre galaxy at z=4.76 in the LABOCA survey of the extended Chandra deep field- south. Monthly notices of the royal astronomical society, 395, 1905-1914, doi:10.1111/
j.1365-2966.2009.14700.x.
Crain, R.A., et al., 2007, The baryon fraction of ËCDM haloes. Monthly notices of the royal astronomical society, 377, 41-49, doi: 10.1111/j.1365-2966.2007.11598.x.
Daddi, E., et al., 2009, Two bright submillimeter galaxies in a z=4.05 protocluster in GOODS-north, and accurate radio-infrared photometric redshifts. The astrophysical journal, 2009, 694, 1517-1538, doi:10.1088/0004-637X/
694/2/1517.
Dekel, A. and Birnboim, Y., 2006, Galaxy bimodality due to cold flows and shock heating. Monthly notices of the royal astronomical society, 368, 2-20, doi:10.1111/
j.1365-2966.2006.10145.x.
Elbaz, D., et al., 2007, The reversal of the star formation- density relation in the distant universe. Astronomy &
Astrophysics, 468, 33-48, doi:10.1051/0004-6361:20077525.
Fumagalli, M., et al., 2012, Hα equivalent widths from the 3d-HST survey: evolution with redshift and dependence
on stellar mass. The astrophysical journal letters, 757, 22, doi:10.1088/2041-8205/757/2/L22.
Genzel, R., et al., 2010, A study of the gas-star formation relation over cosmic time. Monthly notices of the royal astronomical Society, 407, 2091-2108, doi:10.1111/
j.1365-2966.2010.16969.x.
Giovanelli, R., et al., 2005, The Arecibo legacy fast ALFA survey. I. science goals, survey design, and strategy.
The astronomical journal, 130, 2598-2612, doi:10.1086/
497431.
Gracia-Carpio, J., Garcia-Burillo, S., Planesas, P., Fuente, A., and Usero, A., 2008, Evidence of enhanced star formation efficiency in luminous and ultraluminous infrared galaxies. Astronomy & Astrophysics, 479, 703- 717, doi:10.1051/0004-6361:20078223.
Haynes, M.P., et al., 2011, The Arecibo legacy fast ALFA survey: the α.40 HI source catalogs, its characteristics and their impact on the derivation of the HI mass function. The astronomical journal,
142, 170, doi:10.1088/0004-6256/142/5/170.
Kauffmann, G., et al., 2003, Stellar masses and star formation histories for 105 galaxies from the Sloan digital sky survey. Monthly notices of the royal astronomical society, 341, 33-53, doi:10.1046/j.1365- 8711.2003.06291.x.
Kennicutt, R.C.Jr., 1998, The global Schmidt law in star- forming galaxies. The astrophysical journal, 498, 541, doi:10.1086/305588.
Krumholz, M.R. and McKee, C.F., 2005, A general theory of turbulence-regulated star formation, from spirals to ultraluminous infrared galaxies. The astrophysical
journal, 630, 250-268, doi:10.1086/431734.
Leroy, A.K., et al., 2008, The star formation efficiency in nearby galaxies: measuring where gas forms stars effectively. The astronomical journal, 136, 2782-2845, doi:10.1088/0004-6256/136/6/2782.
McKee, C.F. and Ostriker, E.C., 2007, Theory of star formation. Annual review of astronomy & astrophysics, 45, 565-687, doi:10.1146/annurev.astro.45.051806.110602.
Salim, S., et al., 2007, UV star formation rates in the local universe. The astrophysical journal supplement series, 173, 267-292, doi:10.1086/519218.
Schiminovich, D., et al., 2010, The GALEX Arecibo SDSS survey-II. the star formation efficiency of massive galaxies. Monthly notices of the royal astronomical society, 408, 919-934, doi:10.1111/j.1365-2966.2010.
17210.x.
Schmidt, M., 1959, The rate of star formation. The astrophysical journal, 129, 243, doi:10.1086/146614.
Shim, H., et al., 2011, z~4 Hα emitters in the great observatories origins deep survey: tracing the dominant mode for growth of galaxies. The astrophysical journal, 738, 69, doi:10.1088/0004-637X/738/1/69.
Steidel, C.C., et al., 1999, Lyman-break galaxies at z > 4 and the evolution of the ultraviolet luminosity density at high redshift. The astrophysical journal, 519, 1-17, doi:10.1086/307363.
Young, J.S., Allen, L., Kenney, J.D.P., Lesser, A., and Rownd, B., 1996, The global rate and efficiency of star formation in spiral galaxies as a function of morphology and environment. The astronomical journal, 112, 1903, doi:10.1086/118152.
Manuscript received: July 13, 2013 Revised manuscript received: August 19, 2013 Manuscript accepted: August 30, 2013