ISSN 1225-1534 (Print) http://dx.doi.org/10.5303/PKAS.2012.27.4.331 Publications of the Korean Astronomical Society
27: 331 ∼ 334, 2012 September
° 2012. The Korean Astronomical Society. All Rights Reserved. c
ENVIRONMENTAL DEPENDENCE OF STAR FORMATION AND GALAXY
TRANSFORMATION IN MERGING GALAXY CLUSTER ABELL 2255: AKARI’S POINT OF VIEW
Hyunjin Shim
Department of Earth Science Education, Kyungpook National University, Daegu 702-701, Korea E-mail: [email protected]
(Received July 01, 2012; Accepted July 23, 2012)
ABSTRACT
We investigate the role of galaxy environment in the evolution of individual galaxies through the AKARI observations of the merging galaxy cluster A2255. MIR diagnostics using N 3 − S11 colors are adopted to select star-forming galaxies and galaxies in transition between star-forming galaxies and quiescent galaxies. We do not find particular enhancement of star formation rates as a function of galaxy environment, reflected in cluster-centric distance and local surface density of galaxies.
Instead, the locations of intermediate MIR-excess galaxies (−1.2 < N 3 − S11 < 0.2) show that star-forming galaxies are transformed into passive galaxies in the substructures of A2255, where the local surface density of galaxies is relatively high.
Key words: galaxies: clusters: individual (A2255); galaxies: photometry; infrared: galaxies
1. INTRODUCTION
Abell 2255 is a well-studied rich cluster at z ∼ 0.08 which consists of a few hundreds member galaxies.
From the X-ray observations showing elongated tem- perature gradient (Davis & White, 1998), the cluster is considered to be at the stages of late merger. In gen- eral as a representative of high-density environments, galaxy clusters are thought to show less star formation than the field (e.g., Poggianti et al., 2009) due to the mechanisms that quench star formation including ram- pressure stripping, tidal forces, and galaxy harassment.
However it is still under debate whether these mecha- nisms react differently when cluster-scale merging is in- corporated (Hwang & Lee, 2009): cluster-cluster merg- ing can enhance or quench the star formation by driv- ing external potential (Bekki, 1999), or by depriving gas (Fujita et al., 1999), respectively.
Mid-infrared (MIR) observations reveal how much star formation is actually hidden by dust (Bai et al., 2009) and work as good probe for young quiescent galaxies being sensitive of circumstellar dust emission
around AGB stars (Ko et al., 2009). In this study, we investigate the role of local environment in the evolu- tion of individual member galaxies in the cluster A2255.
2. DATA
The MIR photometry data over A2255 were obtained through CLEVL (CLusters of galaxies EVoLution stud- ies) program, one of the AKARI mission programs (Im et al., 2008). We observed ∼ 1, 200 arcmin
2of A2255 using IRC02 Astronomical Observation Tem- plates, with the filter composition of [N3, N4, S7, S11, L15, and L24]. The on-source exposure time for each filter is roughly ∼ 140 seconds.
The images are reduced using the IRC pipeline ver- sion 070104 (Y. Ita, T. Wada et al., 2007
1; provided in the form of an IRAF external package). After the reduction, the MIR fluxes in each filter are measured using SExtractor (Bertin & Arnouts, 1996). The flux limit in each filter is 25, 30, 65, 80, 150, and 400 µJy
1 http://www.ir.isas.jaxa.jp/ASTRO-F/Observation/Data- Reduction/IRC/software/irc20070104.tgz.
http://pkas.kas.org 331
332 SHIM
-2 -1 0 1 2
N3-S7 -3
-2 -1 0 1 2 3
N3-S11 1 Gyr2 Gyr
10 Gyr
1 Gyr 2 Gyr
10 Gyr
elliptical w/o AGB effect (Piovan+03) Z=0.004 elliptical (Piovan+03) Z=0.008 elliptical (Piovan+03) Z=0.02 (ZΟ •) elliptical (Piovan+03) Local star-forming galaxies (CE01)
weak intermediate strong
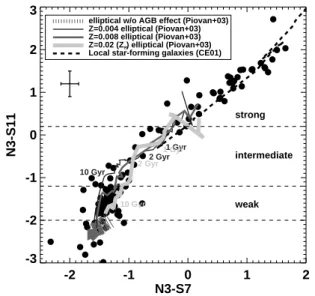
Fig. 1. (N 3 − S11) vs. (N 3 − S7) color-color plot of A2255 member galaxies. Overplotted are colors expected from local star-forming galaxies (dashed line; Chary &
Elbaz, 2001), elliptical galaxies with circumstellar dust emission around AGB stars (solid lines; Piovan et al., 2003), and elliptical galaxies without AGB dust emission considered (thick dotted line). The error bar indicates typical magnitude errors.
at 3, 4, 7, 11, 15, and 24 µm respectively.
In order to identify member galaxies in A2255, we used the spectroscopic redshifts from the SDSS Data Release 2 (SDSS DR2; Abazajian et al., 2004) and the BATC photometric redshifts from Yuan et al. (2003) The redshift cut for member galaxies is 0.068 < z <
0.090, and the median redshift is hzi = 0.081. Over the
∼ 1, 200 arcmin
2, we identified 122 galaxies which are spectroscopically confirmed to be within the redshift cut. In addition to that, 170 galaxies with the corre- sponding photometric redshifts are identified, thus the total number of member galaxies used is 292.
3. MIR DIAGNOSTICS
While the cluster member galaxies show a tight red sequence in their optical and near-infrared color- magnitude diagram which is defined by elliptical galax- ies with similar age and/or metallicity, the sequence is not well-defined in the MIR color-magnitude diagram due to the large scatter in MIR colors reflecting stellar population age and dust emission (e.g., Ko et al., 2009).
Figure 1 shows MIR color-color diagram for galaxies in
A2255.
Most galaxies have N 3 − S11 colors redder than
−2.0, expected from a pure stellar continuum of pas- sive elliptical galaxies without any concern for dust emission from AGB stars (thick dotted line in Fig- ure 1). These ‘MIR-excess’ galaxies can be divided into three classes according to the strength of the MIR color excess, reflected in N 3 − S11 colors: strong MIR- excess (N 3 − S11 > 0.2), weak MIR-excess (−2.0 <
N 3 − S11 < −1.2), and intermediate MIR-excess in between the two.
Strong MIR-excess galaxies have N 3−S11 and N 3−
S7 colors consistent with those of local star-forming galaxies (dashed line; Chary & Elbaz, 2001). Interme- diate MIR-excess galaxies, −1.2 < N 3 − S11 < 0.2, are considered to be passive galaxies with relatively young stellar population (less than few Gyrs) and/or recent star formation activity. In this work, we used these MIR diagnostics to study the role of cluster environ- ment to star formation and/or evolution of member galaxies.
4. ENVIRONMENTAL DEPENDENCE
A2255 has a number of substructures that can affect the evolution of individual member galaxies in addition to the asymmetric velocity distribution reflecting the com- plicated kinematics within the cluster. As gauge of the local environment, we used the cluster-centric distance and the local surface density of galaxies. The local sur- face density of galaxies is expressed as Σ
5th, the density of galaxies (with either spectroscopic or photometric redshifts) within a circle whose radius is the distance to the 5th-nearest galaxy in comoving scale. If a galaxy cluster is dynamically relaxed, the local surface density of galaxies would monotonically decrease as the cluster- centric distance increases: however, there exists several Σ
5thexcess peak compared to the simple 2D-projected NFW profile thus we defined these as substructures of A2255.
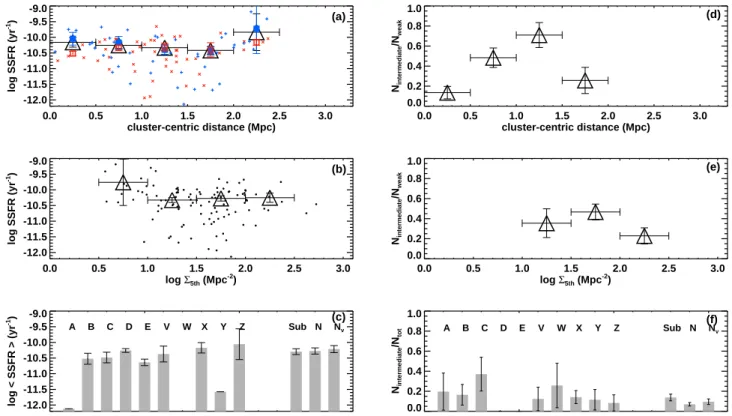
In Figures 2 a, b, and c, we showed the average spe-
cific star formation rates (SFRs) distribution as a func-
tion of local environment. The star formation rate is
calculated from the total IR luminosity derived through
SED fitting. There is no strong trend of increase or de-
crease of specific SFR with the cluster-centric distance,
except that the specific SFR of galaxies at the out-
ermost of A2255 increases. This specific SFR at the
outermost bin reflects newly infalling galaxies into the
MERGING GALAXY CLUSTER ABELL 2255 333
0.0 0.5 1.0 1.5 2.0 2.5 3.0
cluster-centric distance (Mpc) -12.0
-11.5 -11.0 -10.5 -10.0 -9.5 -9.0
log SSFR (yr-1) (a)
0.0 0.5 1.0 1.5 2.0 2.5 3.0
log Σ5th (Mpc-2) -12.0
-11.5 -11.0 -10.5 -10.0 -9.5 -9.0
log SSFR (yr-1) (b)
-12.0 -11.5 -11.0 -10.5 -10.0 -9.5 -9.0
log < SSFR > (yr-1) (c)
A B C D E V W X Y Z Sub N Nv
0.0 0.5 1.0 1.5 2.0 2.5 3.0
cluster-centric distance (Mpc) 0.0
0.2 0.4 0.6 0.8 1.0
Nintermediate/Nweak
(d)
0.0 0.5 1.0 1.5 2.0 2.5 3.0
log Σ5th (Mpc-2) 0.0
0.2 0.4 0.6 0.8 1.0
Nintermediate/Nweak
(e)
0.0 0.2 0.4 0.6 0.8 1.0
Nintermediate/Ntot
A B C D E V W X Y Z Sub N (f)Nv
Fig. 2. Environmental dependence of the specific star formation rate (a, b, and c) and the fraction of intermediate MIR-excess galaxies (d, e, and f). (a) Crosses indicate specific star formation rates (SSFR) of individual galaxies, blue from galaxies at z < 0.08 (blue velocity peak) and red from galaxies at z > 0.08 (red velocity peak). Triangles with error bars indicate average SSFR in each cluster-centric distance bin. Blue filled squares and red open squares are average SSFR in each cluster-centric distance bin, calculated using galaxies at z < 0.08 and z > 0.08 respectively. (b) Dots are SSFR of individual galaxies, triangles average SSFR in each local galaxy surface density bin. (c) Average SSFR of galaxies in substructures A-Z of A2255. Additionally compared are ‘Sub’ (indicating average SSFR of galaxies in all substructures) and ‘N
v’ (indicating average SSFR of galaxies with velocities at extreme blue/red end of velocity distribution (z < 0.075 or z > 0.085)), in addition to the result from all (‘N’) galaxies. (d) Ratio between the number of intermediate MIR-excess galaxies to number of weak MIR-excess galaxies as a function of cluster centric distance. (e) Same as (d), but as a function of local surface density of galaxies. (f) Fraction of intermediate MIR-excess galaxies, i.e., number of intermediate MIR-excess galaxies divided by number of total galaxies measured for substructures. Error bars in all panels are derived through bootstrapping.
cluster. If we divide galaxies using velocities (blue and red), galaxies at the blue velocity peak tend to have higher specific SFR than galaxies at the red velocity peak especially near the central region of the cluster.
While specific SFR does not show a significant corre- lation with local galaxy surface density where a galaxy resides, it is more likely that galaxy kinematics are re- lated to the amount of specific SFR at least in the re- gion close to the cluster center.
On the other hand, the increase of the ratio between the number of intermediate MIR-excess galaxies and
the number of weak MIR-excess galaxies as a func- tion of cluster-centric distance is clearer (Figure 2 (d)).
The fraction of intermediate MIR-excess galaxies gets
slightly higher in some substructures (C, W) still de-
spite large scatter. Therefore the transition from star-
forming galaxies to passive galaxies seems to occur in
the substructures with high local galaxy density.
334 SHIM
0.0 0.5 1.0 1.5 2.0 2.5 3.0
cluster-centric distance (Mpc) 0.0
0.2 0.4 0.6 0.8 1.0
N/Ntotal
weak MIR-excess intermediate strong
0.0 0.5 1.0 1.5 2.0 2.5 3.0
log Σ
5th(Mpc
-2) 0.0
0.2 0.4 0.6 0.8 1.0
N/Ntotal