ISSN 1225-1534 (Print) http://dx.doi.org/10.5303/PKAS.2012.27.4.317 Publications of the Korean Astronomical Society
27: 317 ∼ 320, 2012 September
° 2012. The Korean Astronomical Society. All Rights Reserved. c
AKARI-SDSS-GALEX SURVEYS: SPECTRAL ENERGY DISTRIBUTIONS OF NEARBY GALAXIES
V. Buat 1 , F. -T. Yuan 2 , T. T. Takeuchi 2 , E. Giovannoli 1 , and S. Heinis 1
1 Laboratoire d’Astrophysique de Marseille - LAM, Universit´e Aix-Marseille & CNRS, UMR7326, 38 rue F.
Joliot-Curie, 13388 Marseille Cedex 13, France
2 Division of Particle and Astrophysical Sciences, Nagoya University, Furo-cho, Chikusa-ku, Nagoya 464-8602, Japan
E-mail: [email protected]
(Received May 25, 2012; Accepted Jun 30, 2012)
ABSTRACT
A sample of nearby galaxies was built from the AKARI/FIS all sky survey cross-correlated with the SDSS and GALEX surveys. The spectral energy distributions from 0.15 to 160 microns of these galaxies are analysed to study dust attenuation and star formation properties. The calibrations of the amount of dust attenuation as a function of the IR-to-UV flux ratio and the FUV-NUV colour are re-investigated: the former one is confirmed to be robust and accurate whereas the use of the FUV-NUV colour to measure dust attenuation is found highly uncertain. The current star formation rate given by the SED fitting process is compared to that directly obtained from the UV and total IR luminosities. It leads to an accurate estimate of dust heating by old stars. We emphasize the importance of such a sample as a reference for IR selected star forming galaxies in the nearby universe
Key words: infrared: galaxies; ultraviolet: galaxies; dust: extinction
1. INTRODUCTION
The nearby universe remains the best laboratory to understand the physical properties of galaxies and is a reference for any comparison with high redshift ob- servations. The all sky (or very large) surveys that have been performed from the ultraviolet (UV) to the far-infrared (far-IR) provide us with large datasets and very large wavelength coverage to perform a reference study. The broad-band spectral energy distribution (SED) of a galaxy represents the combination of the emission from both stars of all ages and interstellar dust that interact in a complex way by means of the absorption and scattering of the stellar light by dust grains. The stars emit from the UV to the near-IR whereas the mid and far-IR emission comes from inter- stellar dust heated by the stellar emission. By compar- ing data with models, one can attempt to derive some physical parameters related to the star formation his-
tory and dust attenuation in a homogeneous way and simultaneously for all galaxies of a given sample. With the availability of mid and far-IR data for large samples of galaxies, we can combine stellar and dust emission to analyse SEDs and deduce accurate star formation rates (SFRs).
We investigate the properties of nearby galaxies by se- lecting a sample of objects that is as large as possible, observed as part of the AKARI, SDSS, and GALEX surveys. It corresponds to 13 photometric bands from 0.15 to 160 µm. Particular care is taken to measure total flux densities for the extended sources. Our aim is to perform SED fitting to deduce physical properties in a homogeneous and consistent way, focusing on dust attenuation and SFR measurements. The analysis and results presented here are published in Takeuchi et al.
(2010), Buat et al. (2011) and Yuan et al. (2011).
http://pkas.kas.org 317
318 BUAT ET AL.
0.0 0.5 1.0 1.5 2.0 2.5 3.0 3.5 4.0 4.5 5.0
-0.5 0.0 0.5 1.0 1.5 2.0 2.5
!"#$%
&'(%
)*+,- .
)*+-$ / 0# ,-
Fig. 1. A
FUVplotted as a function of L
IR/L
FUV, the result of the polynomial regression being plotted as a red thick solid line. Models from Meurer et al. (1999, black thin solid line), Buat et al. (2005, blue dotted line), and Cortese et al. (2008) with τ = 6.2 Gyr (green dashed line) are overplotted. Standard errors in A
FUVare plotted for 1/4 of the objects.
2. DATA
Takeuchi et al. (2010) cross-matched the first primary catalogue of the AKARI/FIS All Sky Survey (β-1 ver- sion) with the IRAS/PSCz to select 776 sources con- firmed as galaxies, with a known redshift and observed with GALEX. For 607 of these 776 sources, SDSS/DR7 images are suitable for performing accurate photome- try. Buat et al. (2011) restricted the sample to galax- ies whose 140 µm flux is of high quality, 363 sources fulfilling this condition. Most of selected sources (357 sources) also have high quality fluxes at 90 µm but the fraction of these sources with reliable fluxes at 65 and 160 µm is about ∼ 1/3. Yuan et al. (2011) anal- ysed the sub-sample of 153 galaxies matched with the AKARI/IRC PSC.
2.1. Dust Attenuation
An efficient way to derive physical parameters of star formation and dust attenuation homogeneously is to fit the observed SED with models from a stellar popula- tion synthesis code. We use the code CIGALE (Code Investigating GALaxy Emission) 1 , which derives phys- ical information about galaxies by fitting their UV-to- far-IR SED with a full conservation of the energy bud- get (Noll et al., 2009; Giovannoli et al., 2011).
1
http://www.oamp.fr/cigale.
Dust attenuation in UV (A FUV ) is found to be tightly related to the ratio of IR to UV luminosity, log(L IR /L FUV ). Applying a polynomial regression on our data yields (Fig. 1):
A FUV = 0.483 + 0.812 y + 0.373 y 2 + 0.299 y 3 − 0.106 y 4 where y = log(L IR /L FUV ).
We also compare the values of A FUV obtained from our SED fitting method with the F U V −N U V colour from GALEX.
The values are reported in Fig. 2 and exhibit a fairly weak correlation (correlation coefficient R = 0.59), a linear regression indicating that:
A FUV = 2.39 (±0.20) × (F U V − N U V ) + 0.89 (±0.13) with σ = 0.83. Several authors proposed a relation be- tween A FUV and F U V − N U V . Meurer et al. (1999) obtained a linear relation between the slope of the UV continuum β and A F U V for starburst galaxies, Seibert et al. (2005) found that the starburst relation overesti- mates A FUV by ∼ 0.5 mag for a sample of galaxies not necessarily starbursting. These relations are reported in Fig. 2. We find that the relation proposed by Seibert et al. (2005) matches our results more closely than that of Meurer et al. (1999) but, in most cases, it overesti- mates the dust attenuation for a given F U V − N U V colour. Salim et al. (2007) derived a shallower relation by fitting UV-optical data only (without IR data) for normal blue galaxies. Their relation is also reported in Fig. 2 and appears consistent with our own regres- sion. In all cases the dispersion in the data leads to a standard deviation around the regression line of 0.8 mag. The large dispersion and the shallower relation than that found for starburst galaxies is explained by an attenuation curve only slightly steeper than that for starbursts (Calzetti et al., 2000) and variations of the star formation history. Note that the steepness of the relation between F U V −N U V and A FUV make the derivation of a dust attenuation from the F U V −N U V color quite uncertain.
2.2. Star Formation Calibrations
Yuan et al. (2011) derived SFR calibrations using the
S9W and L18W bands of the AKARI/ Infrared Cam-
era (IRC). SFRs are obtained by fitting the whole SEDs
with CIGALE and then are compared to the observed
luminosities in the S9W and L18W bands. Tight re-
lations are found as shown in Fig. 3 and 4. Linear
AKARI-SDSS-GALEX SURVEYS 319
!"#$%"#&
'
!"#&( ) *+ ,&
0.0 0.5 1.0 1.5 2.0 2.5 3.0 3.5 4.0 4.5 5.0 5.5
0.0 0.2 0.4 0.6 0.8 1.0 1.2 1.4 1.6 1.8 2.0
Fig. 2. A
FUVplotted against F U V − N U V . The linear regression is plotted as a dashed black line. Galaxies with L
IR> 10
11L
¯are plotted as empty red circles. Relations from previous studies are overplotted: Salim et al. (2007, green dot-dashed line), Seibert et al. (2005, blue dotted line), and Meurer et al. (1999, black solid line). Standard errors in A
FUVare plotted for 1/4 of the objects.
Fig. 3. Star formation rates from SED fitting plotted against the luminosity at 9 µm. The dashed line is the result of the regression. AGNs are plotted with triangles.
regressions give:
log(SF R M
¯yr
−1) = 0.99 log(L 9,L
¯) − 9.02 and
log(SF R M
¯yr
−1) = 0.90 log(L 18,L
¯) − 8.03
Fig. 4. Same as Fig. 6 with the luminosity at 18 µm.
The dispersion around the regression line is 0.2 dex.
When both UV and IR fluxes are measured, a very ef- ficient way to estimate SFR is to add the contributions of both types of emission to the total SFR. One must also account for dust heating by old stars, which is not directly related to the current star formation and given by
SFR tot = (1 − η)SFR IR + SFR FUV ,
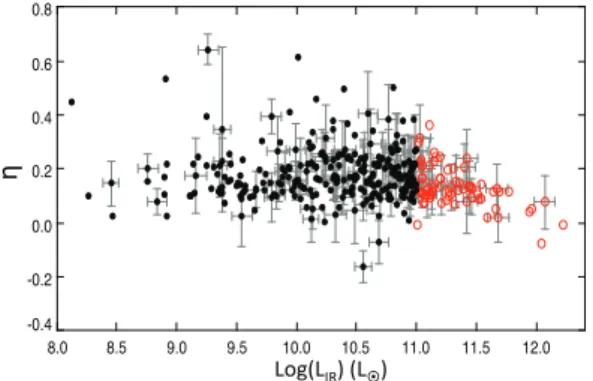
where η represents the fraction of IR emission due to dust heating by old stars, SFR IR being calculated by converting the total IR luminosity L IR into SFR as- suming that all the light from stars is absorbed by dust and SFR FUV is calculated from the observed UV lumi- nosity L FUV . The relation between the IR and FUV luminosities and the corresponding SFRs are derived for a constant SFR over 10 8 years (the typical dura- tion of the UV emission to reach a steady state) and a Kroupa initial mass function (Buat et al., 2008). In Fig. 5, we report the variation in η as a function of L IR for our sample. < η >= 0.17 ± 0.10 for the whole sample. A weak trend is found as a function of L IR
with < η >= 0.14 ± 0.08 for L IR > 10 11 L ¯ (26 galax- ies). Adopting η = 0.17 leads to a very good agreement between SFR tot and the SFR estimated by CIGALE.
This agreement implies that the timescales over which both SFRs are calculated are similar.
The value of η we find here is lower than that found by Hirashita et al. (2003) (η = 0.4). Bell (2003) estimated the mean contribution of old stellar populations to L IR
to be 32% ± 16% for L IR < 10 11 L ¯ and 9% ± 5% for
320 BUAT ET AL.
!"#$!
%&'($!
!'(
)(
-0.4 -0.2 0.0 0.2 0.4 0.6 0.8
8.0 8.5 9.0 9.5 10.0 10.5 11.0 11.5 12.0