° 2012. The Korean Astronomical Society. All Rights Reserved. c
OBSERVATIONS OF STAR FORMATION INDUCED BY GALAXY-GALAXY AND GALAXY-INTERGALACTIC MEDIUM INTERACTIONS WITH AKARI
T. Suzuki 1 , H. Kaneda 2 , and T. Onaka 3
1 Institute of Space and Astronautical Science, Japan Aerospace Exploration Agency, Sagamihara-shi, Kanagawa 252–5210, Japan
2 Graduate School of Science, Nagoya University, Chikusa-ku, Nagoya 464–8602, Japan
3 Department of Astronomy, Graduate School of Science, The University of Tokyo, 7-3-1 Bunkyo-ku, Tokyo 113-0033, Japan E-mail: [email protected]
(Received June 30, 2012; Accepted august 22, 2012)
ABSTRACT
Nearby spiral galaxies M101 and M81 are considered to have undergone a galaxy-galaxy in- teraction. M101 has experienced HI gas infall due to the interaction. With AKARI far-infrared (IR) photometric observations, we found regions with enhanced star forming activity, which are spatially close to regions affected by the interaction. In addition, the relation between the star for- mation rate (SFR) and the gas content for such regions shows a significant difference from typical spiral arm regions. We discuss possible explanations for star formation processes on a kiloparsec scale and the association with interaction-triggered star formation. We also observed the compact group of galaxies Stephan’s Quintet (SQ) with the AKARI Far-infrared Surveyor (FIS). The SQ shows diffuse intergalactic medium (IGM) due to multiple collisions between the member galaxies and the IGM. The intruder galaxy NGC 7318b is currently colliding with the IGM and causes a large-scale shock. The 160 micron image clearly shows the structure along the shock ridge as seen in warm molecular hydrogen line emission and X-ray emission. The far-IR emission from the shocked region comes from the luminous [CII]158 µm line and cold dust (∼ 20 K) that coexist with molecular hydrogen gas. Survival of dust grains is indispensable to form molecular hydrogen gas within the collision age (∼ 5 Myr). At the stage of the dusty IGM environment, [CII] and H 2 lines rather than X-ray emission are powerful cooling channels to release the collision energy.
Key words: infrared: galaxies; galaxies: individual (M101, M81, HCG92); galaxies: interactions;
stars: formation
1. INTRODUCTION
The evolution of galaxies is influenced by dynamical in- teractions with other galaxies and with the surrounding intergalactic medium (IGM). Galaxy collisions can in- duce not only the luminosity and chemical evolution of galaxies but also the chemical enrichment of the IGM.
The inflow of the IGM into a galaxy also impacts on their evolution. Among various processes, in partic- ular, star formation induced by these events is a key component. However, the underlying star formation mechanism is not yet clear. Also, it is an open ques-
tion how the kinetic energy of collisions is released to form molecular gas and provide a reservoir of fuel for star formation.
Mid- to far-infrared (IR) observations can provide useful information for these studies. In these wave- bands, there are gas cooling lines such as H 2 rotational lines, the [OI]63 µm line, and the [CII]158 µm line.
Dust emission from spiral galaxies shows warm (∼ 60 K) and cold (∼ 20 K) dust components in general, which can be related to the star formation rate (SFR) of massive stars and gas content, respectively (de Jong
http://pkas.kas.org 243
14h02m30s 14h03m00s 14h03m30s 14h04m00s 54:16 54:20 54:24 54:28
R.A. (J2000.0) DEC. (J2000.0)
(a) M101: Cold dust
14h02m30s 14h03m00s 14h03m30s 14h04m00s 54:16 54:20 54:24 54:28
R.A. (J2000.0) DEC. (J2000.0)
(b) M101: Warm dust
9h53m 9h54m 9h55m 9h56m 9h57m 9h58m 68:54 69:00 69:06 69:12
R.A. (J2000.0) DEC. (J2000.0)
(c) M81: Cold dust (c) M81: Cold dust
9h53m 9h54m 9h55m 9h56m 9h57m 9h58m 68:54 69:00 69:06 69:12
R.A. (J2000.0) DEC. (J2000.0)
(d) M81: Warm dust
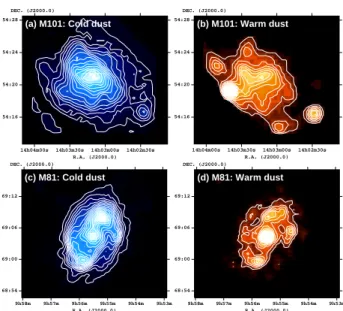
Fig. 1. Spatial distributions of the cold (blue) and warm (red) dust components for M101 (upper panels) and M81 (bottom panels). The contours are linearly spaced from 7%
to 98% of the peak with a step of 7%. The peak luminosities for M101 and M81 are 3.1 × 10
8L
¯kpc
−2(cold dust), 3.6 × 10
8L
¯kpc
−2(warm dust) and 8.5 × 10
7L
¯kpc
−2(cold dust), 1.0 × 10
8L
¯kpc
−2(warm dust), respectively.
et al., 1984; Cox & Mazger, 1989). The fine allocation of the AKARI/Far-Infrared Surveyor (FIS) four bands can provide spectral information that allows the decom- position of the two dust components. In this paper, we report the observations of interacting/post-interacting galaxies with AKARI/FIS.
2. STAR FORMATION INDUCED BY GALAXY- GALAXY INTERACTIONS
2.1. Post-Interacting Spiral Galaxies: M101 and M81 M101 and M81 are face-on spiral galaxies with global spiral patterns. In M101, there are four giant HII re- gions (NGC 5447, 5455, 5461, and 5462) on the out- skirts of the galaxy, whose star-formation activities are the highest in the galaxy (Suzuki et al., 2007). What triggers the four active giant HII regions is a subject of controversy. As one possibility, it is suggested that in- tergalactic HI gas might have fallen into the outer disk near NGC 5461 and 5462 (Van der Hulst & Sancisi, 1988) as a result of a past encounter of M101 with its companion dwarf galaxy NGC 5477.
M81 has also experienced tidal interaction with M82.
The two galaxies are connected by a stream of HI gas.
M101 M81
Fig. 2. Field positions in the disks of M101 (left) and M81 (right). The positions of four giant HII regions and contiguous regions are indicated with red circles. Blue cir- cles indicate regions within the spiral arms. The circle’s radii are set to 1.0 kpc and 1.2 kpc for M81 and M101, respectively.
Cottrell (1977) investigated the HI velocity field in the region surrounding M81 and M82, concluding that the gas in M82 might be the HI gas captured from the outer parts of M81 during the encounter; the stream of HI gas is in the direction from M81 toward M82. No evidence of the infall of HI gas onto M81 is suggested.
M101 and M81 were observed with AKARI/FIS as part of the FIS calibration program on 2006 June 14 and 2007 April 19, respectively. The FIS was operated in a photometry mode with the four bands: N60 (65 µm), WIDE-S (90 µm), WIDE-L (140 µm), and N160 (160 µm). Details of the observations and data reduc- tions are described in Suzuki et al. (2007, 2010).
2.2. RESULTS
2.2.1. Spatial Distributions of Cold and Warm Dust Components
By using the four-band images, Suzuki et al. (2007,
2010) spectrally decomposed cold and warm dust com-
ponents of M101 and M81 as shown in Fig. 1. To obtain
the spatial distributions of cold and warm dust com-
ponents, the spatial resolutions of the original WIDE-
S and N60 images are reduced to match those of the
WIDE-L and N160 images by convolving the former
images with a Gaussian kernel. Individual spectral en-
ergy distributions (SEDs), constructed from the four-
band fluxes at each image bin are fitted with a two-
temperature graybody model with an emissivity index
of unity, in which only the amplitudes of the black-
bodies are set to be free. The temperatures of cold and
warm dust components are fixed at the values obtained
from the SEDs of the whole galaxies. Four-band flux
densities for the whole galaxies are in good agreement
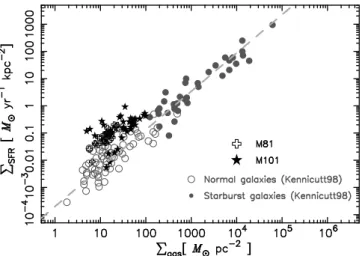
Fig. 3. Relation between gas surface density Σ
gasand SFR surface density Σ
SFRin the disks of M101 (stars) and M81 (open crosses). The open and filled circles are infrared- luminous starburst galaxies and normal spiral galaxies from the sample of Kennicutt (1998), respectively. The dashed line shows the power-law model with the index of 1.4.
with those obtained from Spitzer and Herschel obser- vations (Gordon et al., 2008; Bendo et al., 2010; Suzuki et al., 2007, 2010).
Fig. 1 shows that the cold dust component is smoothly distributed over the galaxies, while the warm dust component indicates a correlation with star forma- tion regions. In particular, for M101, four bright spots seen in the warm dust component spatially correspond to four giant HII regions.
2.2.2. Relation between SFR and Gas Content On the basis of the cold and warm dust luminosities in Fig. 1, SFR and gas content for fields within a galactic disk can be estimated by using the following equations (Suzuki et al., 2010);
M gas (r, θ) = GDR(r)M C (r, θ) (1) and
SFR(r, θ) = 5.6 × 10 −42 10 (logL
W(r,θ)−0.60)/1.04 , (2) where M gas , GDR, M C , and L W are the H 2 gas mass, the azimuthally averaged gas-to-dust mass ratio, the cold dust mass, and the warm dust luminosity in polar coordinates, respectively. The relation between SFR and gas surface densities is investigated at various fields as shown in Fig. 2. For M101, the spiral arm regions in- dicated by the blue circles are defined as the locations
at the spiral arms within 5 arcmin from the galactic center. The positions of the red circles spatially corre- spond to four giant HII regions.
Fig. 3 shows the relation between SFR and gas sur- face densities within the disks of M101 (stars) and M81 (open crosses) is overplotted on the relation for individ- ual galaxy samples from Kennicutt (1998). Despite the difference in the spatial scale, the local relationship for the fields within the disks follows a similar trend as the global relationship for individual galaxies: Kennicutt- Schmidt (K - S) law, Σ SFR ∝ Σ N gas (N = 1.4). However, once we focus on the local relationship by regions, the power-law index N varies from 1 to 2 as clearly shown in Fig. 4; the power-law index of the K-S law is not always constant within a galaxy.
2.3. Star Formation Process Induced by Interactions The clear spatial difference in N for M101 may be at- tributed to the difference in the star formation process on a kiloparsec scale. Van der Hulst & Sancisi (1988) discovered high-speed (≤ 150 km s −1 ) HI gas falling into the outskirts of the galaxy. The infall may have resulted from the interaction. Santillan et al. (1991) numerically simulated the interaction of high-velocity clouds (200 km s −1 ) with a magnetized galactic disk.
As the gas falls into the disk, perturbation of the mag- netic field lines can trigger the Parker instability that creates large magnetic loops above the galactic plane.
Then, dense molecular clouds are formed in the gas con- centrated at the foot prints of the loops. Once star for- mation begins by the Parker instability, SFR becomes proportional to the gas density (SFR∝ ρ gas , Elmegreen, 1994). The general feature of the spiral arms in M101 can be explained by the density wave theory (Rogstad, 1971). The orbit crowding in spiral arms enhances the number density of gas clouds and thus increases the cloud-cloud collision rate. Scoville et al. (1986) found that the number density of HII regions varies as ρ 2 gas (SFR∝ ρ 2 gas ). Thus, with the assumption that the scale height of the disk is constant, the power-law index of unity derived for giant HII regions may be attributed to star formation induced by the Parker instability trig- gered by the interaction.
Although star formation activities in normal spiral galaxies can be considered to be the highest near the galactic center, star formation activities are surpris- ingly high in the outskirts of M101 (Suzuki et al., 2007).
Therefore, galaxy-galaxy interactions can dramatically
Fig. 4. Σ
gas–Σ
SFRrelations for various regions in M101.
Filled circles and boxes show spiral arm regions and the giant HII regions, respectively. The lines and N are the best-fit power-law models and the resulting power-law in- dex, respectively.
change star formation activities in a galaxy.
3. STAR FORMATION INDUCED BY GALAXY- IGM COLLISION
A compact group of galaxies shows an extreme high density of galaxies that corresponds to the number den- sity at the core region of rich clusters. Compact groups show the chemical enrichment in the IGM by stripping of metal-enriched gas contained in member galaxies.
Thus, compact groups in the local universe are unique laboratories to study the effect of the IGM enrichment and to serve as an analogue to the cores of clusters in the early universe.
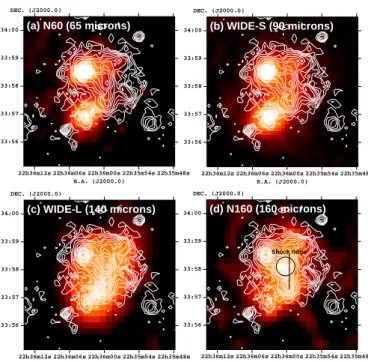
3.1. Compact Group of Galaxies: Stephan’s Quintet Stephan’s Quintet (SQ, HCG92) is a well studied com- pact group of galaxies with the disturbed IGM. The intruder galaxy NGC 7318b is currently colliding with the IGM at a relative velocity of ∼ 1, 000 km s −1 and causes a large-scale shock front and IGM starbursts (SQ-A and SQ-B). In the shocked region, X-ray emis- sion from shock-heated gas (∼ 6 × 10 6 K) was detected (e.g. O’Sullivan et al., 2009). Appleton et al. (2006) found powerful H 2 rotational line emission from warm (∼ 10 2 –10 3 K) molecular gas in the center of the shock ridge. Cluver et al. (2010) showed that the spatial distributions of H 2 lines were in good agreement with that of X-ray emission. To explain the coexistence of
22h35m48s 22h35m54s 22h36m00s 22h36m06s 22h36m12s 33:56 33:57 33:58 33:59 34:00
R.A. (J2000.0) DEC. (J2000.0)
(a) N60 (65 microns)
22h35m48s 22h35m54s 22h36m00s 22h36m06s 22h36m12s 33:56 33:57 33:58 33:59 34:00
R.A. (J2000.0) DEC. (J2000.0)
(b) WIDE-S (90 microns)
22h35m48s 22h35m54s 22h36m00s 22h36m06s 22h36m12s 33:56 33:57 33:58 33:59 34:00
R.A. (J2000.0) DEC. (J2000.0)
(c) WIDE-L (140 microns)
22h35m48s 22h35m54s 22h36m00s 22h36m06s 22h36m12s 33:56 33:57 33:58 33:59 34:00
R.A. (J2000.0) DEC. (J2000.0)
(d) N160 (160 microns)
Shock ridge