◈ Original Article ◈
The Lowest Dose for CT Attenuation Correction in PET/CT
Byung Sam Kang1ㆍJin Hyun Son1ㆍHoon Hee Park1ㆍKyung Rae Dong2,3
1Department of Radiological Technology, Shingu University·
2Department of Radiological Technology, Gwangju Health College University·
3Department of Nuclear Engineering, Chosun University
3)
Abstract
PET/CT(Positron Emission Tomography/Computed Tomography) is an examination combining morpholo- gical and functional information in one examination. The purpose of this study is to see the lowest CT dose for attenuation correction in the PET/CT maintaining good image quality when considering CT scan dose to the patients. We injected 18F-FDG and water into the cylinder shaped phantom, and obtained emission images for 3 mins and transmission images(140 kVp, 8 sec, 10~200 mA for transmission images), and reconstructed the images to PET/CT images with Iterative method. Data(Maximum, Minimum, Average, Standard Deviation) were obtained by drawing a circular ROI(Region Of Interest) on each sphere in each image set with Image J program. And then described SD according to the CT and PEC/CT images as graphes. Through the graphes, we got the relationships of mA and quality of images.
SDs according to CT graph were 16.25 at 10 mA, 7.26 at 50 mA, 5.5 at 100 mA, 4.29 at 150 mA, and 3.83 at 200 mA, i.e. the higer mA, the better image quality was presented. SDs according to PET/CT graph were 1823.2 at 10 mA, 1825.1 at 50 mA, 1828.4 at 100 mA, 1813.8 at 150 mA, and 1811.3 at 200 mA. Calculated SDs at PET/CT images were maintained. This means images quality is maintained having nothing to do with mA of high and low.
Key Words : PET/CT, Attenuation correction, Cylinder shaped phantom, Transmission images
Ⅰ. Introduction
PET(Positron Emission Tomography) study is the cutting edge study which can estimate glucose metabolism in the body using 18F-FDG. In contrast existing image methods(MRI or CT) can
Received June 08, 2011/ 1st Revised June 19, 2011/ 2nd Revised July 13, 2011/ Accepted for Publication August 02, 2011 Corresponding Author: Kyung Rae Dong
Department of Radiological Technology, Gwangju Health College University
(506-701) 683, Shinchang-dong, Gwangsan-gu, Gwangju, Republic of Korea
Tel: 062) 958-7668 Fax: 062) 958-7669 E-mail: [email protected]
diagnose organs and cancer through their molpholoy, PET study diagnoses and estimates them through the amount of metabolism, i.e.
activity rate.1~2 Accordingly, even the smallest cancer if it is high malignancy can be detected accurately. And the number of PET study has been tending to increase rapidly of late years in the United States, Japan, etc, because it was verified that PET is very effective on early diagnosis of cancer, knowing relapse whether or not, and remedial value conclusion could be everywhere of the body by imaging the whole body.3~7 There are pros and cons of PET. It is that PET makes biological examination possible
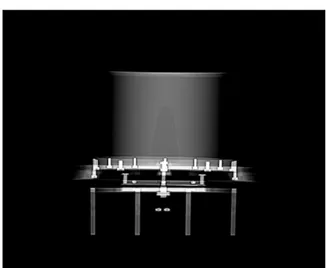
Fig. 1. Cylinderical Phantom Fig. 2. Scout view of CT (Scan time : 3 min) which can find the spot of lesion and see
functions of organs, while it is hard to reveal the clear anthropotomy though the PET.8~9 But this defect came to be made up for by fusing CT into PET. Among the reconstruction methods of PET/CT system, we used attenuation correction method. Recently, PET/CT systems use the CT scan for attenuation correction instead of a radioactive source(68Ge and 137Cs) as is used in stand-alone PET systems. Through using CT, the scan time can be reduced a lot. On the other hand, the need to reduce CT scan dose to the patients has grown considerably since the introduction of multi slice CT scanner. We studied the optimum conditions maintaining the image quality and reducing the patients scan dose.
Ⅱ. Material & Method
1. Materials
This phantom was designed to reflect the human tissue(Fig. 1).
2. Methods
1) Scanning protocols
All studies were done with GE DSTe PET-CT systems. 18F-FDG 2.03 mCi(Back ground : 0.3 mCi) was injected into the cylindrical phantom.
We mixed 18F-FDG with water equally for 30 min.
and fixed cylinderical phantom to the table. At first, the emission image was acquired a period of 3 min and then transmission images were acquired on the increase in tube current ranging from 10 to 200 mA(beginning point 10 mA, an image per 10 mA). Transmission images are to make attenuation correction map. The scanning time and tube voltage are fixed 8 sec and 140 kVp. Each image was reconstructed with Iterative method used clinically. Attenuation correction method is used for reconstruction in the PET/
CT(Fig. 2).
2) Deriving data and getting SD(Standard Deviation) from the data
A circular ROI(Region of Interest) was drawn on each sphere in each image set with Image J program and SDs were computed. SDs were determined according to the following equation 1.
(1) We drew the SDs graphes of CT images and reconstructed images and saw the correlation between SD and dose.Ⅲ. Result
1. The results of CT images
Table 1 is the calculated data by drawing ROI on each CT image. ROI scales are all the same.
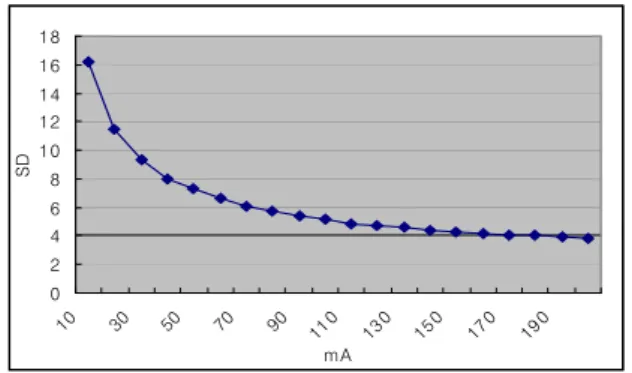
The SDs according to the CT graph were 16.25 at 10 mA, 7.26 at 50mA, 5.5 at 100 mA, 4.29 at 150 mA, and 3.83 at 200 mA. With these Figures 3 graph was drawn. The results showed that the higer mA was, the better quality of images was and the lower mA was, the worse quality of images was.
mA Area Mean SD Min Max
10 29830.90 8.21 16.25 -63 77 20 29663.06 2.35 11.46 -52 49 30 29214.83 2.32 9.31 -38 47 40 29214.83 2.19 8.04 -37 36 50 29214.83 2.15 7.26 -34 32 60 29214.83 2.27 6.62 -29 29 70 28928.73 2.27 6.10 -26 32 80 28942.08 2.16 5.72 -26 26 90 28942.08 2.13 5.41 -25 27 100 28942.08 2.12 5.15 -20 23 110 29500.93 2.32 4.86 -21 25 120 29365.51 1.84 4.70 -23 21 130 29110.88 1.84 4.57 -21 24 140 29110.88 1.88 4.44 -20 19 150 29079.41 1.78 4.29 -19 18 160 29110.88 1.78 4.18 -17 24 170 28942.08 1.78 4.10 -19 19 180 29110.88 1.96 4.02 -17 18 190 29214.83 1.97 3.91 -14 17 200 29079.41 1.995 3.83 -19 16 Table 1. Data of CT images
0 2 4 6 8 10 12 14 16 18
10 30 50 70 90 110
130 150 170 190 mA
SD
Fig. 3. Graph of CT Images' SDs
2. The results of PET/CT images
Table 2 is the calculated data by drawing ROI on each PET/CT image. ROI scales are all the same.
mA Area Mean SD Min Max
10 25750.1 24721.2 1823.7 15209 32767 20 25750.1 24707.2 1822.8 15173 32767 30 24882.8 24718.8 1812.8 15205 32767 40 26378.2 24711.1 1802.8 15186 32766 50 24284.7 24699.2 1825.1 15135 32767 60 24882.8 24708.5 1815.0 15114 32766 70 24284.7 24710.9 1827.4 15141 32766 80 25750.1 24705.0 1826.3 15117 32767 90 24882.8 24685.9 1839.6 15114 32767 100 24882.8 24718.4 1828.4 15131 32767 110 25750.1 24712.0 1825.2 15146 32767 120 24284.7 24706.6 1823.4 15121 32767 130 24882.8 24676.8 1835.8 15174 32767 140 26378.2 24717.4 1803.5 15172 32767 150 24882.8 24748.0 1813.8 15189 32767 160 24284.7 24709.5 1821.9 15154 32767 170 24284.7 24708.7 1823.1 15166 32767 180 25750.1 24719.9 1820.9 15221 32766 190 24882.8 24730.3 1814.0 15257 32767 200 24882.8 24739.5 1811.3 15193 32767 Table 2. Data of PET Images.
The SDs according to the PET/CT graph were 1823.7 at 10 mA, 1828.8 at 100 mA, 1811.3 at 200 mA. With these Figures 4 graph was drawn. The results showed that Calculated SDs at PET/CT images had little changes(Fig. 5).
1000 1200 1400 1600 1800 2000
10 30 50 70 90 110 130
150 170
190 mA
SD
Fig. 4. Graph of PET images' SDs
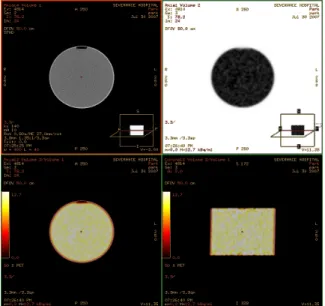
Fig. 5. CT Image, PET Image and fusion Image The results demonstrated that there is a close
relationship between CT image and scanning dose and that there is little relationship between the PET/CT image and the dose.
Ⅳ. Discussion and Conclusion
The interest of the PET/CT has been arising in compliance with the development of medical technique. Because PET/CT has a big advantage;
functional and morphological information can be
hand there has been a problem about the patient scanning dose.10~11 So this study was implemented.
The purpose of this study is to grope the lowest CT scanning dose considering image quality. 68Ge and 137Cs were used to utilize for attenuation correction at the beginning in the PET, however we experimented with 18F-FDG, which is used mostly nowadays for CT dose estimation. Scanning dose is due to the tube current. Each manu- facturer propses 40~50 mA as a optimum dose(at 140 kVp). But above study's results show that the CT images' SDs curve falls quickly on the increase in mA(Table 1, 2) but, relatively, little changes can be seen in the SDs graph of PET/CT images(Fig. 4). It means that mA cannot affect the PET/CT images, in other words, low mA has little effect on the image quality of reconstruc- tions derived from the images obtained at the setting. Therefore PET/CT images can be obtained by using the lowest mA value to examin lesions and, at the same time, can preserve the image quality. Although a decrease in mA results in a reduction in radiation dose, it is also associated with an increase in image noise and streak artifacts which may affect the diagnostic result of the study. However, such artifacts in PET images can be easily distinguished from metabolically active disease. The lowest dose CT has the advantage of the short scanning time and provides adequate image information. Moreover, the patient scan dose can be reduced
References
1. Turkington TG, Williams JJ, Wilson JW, Colsher JG, McDaniel DL, Kim CL, et al.
Performance of a BGO PET/CT with Higher Resolution PET Detectors. IEEE 2005; 23:
1891-4.
2. Zhu X, Yu J, Huang Z. Low-Dose Chest CT:
Optimizing Radation Protection for Patients.
Am J Roentgenol 2004; 183: 809-16.
3. Li J, Hsieh J, Colsher J, Stearns C, Lonn A.
Towards Single Ultra-Low Dose CT Scan for Both Attenuation Map Creation and Localiza- tion in PET-CT Application. IEEE 2004; 16:
2396-8,
4. Gregory R, Partridge M, Flower MA. Perfor- mance Evaluation of the Philips 'Gemini' PET/CT System. IEEE 2004; 16: 2605-9.
5. Shin GS, Dong KR. The Difference of Stan- dardized Uptake Value on PET-CT According to Change of CT Parameters. Journal of the Korean Society of Radiology 2007; 30: 373-9.
6. Wu TH, Chu TC, Huang YH, Chen LK, Mok SP, Lee JK, et al. A positron emission tomography /computed tomography (PET/CT) acquisition protocol for CT radiation dose optimization.
Nucl Med Commun 2005; 26: 323-30.
7. Nam SR, Son HK, Lee SH, Lee CL, Cho HM, Kim HJ. Effective Dose Evaluation using Clinical PET/CT Acquisition Protocols. Korean Journal of Medical Physics 2006; 17: 173-8.
8. Brix G, Lechel U, Glatting G, Ziegler SI, Munzing W, Muller SP. Radiation Exposure of Patients Undergoing Whole Body Dual Moda- lity 18F-FDG PET/CT Examinations. The Journal of Nuclear Medicine 2005; 46: 608-13.
9. Brix G, Lechel U, Veit R, Truckenbrodt R, Stamm R, Coppenrath EM, et al. Assessment of a theoretical formalism for dose estimation in CT; an anthropomorphic phantom study.
Eur Radiol 2004; 14: 1275-84.
10 Deloar HM, Fujiwara T, Shidahara M, Nakamura T, Watabe H, Narita Y, et al.
Estimation of absorbed dose for 18F-FDG whole body positron emission tomography and magnetic resonance imaging. Eur J Nucl Med 1998; 25: 565-74.
11. Park HH, Roh DW, Kim SY, Dong KR, Lee MH, Kang CG, et al. Usefulness of Dynamic 18F-FDG PET Scan in Lung Cancer and Inflammation disease. Journal of the Korean Society of Radiology 2006; 29: 249-55.