Original Article PET/CT 감쇠보정시 다양한 CT Kernel 적용에 따른 유용성 평가
서울대학교병원 핵의학과
이재영·성용준·윤석환·박찬록·이홍재·노경운
The evaluate the usefulness of various CT kernel applications by PET/CT attenuation correction
Jae-Young Lee, Yong-Jun Seong, Seok-Hwan Yoon, Chan-Rok Park, Hong-Jae Lee and Kyung-Wun Noh
Department of Nuclear Medicine, Seoul National University Hospital, Seoul, Korea
Purpose Recently PET/CT image’s attenuation correction is used CTAC(Computed Tomgraphy Attenuation Correction). it can quantitative evaluation by SUV(Standard Uptake Value). This study’s purpose is to evaluate SUV and to find proper CT kernel using CTAC with applied various CT kernel to PET/CT construction.
Materials and Methods Biograph mCT 64 was used for the equipment. We were performed on 20 patients who had examed at our hospital from february through March 2017. Using NEMA IEC Body Phantom, The data was reconstructed PET/CT images with CTAC appiled various CT kernel. ANOVA was used to evaluated the significant difference in the result.
Results The result of measuring the radioactivity concentration of Phantom was B45F 96% and B80F 6.58% against B08F CT kernel, each respectively. the SUVmax increased to B45F 0.86% and B80F 6.54% against B08F CT kernel, In case of patient's parts data, the Lung SUVmax increased to B45F 1.6% and B80F 6.6%, Liver SUVmax increased to B45F 0.7% and B80F 4.7%, and Bone SUVmax increased to B45F 1.3% and B80F 6.2%, respectively. As for parts of patient's about Standard Deviation(SD), the Lung SD increased to B45F 4.2% and B80F 15.4%, Liver SD increased to B45F 2.1% and B80F 11%, and Bone SD increased to B45F 2.3% and B80F 14.7%, respectively. There was no significant difference discovered in three CT kernel (P >.05).
Conclusion When using increased noise CT kernel for PET/CT reconstruction, It tends to change both SUVmax and SD in ROI(region of interest), Due to the increase the CT kernel number, Sharp noise increased in ROI. so SUVmax and SD were highly measured, but there was no statistically significant difference. Therefore Using CT kernel of low variation of SD occur less variation of SUV
Key Words PET/CT, CT attenuation correction, Standard deviation, SUVmax, CT kernel, 18F-FDG
3)
·Received: September 29, 2017 Accepted: October 20, 2017
·Corresponding Author: Jae-Young Lee
·Address for correspondence : Department of nuclear medicine, Seoul National University Hospital, 28 Yeongondong, Jongno-gu, Seoul, 110-744, Korea
서 론
PET/CT 검사는 기능적 영상과 질환의 형태적 영상을 동 시에 획득하여, 몸 속 조직들의 기능과 생화학적인 대사 상 태를 검사하고 인체 내의 생리적 지표들을 정량적으로 측정 할 수 있어 질병진단, 치료 후 예후 판정, 치료계획 등에 사용 되며 PET 영상을 이용해 측정된 표준섭취계수(Standardized
사용된다.1) 예전 PET장비 영상에서는 감마선의 감쇠 정도 가 체내 위치 따라 컴프턴 산란에 의해 잡음이 유발되므로 검출기 내 효율성의 차이 등을 해결하며 감쇠보정맵을 얻기 위해 외부 감마선원을 이용하여 얻었던 것에 비하여 요즘은 CT 영상으로 대체함으로 스캔시간이 단축 및 정확한 보정 이 가능하게 되었다. PET/CT 영상 재구성시 CT kernel에 따 라 감쇠보정맵이 달라지게 되며 그로 인해서 표준섭취계수 의 오류를 유발시켜 정량적 평가에 영향을 미치게 된다.2-3)
본 논문에서는 다양한 CT kernel 적용으로 인한 감쇠보 정맵의 변화로 인하여 정량적 평가 시 오차를 줄이기 위하 여 적절한 kernel 선택 유무와 PET 영상 재구성시 각 CT kenrel 적용으로 인한 표준 섭취 계수 변화 유무를 평가하고 자 한다.4-5)
실험재료 및 방법 1. 실험 장비 및 대상
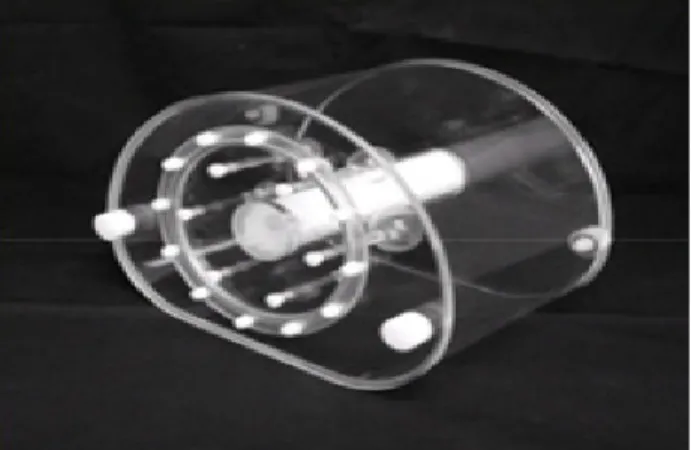
실험장비는 PET/CT Biograph mCT64 (Siemens Medical System, Germany)이며(Fig. 1) 실험을 위해 NEMA IEC Body Phantom을 사용하였고(Fig. 2) 환자는 2017년 2월에 서 3월까지 본원 PET/CT 검사를 시행한 환자 20명을 대상 으로 하였다.
Fig. 1. Siemens Biograph mCT64 PET/CT Scanner was used for acquisition.
Fig. 2. NEMA IEC Bocy Phantom was used for acquistion data.
2. 실험 방법 및 분석
1) Phantom test
Phantom 실험은 BKG(Background)에 27kBq 주입하고, 각각 6개의 Sphere와 비율이 1 : 8이 되도록 제작하였다.
(Fig. 3) 이 팬텀을 이용하여 toroso protocol을 사용하여 bed 당 60초 의 데이터를 획득한 다음 CT kenel parameter (Fig.
4)을 변화시킨 후 획득한 CTAC(CT Attenuation correction) 를 PET영상을 재구성 하였고 mCT 촬영조건을 관전압 (120kVp)와 관전류(80mAs)를 적용하여 1분간 영상을 획득 하였다. 획득된 영상은 True X + TOF(iteration : 2, subset : 21), gaussian filter 5mm에다가 다양한 kernel(B08f AC, B40f medium, B80 ultra sharp)이 적용된 CTAC를 사용하여 PET 영상을 재구성 하였고 획득한 영상은 Syngo.via version VB10A software를 이용하여 SUVmax와 SD를 평가하였고 SPSS version 23을 이용하여 ANOVA 검정을 시행하였다.
Fig. 3. Analysis of NEMA IEC Body phantom of SUVmax and SD.
Fig. 4. Classification of CT kernel parameter and CT μ- map of each of variable CT kernel.
2) Clinical test
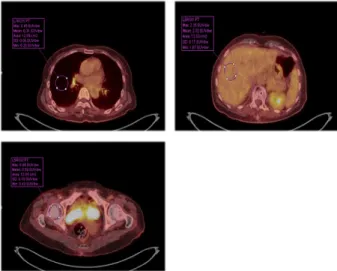
2017년 2월부터 3월까지 본원 PET/CT 검사를 시행한 환 자 20명을 대상으로 임상적 데이터를 획득한 후 재구성 parameter를 변화하여 Lung, Liver, Femur head를 관심영역 으로 잡아 CT kernel별 SUV와 SD를 평가하였다.(Fig. 5)
Fig. 5. Analysis of Patients data of SUVmax and SD.
결 과 1. Phantom test
Phantom의 각각 6개의 Sphere와 BKG 비율이 1: 8이 되도 록 제작한 후(Fig. 6) phantom 방사능 농도 측정결과 B08f는 182.39 kBq/cc, B45f 184.15 kBq/cc, B80f 194.40kBq/cc 이 고(Table 1), SUVmax는 평균 B08f는 8.1, B45f 8.17, B80f 8.63 이며(Table 2), SD는 B08f는 1.58, B45f 1.60, B80f 1.69 나왔다(Table 3). 방사능 농 도 측정결과 B08f AC 대비 B45f 0.96%, B80f 6.58% 증가하였고 SUVmax는 B08f AC 대비 B45f 0.86%, B80f 6.54% 증가하였으며, SD는 B08f AC 대 비 B45f 1.27%, B80f 6.96% 증가하였다(Fig. 7)
Fig. 6. Result image of CTAC of NEMA IEC Body Phantom.
Table 1. Activity of Phantom study
Patient B08f B45f % Difference B80f % Difference 1 202.82 204.66 0.91 215.92 6.46
2 200 202.57 1.29 214.09 7.05
3 214.69 216.39 0.79 228.55 6.46 4 207.35 208.68 0.64 220.15 6.17 5 169.17 170.86 1.00 180.23 6.54 6 100.32 101.72 1.40 107.44 7.10 Average 182.39 184.15 0.96 194.40 6.58
Table 2. SUVmax of Phantom study
Patient B08f B45f % Difference B80f % Difference
1 9 9.08 0.89 9.58 6.44
2 8.91 8.99 0.90 9.5 6.62
3 9.53 9.6 0.73 10.14 6.40
4 9.2 9.26 0.65 9.77 6.20
5 7.51 7.58 0.93 8 6.52
6 4.45 4.51 1.35 4.77 7.19
Average 8.10 4.51 0.86 4.77 6.54
Table 3. SD of Phantom study
Patient B08f B45f % Difference B80f % Difference
1 2.05 2.07 0.98 2.19 6.83
2 1.82 1.84 1.10 1.94 6.59
3 2.09 2.11 0.96 2.22 6.22
4 1.55 1.56 0.65 1.64 5.81
5 1.26 1.28 1.59 1.35 7.14
6 0.73 0.74 1.37 0.79 8.22
Average 1.58 1.60 1.27 1.69 6.96
Fig. 7. Result of Phantom study.
2. Clinical test
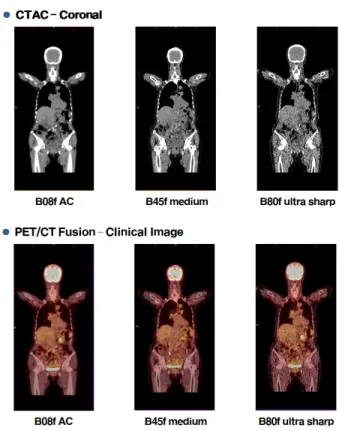
환자 영상의 경우 kernel의 숫자의 증가에 따라 영상의 sharpness 해짐을 알 수 있다. (Fig. 8, 9) 그리고 부위별로 SUVmax는 Lung에서 B08f는 0.61, B45f 0.62, B80f 0.62 이 며(Table 4), Liver에서 B08f는 2.98, B45f 3, B80f 3.12이고 (Table 5), Bone에서 B08f는 0.8, B45f 0.81, B80f 0.85로 나 왔으며(Table 6), 부위별 SD은 Lung 에서B08f는 0.065, B45f 0.069, B80f 0.079이며(Table 7), Liver에서 B08f는 0.237, B45f 0.242, B80f 0.263 이고(Table 8), Bone에서
(Table 9). 환자에서 부위별 SUVmax는 Lung에서 B08f AC 대비 B45f 1.6%, B80f 6.6% 증가를 보였다. Liver에서 B08f AC 대비 B45f 0.7%, B80f 4.7% 증가를 보였다. Bone에서 B08f AC 대비 B45f 를 사용할 때 1.3%, B80f 6.2% 증가를 보였다(Fig 10). 부위별 SD은 Lung에서 B08f AC 대비 B45f 6.2%, B80f 15.4% 증가를 보였다. Liver에서 B08f AC 대비 B45f 2.1%, B80f 11% 증가를 보였다. Bone에서 B08f AC 대비 B45f 를 사용할 때 2.3%, B80f 14.7% 증가를 보였다. (Fig 11)
Fig. 8. The Transverse image of Clinical study
Fig. 9. The Coronal image of Clinical study.
Table 4. SUVmax of region of Lung
Patient B08f B45f % Difference B80f % Difference
1 0.69 0.7 1.45 0.73 5.80
2 0.65 0.66 1.54 0.71 9.23
3 1.13 1.15 1.77 1.2 6.19
4 0.42 0.44 4.76 0.46 9.52
5 0.66 0.67 1.52 0.71 7.58
6 0.57 0.57 0.00 0.6 5.26
7 0.44 0.44 0.00 0.47 6.82
8 0.66 0.67 1.52 0.68 3.03
9 0.97 0.99 2.06 0.99 2.06
10 0.68 0.68 0.00 0.72 5.88
11 0.47 0.48 2.13 0.51 8.51
12 0.42 0.43 2.38 0.46 9.52
13 0.44 0.44 0.00 0.46 4.55
14 0.66 0.67 1.52 0.69 4.55
15 0.5 0.51 2.00 0.53 6.00
16 0.49 0.5 2.04 0.54 10.20
17 0.58 0.59 1.72 0.61 5.17
18 0.61 0.62 1.64 0.65 6.56
19 0.45 0.46 2.22 0.48 6.67
20 0.71 0.72 1.41 0.76 7.04
Average 0.61 0.62 1.56 0.65 6.60
Table 5. SUVmax of region of Liver
Patient B08f B45f % Difference B80f % Difference
1 3.4 3.41 0.29 3.55 4.41
2 2.71 2.72 0.37 2.85 5.17
3 3.61 3.64 0.83 3.8 5.26
4 2.73 2.75 0.73 2.89 5.86
5 2.86 2.89 1.05 3.01 5.24
6 2.89 2.9 0.35 3.04 5.19
7 3.25 3.26 0.31 3.42 5.23
8 2.83 2.84 0.35 2.85 0.71
9 3.37 3.38 0.30 3.42 1.48
10 3.44 3.46 0.58 3.6 4.65
11 2.66 2.68 0.75 2.8 5.26
12 2.29 2.3 0.44 2.41 5.24
13 3.23 3.25 0.62 3.39 4.95
14 3.45 3.48 0.87 3.56 3.19
15 3.06 3.08 0.65 3.21 4.90
16 2.86 2.87 0.35 3 4.90
17 3.05 3.07 0.66 3.24 6.23
18 2.63 2.65 0.76 2.76 4.94
19 2.33 2.35 0.86 2.46 5.58
20 2.9 2.94 1.38 3.1 6.90
Table 6. SUVmax of region of Bone
Patient B08f B45f % Difference B80f % Difference
1 0.86 0.88 2.33 0.91 5.81
2 0.71 0.72 1.41 0.75 5.63
3 1.21 1.23 1.65 1.3 7.44
4 0.49 0.5 2.04 0.53 8.16
5 1.09 1.1 0.92 1.18 8.26
6 0.49 0.5 2.04 0.53 8.16
7 1.14 1.15 0.88 1.19 4.39
8 0.91 0.9 -1.10 0.93 2.20
9 0.54 0.54 0.00 0.56 3.70
10 1.09 1.1 0.92 1.16 6.42
11 0.66 0.68 3.03 0.71 7.58
12 0.71 0.72 1.41 0.75 5.63
13 0.64 0.65 1.56 0.68 6.25
14 1.2 1.22 1.67 1.23 2.50
15 0.54 0.54 0.00 0.57 5.56
16 0.57 0.58 1.75 0.61 7.02
17 1.05 1.05 0.00 1.12 6.67
18 0.53 0.54 1.89 0.57 7.55
19 0.72 0.72 0.00 0.76 5.56
20 0.85 0.86 1.18 0.91 7.06
Average 0.80 0.81 1.3 0.85 6.2
Table 7. SD of region of Lung
Patient B08f B45f % Difference B80f % Difference
1 0.07 0.07 0.00 0.07 0.00
2 0.07 0.07 0.00 0.07 0.00
3 0.11 0.11 0.00 0.11 0.00
4 0.05 0.05 0.00 0.05 0.00
5 0.08 0.08 0.00 0.09 12.50
6 0.07 0.07 0.00 0.09 28.57
7 0.04 0.05 25.00 0.07 75.00
8 0.07 0.07 0.00 0.07 0.00
9 0.1 0.1 0.00 0.12 20.00
10 0.07 0.07 0.00 0.09 28.57
11 0.06 0.07 16.67 0.07 16.67
12 0.04 0.05 25.00 0.05 25.00
13 0.05 0.06 20.00 0.08 60.00
14 0.07 0.07 0.00 0.08 14.29
15 0.04 0.05 25.00 0.07 75.00
16 0.04 0.05 25.00 0.06 50.00
17 0.05 0.06 20.00 0.06 20.00
18 0.07 0.08 14.29 0.09 28.57
19 0.05 0.05 0.00 0.07 40.00
20 0.1 0.1 0.00 0.11 10.00
Average 0.07 0.07 6.15 0.08 20.77
Patient B08f B45f % Difference B80f % Difference
1 0.15 0.15 0.00 0.17 13.33
2 0.12 0.12 0.00 0.13 8.33
3 0.18 0.19 5.56 0.21 16.67
4 0.07 0.07 0.00 0.09 28.57
5 0.35 0.35 0.00 0.38 8.57
6 0.04 0.05 25.00 0.07 75.00
7 0.17 0.17 0.00 0.19 11.76
8 0.12 0.12 0.00 0.14 16.67
9 0.08 0.08 0.00 0.09 12.50
10 0.19 0.2 5.26 0.23 21.05
11 0.12 0.12 0.00 0.14 16.67
12 0.11 0.11 0.00 0.12 9.09
13 0.09 0.1 11.11 0.12 33.33
14 0.18 0.19 5.56 0.19 5.56
15 0.06 0.06 0.00 0.08 33.33
16 0.08 0.08 0.00 0.09 12.50
17 0.18 0.18 0.00 0.19 5.56
18 0.09 0.09 0.00 0.11 22.22
19 0.08 0.08 0.00 0.08 0.00
20 0.12 0.13 8.33 0.14 16.67
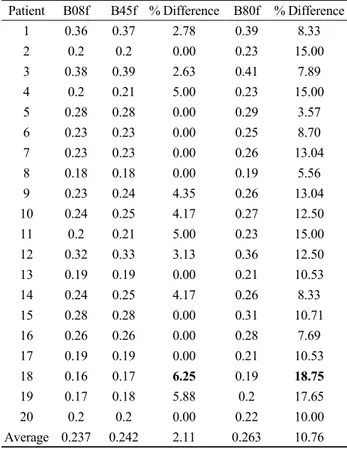
Average 0.129 0.132 2.33 0.148 14.73 Table 8. SD of region of Liver
Patient B08f B45f % Difference B80f % Difference
1 0.36 0.37 2.78 0.39 8.33
2 0.2 0.2 0.00 0.23 15.00
3 0.38 0.39 2.63 0.41 7.89
4 0.2 0.21 5.00 0.23 15.00
5 0.28 0.28 0.00 0.29 3.57
6 0.23 0.23 0.00 0.25 8.70
7 0.23 0.23 0.00 0.26 13.04
8 0.18 0.18 0.00 0.19 5.56
9 0.23 0.24 4.35 0.26 13.04
10 0.24 0.25 4.17 0.27 12.50
11 0.2 0.21 5.00 0.23 15.00
12 0.32 0.33 3.13 0.36 12.50
13 0.19 0.19 0.00 0.21 10.53
14 0.24 0.25 4.17 0.26 8.33
15 0.28 0.28 0.00 0.31 10.71
16 0.26 0.26 0.00 0.28 7.69
17 0.19 0.19 0.00 0.21 10.53
18 0.16 0.17 6.25 0.19 18.75
19 0.17 0.18 5.88 0.2 17.65
20 0.2 0.2 0.00 0.22 10.00
Average 0.237 0.242 2.11 0.263 10.76
Table 9. SD of region of Bone
Fig. 10. SUVmax result of Phantom study
Fig. 11. SD result of Phantom study
고 찰
PET/CT 영상에서 감쇠 보정을 위한 parameter가 다양하 고 회사별 장비가 다양하므로 SUVmax의 편차가 있을 수 있 다. PET/CT는 영상의 질도 중요하지만 그보다 더 중요한 것 으로 사료되는 것이 정량적 평가이므로 재구성시 적절한 감 쇠보정 맵을 사용하는 것이 중요하다. 본 연구에서는 재구성 parameter를 CT kernel 종류에만 국한하여 SUVmax값에 대 하여 평가한 것이므로 조금 더 많은 parameter를 가지고 연 구가 필요하다고 사료가 된다. 하지만 요즘은 CT를 가지고 감쇠보정 맵을 만들고 있고 CT는 부위별로 kernel을 다르게 적용한다는 것에 착안 하여 핵의학 영상 재구성에 적용 했다 는 것에 의의가 있다. 따라서 noise level이 증가된 감쇠보정 맵을 사용하는 것보다 부위에 따라 적절한 kernel과 noise level이 낮은 kernel이 사용된 감쇠보정맵을 사용하는 것이 정량적 평가가 좀 더 정확 해지는 것으로 보이며 다양한 parameter를 고려한 연구가 필요하다고 사료된다.
결 론
PET/CT 재구성시 잡음이 증가된 CT kernel을 사용 할 경 우 관심영역에서의 SUV와 SD가 변화를 보인다. CT kernel 숫자의 증감에 따라 Sharpness Noise가 증감되어 부위별 관 심영역에서 SUV와 SD가 높게 측정되었지만 SUV는 통계 적으로 유의미한 차이가 없었다(p>0.05). 따라서 CTAC를 이용하여 PET/CT 재구성시에 SD의 편차가 낮은 숫자의 CT kernel을 사용하는 것이 SUV의 변화가 적으므로 B08f AC CT kernel을 사용하는 것이 바람직하다고 사료된다.
요 약
PET/CT 영상 재구성시 감쇠보정맵을 사용하여 영상재구 성에 적용한다. 감쇠보정 맵의 CT parameter을 변경하여 PET/CT 영상 재구성 할 때 적용하여 SUVmax에 어떤 영향 을 미치는지 비교 평가해보고자 한다.
장비는 Biograph mCT 64를 사용하였고 Phantom은 NEMA IEC Body Phantom을 사용하였다. 실험을 위해 환자 는 2017년 2월에서 3월까지 본원 PET/CT 검사를 시행한 환 자 20명을 대상으로 Lung, Liver, Bone에 관심영역을 선택 하여 기존 08f AC, 45f medium, 80f ultra sharp 방식의 CT kernel을 적용한 감쇠보정맵을 사용하여 PET/CT 영상 재구 성에 도입 후 방사능 농도(kBq/mL), SUVmax, SD(standard deviation) 변화 유무를 평가하였다.
Phantom 방사능 농도 측정 결과 B08f AC 대비 B45f 0.96%, B80f 6.58% 증가하였고 B08f AC 대비 B45f 0.86%, B80f 6.54%각각 증가하였고, SD의 경우 B08f AC 대비 B45f 1.27%, B80f 6.96% 증가하였다. 환자에서 부위별 SUV는 Lung에서 B08f AC 대비 B45f 1.6%, B80f 6.6%, Liver에서 B08f AC 대비 B45f 0.7%, B80f 4.7%, Bone에서 B08f AC 대비 B45f 1.3%, B80f 6.2% 증가를 보였다. 부위별 SD는 Lung에서 B08f AC 대비 B45f 6.2%, B80f 15.4%, Liver에서 B08f AC 대비 B45f 2.1%, B80f 11%, Bone에서 B08f AC 대비 B45f 를 사용할 때 2.3%, B80f 14.7% 증가를 보였다. CT Kernel변화에 따라 sharpness noise와 영상의 질 은 변화를 보였으나 SUVmax와 SD는 통계적으로 유의한 차 이가 없었다.(P>.05).
핵의학 영상은 정량적인 평가가 중요하다 따라서 부위에 따라 CT kernel이 적절하게 조절되고 noise level이 낮은 감 쇠보정 맵을 사용하여 PET/CT 재구성시에 적용하여 정량적 평가에 오류를 줄이는 것이 중요하다고 사료되므로 따라서 같은 부위라 할지라도 sharpness noise가 인위적으로 증가된 kernel을 사용하는 것보다 noise가 낮은 kernel을 사용하는 것이 SD편차를 줄이고 정량적인 평가에 오류를 적게 하여 정확한 진단과 SUV 측정에 유용할 것으로 사료된다.
Reference
1. 고창순. 고창순 핵의학. 제3판. 고려의학. 2008;86.
2. Ronald Boellaard. Effects of Noise, Image Resolution, and ROI Definition on the Accuracy of Standard Uptake Values: A Simulation Study. J Nucl Med September 1, 2004 vol. 45 no. 9 1519-1527
3. Shyam M. Srinivas, .A recovery coefficient method for partial volume correction of PET images. Annals of Nuclear Medicine, June 2009, Volume 23, Issue 4, pp 341–348 4. Lee-Tzuu Chang, A Method for Attenuation Correction in
Radionuclide Computed Tomography. IEEE Transactions on Nuclear Science Volume: 25, Issue: 1, Feb. 1978 p 638 - 640
5. N.A. Mullani, J. Markham, M.M. Ter-Pogossian, "Feasibility of time-of-flight reconstruction in positron emission tomography", Journal of Nuclear Medicine, vol. 21, pp.
1095-97, 1980.