Original Article PET-CT에서 감쇠보정 영상과 비감쇠보정 영상을 통한 Metal Artifact 보정에 대한 고찰
서울대학교병원 핵의학과
김준·김재일·이홍재·김진의
Metal artifact SUV estimation by using attenuation correction image and non attenuation correction image in PET-CT
June Kim, Jae-II Kim, Hong-Jae Lee and Jin-Eui Kim
Department of Nuclear Medicine, Seoul National University Hospital, Seoul, Korea
Purpose
Because of many advantages, PET-CT Scanners generally use CT Data for attenuation correction. By using CT based attenuation correction, we can get anatomical information, reduce scan time and make more accurate correction of attenuation. However in case metal artifact occurred during CT scan, CT-based attenuation correction can induce artifacts and quantitative errors that can affect the PET images. Therefore this study infers true SUV of metal artifact region from attenuation corrected image count -to- non attenuation corrected image count ratio.Materials and Methods
Micro phantom inserted18
F- FDG 4mCi was used for phantom test and Biograph mCT S(40) is used for medical test equipment. We generated metal artifact in micro phantom by using metal. Then we acquired both metal artifact region of correction factor and non metal artifact region of correction factor by using attenuation correction image count –to- non attenuation correction image count ratio. In case of clinical image, we reconstructed both attenuation corrected images and non attenuation corrected images of 10 normal patient(66±15age) who examined PET-CT scan in SNUH. After that, we standardize several organs of correction factor by using attenuation corrected image count -to- non attenuation corrected count ratio. Then we figured out metal artifact region of correction factor by using metal artifact region of attenuation corrected image count -to- non attenuation corrected count ratio And we compared standard organs correction factor with metal artifact region correction factor.Results
according to phantom test results, metal artifact induce overestimation of correction factor so metal artifact region of correction factors are 12% bigger than the non metal artifact region of correction factors. in case of clinical test, correction factor of organs with high CT number(>1000) is 8±0.5%, correction factor of organs with CT number similar to soft tissue is 6±2% and correction factor of organs with low CT number(-100>) is 3±1%. Also metal artifact correction factors are 20% bigger than soft tissue correction factors which didn`t happened metal artifact.Conclusion
metal artifact lead to overestimation of attenuation coefficient. because of that, SUV of metal artifact region is overestimated. Thus for more accurate quantitative evaluation, using attenuation correction image count -to- non attenuation correction image count ratio is one of the methods to reduce metal artifact affectKey Words
PET/CT, CT attenuation correction, metal artifact,18
F-FDG4)
∙ Received: September 23, 2016 Accepted: October 4, 2016
∙ Correspoding author : June Kim
Address for correspondence : Department of Nuclear Medicine, Seoul National University Hospital 101 Daehang-ro, Jongno-gu, Seoul, 110-744, Korea
Tel : +82-2-2072-3937 E-mail : [email protected]
서 론
양전자단층촬영은 각종 생화학적 물질의 생체 내 분포를 영상화하여 인체 내의 생리적 지표들을 정량적으로 측정할 수 있어 생화학 또는 병리현상의 규명과 질병 진단, 치료 후 예후 판정, 치료계획 등에 유용하게 이용되고 있다. 특히 종
양 분야에서 그 활용도가 매우 높지만 상대적으로 해부학적 인 정보가 부족하고 해상도가 낮아 최근에는 PET-CT를 통 하여 이러한 한계를 극복 하고 있다. 또한 PET 영상에서 감 마선의 감쇠 정도가 체내 위치에 따라 다르고 컴프턴 산란이 배경잡음을 유발하는 문제, 검출기 내 효율성의 차이 등을 해결하기 위해 투과영상을 외부 감마선원을 이용하여 얻었 던 것에 비해 이를 CT 영상으로 대체함으로써 스캔시간이 단축 될 뿐만 아니라 더 정확한 보정이 가능하게 되었다
1,2)
. 감쇠보정 시 반드시 필요한 값이 보정계수(
)인데, CT를 기반으로 감쇠보정을 한다는 것은 이 보정계수(
)를 CT 를 통해 구하여 감쇠보정을 한다는 것이다. 그런데 CT 검사 시 metal artifact가 발생하게 된다면, 감쇠보정을 하는데 필 요한 보정계수(
)에 오차가 발생하게 된다. 그리고 잘못 평가 된 보정계수(
)는 SUV의 오류를 유발시켜 정량적 평가에 오류를 발생 시킨다3-5)
. 때문에 metal artifact의 영향 을 최소화하기 위한 여러 방법이 연구·개발 되어 오고 있다6,7)
. 본 논문에서는 감쇠보정공식을 치환함으로써 감쇠보정 영상의 count(I)와 비 감쇠보정 영상의 count(I0
)의 비(
)를 통해 보정계수(
)를 구할 수 있는 것을 이용하였다. 먼저 metal artifact가 발생한 부위의 보정계수(M)와 발생하지 않 은 부위의 보정계수(A)를 구하고, 이 두 보정계수의 비(
) 를 metal artifact가 발생 된 부위에서 측정한 SUV 곱함으로 써 Metal artifact가 발생 된 부위의 실제 SUV을 추정해보았 다(Fig. 1).
Fig. 1. Transposition of attenuation correct expression.
대상 및 방법 1. 팬텀실험재료
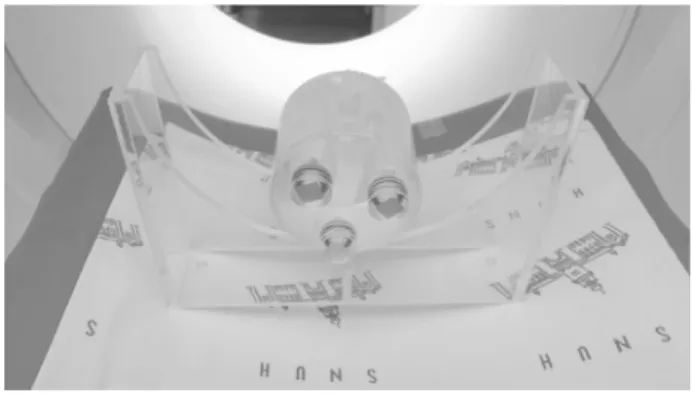
팬텀은 micro phantom을 사용하였다(Fig. 2). micro phantom 2개의 구(sphere)를 모두 열소(hot lesion)로 설정 하 였고,
18
F- FDG 방사성의약품을 이용하여 백그라운드와 첫 번째 구, 두 번째 구의 비율이 1:5:10이 되도록 하였다. 팬텀 실험에 사용된 촬영장비는 Biograph mCT S(40)_SIMENS이 며, Biograph mCT S(40)은 LSO을 크리스탈로 사용 하였고, Axial FOV은 216mm 분해능은 2mm이다. CT는 40 Slice에 Care dose 기능을 탑재하였다(Fig. 3).Fig. 2. Micro Phantom.
Fig. 3. Biograph mCT S (40)_SIMENS.
2. 팬텀실험방법
1:5:10 비율의 방사성의약품 18F-FDG을 주입한 micro phantom에 metal artifact를 발생시켜 촬영한다. 이때 CT 촬 영조건은 120kVp에 28mAs 이며 PET reconstruction방법은 iterative + TOF 방법으로 하였다. 그 후 감쇠보정 영상과 비 감쇠보정 영상으로 재구성하였다. 그리고 SIMENS 사의 Syngo.via VA11A을 이용하여 감쇠보정, 비 감쇠보정 각각
의 영상에서 metal artifact가 발생한 지점의 count과 metal artifact가 발생하기 직전slice 지점(X,Y축은 metal artifact가 발생한 임의의 점과 동일한 위치, Z축은 metal artifact가 발 생한 임의의 점에서 1~2 slice 전)의 count를 측정하여 그 비 율을 통해 보정계수(
)를 구하였다. 그 후 두 지점 각각의 감쇠보정 영상과 비 감쇠보정 영상의 count비를 통해 2개의 보정계수(metal artifact 보정계수, non metal artifact 보정계 수)를 구하였고 이를 비교 해보았다(Fig. 4). 또한 본 논문에 서 치환한 식을 통해 계산한 metal artifact 발생 부위 실제 SUV 추정값과 Metal artifact가 발생하지 않은 지점의 SUV 측정값을 비교해보았다.Fig. 4. Micro Phantom test (with metal artifact).
3. 임상영상
임상영상에서는 본원에 내원한 환자 10명(66±15세)의 영 상을 TOF+iteratiove 방식으로 감쇠보정 영상과 비 감쇠보정 영상으로 재구성하였다. 그리고 이 10명의 임상영상을 분석 하여, normal로 판독되고 metal artifact가 발생되지 않은 여 러 장기의 감쇠보정 영상과 비 감쇠보정 영상의 count를 SIMENS 사의 Syngo.Via VA11A을 통해 측정하여 그 비율 을 통해 보정계수(
)를 구하였고, 여러 장기(대퇴 뼈, 혈 관, 간, 심근, 쇄골 뼈, 연부조직, 근육, 지방, 폐)에 대한 보정 계수의 평균값을 구하여 이를 그래프로 작성하였다(Fig.5).또한 metal artifact가 발생한 soft tissue에서의 감쇠보정 전, 후의 PET 영상을 만들고 이 두 영상의 count 비율을 통해 metal artifact가 발생한 soft tissue의 보정계수를 구하고, metal artifact가 발생되지 않은 soft tissue의 보정계수와 비교 해 보았다. 그리고 그래프로 작성한 장기에 대한 보정계수 평균값의 유용성을 평가하기 위해 그래프로 작성한 평균 보 정계수와 metal artifact 발생 장기의 보정계수 차이와 각 개 인별 metal artifact가 발생 안한 장기의 보정계수와 metal artifact 발생 장기의 보정계수 차이를 비교하였다(Fig. 6).
Fig. 5. Clinical image (figure out correction factor of normal organs).
Fig. 6. Clinical image (figure out correction factor of metal artifact region).
결 과 1. phantom 실험결과
phantom 실험결과 metal artifact 발생 시 밝은 artifact 부위 와 어두운 artifact 부위로 구분 되어졌다. 밝은 artifact 부위에 서의 보정계수는 Metal artifact가 발생하지 않은 부위의 보정 계수(
)보다 평균 12% 증가 되게 나타났다. 어두운 artifact 부위의 보정계수는 발생하지 않은 부위의 보정계수 보다 평균 6% 감소 된 것으로 나타났다(Fig. 7, Table 1).Fig. 7. Result of Phantom test (compare region of metal artifact correction factor with region of non metal artifact correction factor).
Fig. 8. Graph of several organs average correction factor.
장기 lung fat muscle soft
tissue
Bone (clavicle)
Heart
muscle liver vessel Heart blood
Bone (femur)
AC/ NON AC 2.8 3.1 4.4 4.5 5.5 7.1 7.2 7.2 7.4 8.1
CT NUMBER -781 -104 48 44 516 44 47 43 45 1550
S.D 0.5 0.4 0.3 0.8 0.6 0.3 0.7 0.5 0.4 0.6
Table 3. Result of clinical image (several organs average correction factor) Table.1. Result of Phantom test
case1 case2 case3 case4 case5 보정 계수 %diff Non
metal artifact 2.6 2.5 2.4 2.4 2.4 2.46 white
metal artifact 2.9 2.7 2.9 2.9 2.7 2.82 12%
black
metal artifact 2.4 2.3 2.3 2.2 2.2 2.28 -6%
또한 phantom 실험을 통하여 본 논문에서 활용한 식을 통 해 계산한 metal artifact 발생부위의 실제 SUV 추정 값과 metal artifact가 발생하지 않은 부위의 SUV 측정값은 유의미 한 차이가 없는 것으로 나타났다(Table 2).
Table 2. Result of Phantom test (compare estimation SUV with non metal artifact mesurement SUV)
AC count Non AC 보정계수 측정 SUV 계산 SUV metal 334320 116955 2.9 1.5
1.4
non metal 319420 122878 2.61.4
metal 589430 214782 2.7 2.6
2.4
non metal 532330 216323 2.52.3
2. 임상영상 결과
임상영상을 10명의 환자들의 데이터 분석하여 얻은 normal 장기의 보정계수 평균값은 폐 2.7, 지방 3.0, 근육 4.4, 연부조직 4.8, 쇄골 뼈 4.8, 심근 7.1, 간 7.1, 혈관 7.2, 대퇴 뼈 8.3으로 나타났다(Fig. 8, Table 3). 즉 CT number가 높은 (>1000) 장기는 보정계수가 8±0.5%로 비교적 높게 측정되 었고, CT number가 soft tissue 비슷한(40∼60) 장기의 경우
Fig. 9. Result of Clinical image(compare soft tissue of metal artifact correction factor with soft tissue of non metal artifact correction factor).
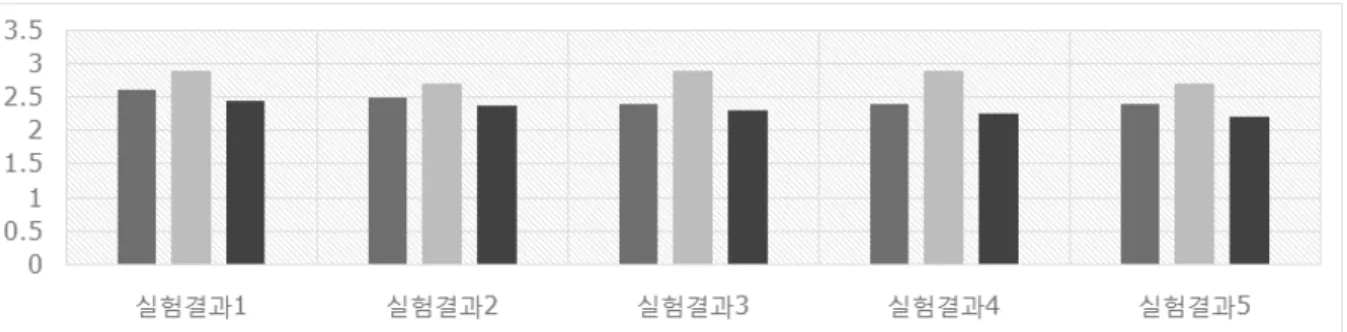
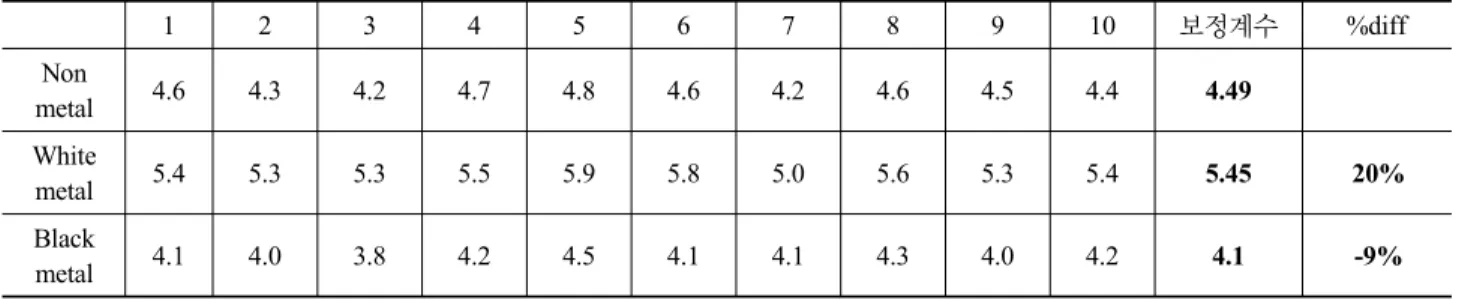
1 2 3 4 5 6 7 8 9 10 보정계수 %diff
Non
metal 4.6 4.3 4.2 4.7 4.8 4.6 4.2 4.6 4.5 4.4 4.49
White
metal 5.4 5.3 5.3 5.5 5.9 5.8 5.0 5.6 5.3 5.4 5.45
20%
Black
metal 4.1 4.0 3.8 4.2 4.5 4.1 4.1 4.3 4.0 4.2 4.1
-9%
Table 4. Result of Clinical image (compare soft tissue of metal artifact correction factor with soft tissue of non metal artifact correction factor)
는 6±2%로 나타났다. CT number가 낮은(-100>) 장기의 경우 3±1%로 상대적으로 보정계수가 낮게 나타났다. 이를 토대 로 CT number가 큰 장기 일수록 보정계수도 커지는 상호 비 례 관계를 확인 할 수 있었다.
또한 metal artifact 발생지점의 보정계수와 발생되기 직전 지점(X,Y 축은 metal artifact 발생지점과 동일 Z축은 metal artifact 발생지점보다 1~2 Slice 전)의 보정계수를 비교 했을 땐 metal artifact로 인한 밝은 artifact 부위의 연부조직 보정계 수는 metal artifact가 발생 하지 않은 연부조직 보정계수에 비해 평균 20% 증가하였다. 그리고 어두운 artifact 부위는 평 균 10% 감소 된 것으로 나타났다(Fig. 9, Table 4). 앞서 그래 프로 작성했던 soft tissue 평균값과 비교 하였을 땐 metal artifact가 발생 하지 않은 연부조직에 비해 밝은 artifact 부분 은 평균 19% 증가 어두운 artifact 부분은 평균 9% 감소 된 것 으로 나타났다. 이 결과로 보아 경우에 따라 개인의 보정계 수를 매번 계산 할 필요 없이 평균값을 간편하게 활용 할 수 있을 것으로 사료된다.
결 론
암 진단에 많이 도움이 되고 있는 PET-CT는 CT를 통해 감 쇠보정을 함으로써 기존의 PET에 비해 검사시간이 단축되 고, 해부학적 정보를 얻을 수 있으며, 정확한 감쇠보정이 이
루어진다. 하지만 CT 검사 시 metal artifact가 발생되면 PET 영상에도 영향을 주어 정량적 평가에 오류가 발생하게 된다.
밝은 artifact 부위에서는 보정계수가 본래 값보다 높게 평가 되어 SUV가 높게, 어두운 artifact 부위에서는 보정계수가 본 래 값보다 낮게 평가 되어 SUV가 낮게 측정 된다. 때문에 제 거 할 수 있는 metal은 제거하여 촬영하고, Metal Artifact Reduction과 같은 소프트웨어 프로그램을 사용하거나, CT 검사 시 kVp, mAs, filter 등을 조절하는 것 같은 CT parameter 를 조절하는 방법 등 metal artifact의 영향을 최소화하기 위 한 여러 방법이 연구·개발 되어 오고 있다. 본 논문에서 제시 하였던 감쇠보정 식을 치환·활용하여 감쇠보정 영상과 비 감 쇠보정 영상에서의 count의 비를 통해 metal artifact가 발생 하지 않는 부위의 보정계수와 발생한 부위의 보정계수 (
)를 구하고, 이를 활용하여 metal artifact 발생부위의 SUV 측정값에 대입하여 metal artifact 발생부위의 실제 SUV를 추정하는 방법 역시 더 정확한 정량분석 위하여 고려 해볼 수 있는 대안이 될 수 있을 것이라 사료 된다.요 약
최근엔 대부분의 PET-CT영상의 감쇠보정은 많은 강점을 가지고 있는 CT를 기반으로 사용하고 있다. 하지만 CT 검사 때 metal artifact가 발생하게 된다면, PET 영상에서 영향을
주게 된다. 이에 본 논문에서는 감쇠보정 영상의 count와 비 감쇠보정 영상의 count의 비를 통하여 보정계수(
)을 구 하였고 이를 통해 측정 SUV에 대입하여 실제 SUV를 추정하 는 방법에 대하여 고찰해보았다. 실험장비로는 본원에서 사 용하고 있는 Biograph mCT S(40)_SIMENS을 촬영 장비로 이용하였고, phantom은 micro phantom을 사용하였다. 팬텀 실험방법은 micro phantom에 metal artifact를 발생시켜 촬영 한 뒤 감쇠보정 영상과 비 감쇠보정 영상으로 재구성하였다.그리고 SIMENS 사의 Sygo.via VA11A 프로그램을 이용 감 쇠보정 영상과 비 감쇠보정 영상의 count를 측정하고 이를 통해 보정계수를 구하여 Metal artifact 발생 부위와 Metal artifact 발생 직전 부위의 보정계수를 비교 분석해 보았다. 임 상영상에서는 본원에 내원한 환자 10명(66±15세)의 데이터 를 이용하여 여러 장기의 평균 보정계수를 계산하였고, Metal artifact가 발생한 연부조직의 보정계수와 metal artifact가 발생하기 직전의 연부조직의 보정계수를 비교 분 석하였다. 분석결과 phantom 실험에서는 밝은 artifact 부분 에서의 보정 계수는 Metal artifact가 발생하지 않은 부분에서 의 보정계수보다 평균 12%증가 되게 나타났다. 어두운 artifact 부분에서의 보정계수는 발생하지 않은 부분에서의 보정계수보다 6% 감소 되게 나타났다. 또한 phantom 실험 결과 본 논문에서 사용한 식을 이용한 추정 SUV가 실제 SUV와 유의미한 차이가 없다는 것을 확인 할 수 있었다. 임 상영상에서는 normal 장기의 보정계수를 계산 하였고, 이를 이용한 각 장기의 평균 보정계수를 계산하여 그래프를 작성 하였다. 그리고 이 결과 값을 통해 CT number가 큰 조직 일수 록 보정계수도 커지는 상호 비례 관계를 확인 할 수 있었다.
또한 metal artifact시 밝은 artifact 부분의 연부조직 보정계수 는 metal artifact가 발생 하지 않은 연부조직 보정계수에 비 해 평균 20% 증가, 그리고 어두운 artifact 부분은 10% 감소 된 것으로 나타났다. 그래프로 작성한 soft tissue 평균값과 비 교 하였을 때는 metal artifact가 발생 하지 않은 연부조직에 비해 밝은 artifact 부위는 평균 19% 증가 어두운 artifact 부위 는 평균 9% 감소 된 것으로 나타났다. 즉 경우에 따라 각 개인 의 보정계수를 계산 할 필요 없이 그래프로 작성한 평균값을 간편하게 활용 할 수 있을 것으로 사료된다. 이와 같이 실험 결과로 보아 본 논문에서 제시하였던 감쇠보정 영상과 비 감 쇠보정 영상에서의 count의 비를 통해 metal artifact가 발생 하지 않는 부위의 보정계수와 발생한 부위의 보정계수를 구 하고, 이를 활용하여 측정 SUV에 대입하여 실제 SUV를 추정 하는 방법 역시 metal artifact 발생 부위의 더 정확한 정량분석 위하여 고려 해볼 수 있는 대안이 될 수 있을 것이라 사료 된다.
References
1. 정준기, 이명철, 고창순 핵의학, 제3판, 고려의학, 2008;
86, 103-104.
2. Kinahan, Artifactual 2-Deoxy-2-[18F]Fluoro-D-Glucose Localization Surrounding Metallic Objects in a PET/CT Scanner Using CT-Based Attenuation Correction,
Molecular Imaging & Biology Volume 5, Issue 1, January–
February 2003, Pages 20–22.
3. Ehab M. Kamel, Cyrill Burger, Alfred Buck, Gustav K. von Schulthess, Gerhard W. Goerres, Impact of metallic dental implants on CT-based attenuation correction in a combined PET/CT scanner, European Radiology, April 2003, Volume 13, Issue 4, pp 724–728.
4. Gerhard W. Goerres, Thomas F. Hany, Ehab Kamel, Gustav K. von Schulthess, Alfred Buck, Head and neck imaging with PET and PET/CT: artefacts from dental metallic implants, European Journal of Nuclear Medicine and
Molecular Imaging, March 2002, Volume 29, Issue 3, pp
367–370.5. Waheeda Sureshbabu, CNMT, PET 1 and Osama Mawlawi, PhD 2, PET/CT Imaging Artifacts, jounalJournal of
Nuclear Medicine Technology, September 1, 2005 vol. 33
no. 3 156-161.6. Mehrsima Abdoli1, Rudi A. J. O. Dierckx1 and Habib Zaidi, Metal artifact reduction strategies for improved attenuation correction in hybrid PET/CT imaging, Medical Physics. 39, 3343 (2012); http://dx.doi.org/10.1118/1.4709599.
7. John A. Kennedy, Ora Israel, Alex Frenkel, Rachel Bar-Shalom, Haim Azhari, The reduction of artifacts due to metal hip implants in CT-attenuation corrected PET images from hybrid PET/CT scanners, Medical & Biological