저작자표시-비영리-변경금지 2.0 대한민국 이용자는 아래의 조건을 따르는 경우에 한하여 자유롭게 l 이 저작물을 복제, 배포, 전송, 전시, 공연 및 방송할 수 있습니다. 다음과 같은 조건을 따라야 합니다: l 귀하는, 이 저작물의 재이용이나 배포의 경우, 이 저작물에 적용된 이용허락조건 을 명확하게 나타내어야 합니다. l 저작권자로부터 별도의 허가를 받으면 이러한 조건들은 적용되지 않습니다. 저작권법에 따른 이용자의 권리는 위의 내용에 의하여 영향을 받지 않습니다. 이것은 이용허락규약(Legal Code)을 이해하기 쉽게 요약한 것입니다. Disclaimer 저작자표시. 귀하는 원저작자를 표시하여야 합니다. 비영리. 귀하는 이 저작물을 영리 목적으로 이용할 수 없습니다. 변경금지. 귀하는 이 저작물을 개작, 변형 또는 가공할 수 없습니다.
A Phantom Study for Attenuation Change and Detection of
Calcification in Lung Nodules According to Variation of
Examination Techniques in Low Dose CT
by
Jae Yong Cho
Major in Medicine
Department of Medical Sciences
The Graduate School, Ajou University
A Phantom Study for Attenuation Change and Detection of
Calcification in Lung Nodules According to Variation of
Examination Techniques in Low Dose CT
by
Jae Yong Cho
A Dissertation Submitted to The Graduate School of
Ajou University in Partial Fulfillment of the Requirements for the Degree of
Master of Medicine
Supervised by
Kyung Joo Park, M.D., Ph.D.
Major in Medicine
Department of Medical Sciences
The Graduate School, Ajou University
This certifies that the dissertation
of Jae Yong Cho is approved.
The Graduate School, Ajou University
December, 18th, 2015
ABSTRACT
Purpose : To evaluate the attenuation change of hyperdense lung nodule and
diagnostic performance of visual assessment according to various tube voltage and
current setting in low-dose CT comparing with standard-dose CT.
Material and Methods : A chest phantom containing artificial nodules was scanned
with 64-detector-row and 128-detector-row CT scanners using a standard and various
low-dose settings with iterative reconstruction. Mean attenuation of nodules and
image noise were compared between the standard-dose and low-dose images.
Diagnostic accuracy of visual assessment by two readers for discrimination of
hyperdense nodule was analyzed using CT images of standard and 5 selected
low-dose settings.
Results : Mean CT attenuation of nodules was increased with low tube voltage and
image noise was increased with low tube voltage and current in both CT scanners.
Mean attenuation of some nodules below hyperdense criteria (200 HU) on
standard-dose CT was changed to considerably above 200 HU on low tube current and voltage
assessment was not different between standard-dose and low-dose CT scans.
Inter-observer agreement for grading of hyperdense nodule showed better agreement in
higher radiation-dose scans.
Conclusion : Low-dose CT maintains the diagnostic accuracy in visual assessment
of hyperdense lung nodule despite increased image noise and higher attenuation
criteria will be necessary for determining hyperdense nodule using CT densitometry
in low-dose setting.
TABLE OF CONTENTS
ABSTRACT ··· ⅰ TABLE OF CONTENTS ··· ⅱ ORDER OF FIGURES ··· ⅲ ORDER OF TABLES ··· ⅳ Ⅰ. INTRODUCTION ··· 1Ⅱ. MATERIAL AND METHODS ··· 3
A.Anthropomorphic Phantom and Artificial Nodules ··· 3
B. CT Imaging ··· 10
C. Image Analysis ··· 10
D. Statistics ··· 12
Ⅲ. RESULTS ··· 13
A.CT Attenuation of Artificial Nodules ··· 13
B.Visual Assessment and Interobserver Correlation ··· 17
Ⅳ. DISCUSSION ··· 20
Ⅴ. CONCLUSION ··· 30
REFERENCE ··· 31
ORDER OF FIGURES
Fig. 1. Standard dose CT images of 10-mm phantom nodules obtained with 128-detector row CT scanner ··· 8
Fig. 2. Standard dose CT images of 7-mm phantom nodules obtained with 128-detector-row CT scanner ··· 9
Fig. 3. CT images of nodule 9 in various tube parameters obtained using 128-detector-row scanner ··· 27
Fig. 4. Floating bar diagram showing mean values and stadard deviations of the nodule 9 in 128-detector-row CT images ··· 28
Fig. 5. Floating bar diagram showing mean values and stadard deviations of the nodule 10 in 128-detector-row CT images ··· 29
ORDER OF TABLES
Table 1. CT attenuation of the phantom nodules in 128-detector-row CT scan ··· 4
Table 2. CT attenuation of the phantom nodules in 128-detector-row CT scan ··· 5
Table 3. CT attenuation of the phantom nodules in 64-detector-row CT scan ··· 6
Table 4. CT attenuation of the phantom nodules in 64-detector-row CT scan ··· 7
Table 5. Linear regression analysis of CT attenuation in 128-detector-row CT scanner ··· 15
Table 6. Linear regression analysis of CT attenuation in 64-detector-row CT scanner ··· 16
Table 7. Five-point grading for discrimination of hyperdense nodules in each observers ··· 18
Table 8. Accuracy, sensitivity, specificity in discrimination of hyperdense nodule and inter-observer correlation of nodule grading between each readers ··· 19
I. INTRODUCTION
Recently, low-dose chest CT examinations are widely used for screening of
lung cancer due to the results of studies that proved a reduced lung cancer related
mortality in a high risk group using low-dose CT as a screening method1-4. However, low-dose CT imaging has a limitation of poor image quality which can reduce the
diagnostic accuracy. Some authors proposed the appropriate tube currents and tube
voltages of screening low-dose CT without loss of diagnostic quality, but it remains
on the debate5-10. For improving image quality, iterative reconstruction technique was introduced. Many reports showed that iterative reconstruction algorithm reduces
image noise and improves both objective and subjective image quality, compared
with filtered back projection (FBP) on chest CT even though the same dose of
radiation is delivered5, 11-15.
A mean CT attenuation of lung nodule was advocated as a good discriminator
of benignity16-18. Previous reports showed that high mean CT attenuation of lung nodule can be considered as a favorable sign of benignity16,18. It was presumed that diffuse calcification likely accounts for the higher CT numbers of some benign
lesions17. Proto et al. suggested that hyperdense nodules with a CT attenuation above 200 HU were benign, while evident calcification was not shown on conventional
radiograph16. Siegelman et al. suggested representative CT attenuation above 164 HU in lung nodule could be deemed benign18. However, these results cannot be directly applied to low-dose CT scan, because the CT attenuation changes according to the
alteration of tube parameters. To the best of our knowledge, there has been no
previous study about an effects of examination techniques of low-dose CT using
iterative reconstruction on the attenuation change of lung nodules and detection of
calcification.
The purpose of this phantom study was to evaluate the attenuation change of
lung nodule and the diagnostic performance of visual assessment according to
various setting of examination techniques in low-dose CT using iterative
II. MATERIAL AND METHODS
A. Anthropomorphic Phantom and Artificial Nodules
A commercially available lung phantom (Chest phantom N1 Lungman, Kyoto
Kagaku Co., Ltd, Kyoto, Japan) was used. Fourteen artificial phantom nodules were
created by mixtures of polyvinyl alcohol, calcium carbonate, and 3% solution of
borax. Spherical shaped nodules were in two different sizes (7 mm and 10 mm). Each
nodule had a variable concentration of calcium carbonate so that mean CT
attenuations of 14 nodules ranged from 80 to 410 HU when measured on CT images
obtained with standard dose (120 kVp / 100 mAs) (Table 1-4). The artificial nodules
were made to have round to oval shapes and smooth or slightly irregular surface.
Internal attenuation of nodules had a variety of heterogeneity with the range of
standard deviation from 21 to 118 HU on CT images obtained with standard dose.
These nodules were placed randomly between vascular structures of the lung
phantom similar to parenchymal lung nodules without direct contact with the
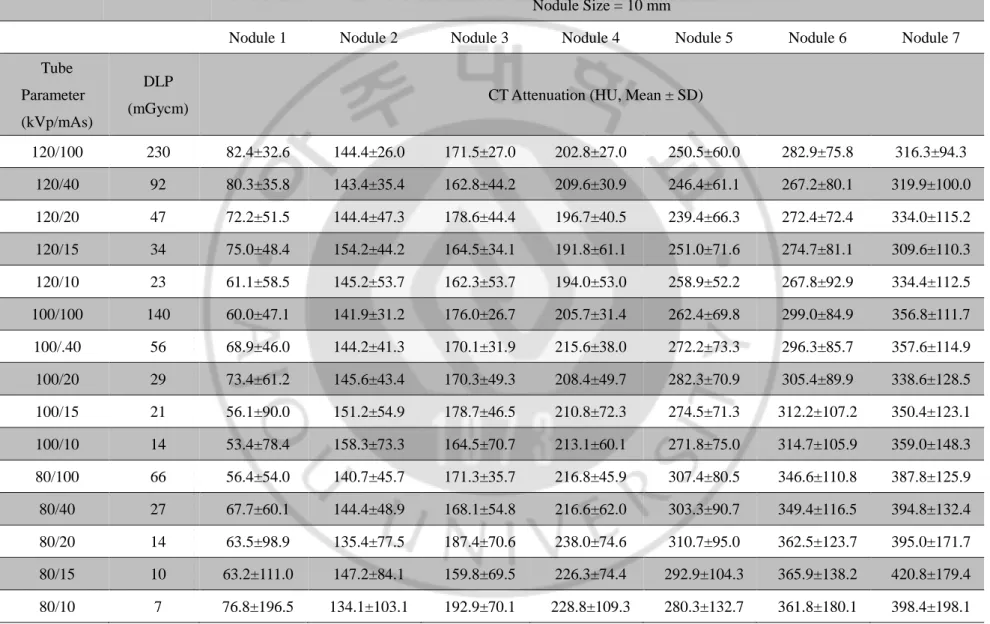
Table 1. CT attenuation of the phantom nodules in 128-detector-row CT scan
Nodule Size = 10 mm
Nodule 1 Nodule 2 Nodule 3 Nodule 4 Nodule 5 Nodule 6 Nodule 7
Tube Parameter (kVp/mAs)
DLP
(mGycm) CT Attenuation (HU, Mean ± SD)
120/100 230 82.4±32.6 144.4±26.0 171.5±27.0 202.8±27.0 250.5±60.0 282.9±75.8 316.3±94.3 120/40 92 80.3±35.8 143.4±35.4 162.8±44.2 209.6±30.9 246.4±61.1 267.2±80.1 319.9±100.0 120/20 47 72.2±51.5 144.4±47.3 178.6±44.4 196.7±40.5 239.4±66.3 272.4±72.4 334.0±115.2 120/15 34 75.0±48.4 154.2±44.2 164.5±34.1 191.8±61.1 251.0±71.6 274.7±81.1 309.6±110.3 120/10 23 61.1±58.5 145.2±53.7 162.3±53.7 194.0±53.0 258.9±52.2 267.8±92.9 334.4±112.5 100/100 140 60.0±47.1 141.9±31.2 176.0±26.7 205.7±31.4 262.4±69.8 299.0±84.9 356.8±111.7 100/.40 56 68.9±46.0 144.2±41.3 170.1±31.9 215.6±38.0 272.2±73.3 296.3±85.7 357.6±114.9 100/20 29 73.4±61.2 145.6±43.4 170.3±49.3 208.4±49.7 282.3±70.9 305.4±89.9 338.6±128.5 100/15 21 56.1±90.0 151.2±54.9 178.7±46.5 210.8±72.3 274.5±71.3 312.2±107.2 350.4±123.1 100/10 14 53.4±78.4 158.3±73.3 164.5±70.7 213.1±60.1 271.8±75.0 314.7±105.9 359.0±148.3 80/100 66 56.4±54.0 140.7±45.7 171.3±35.7 216.8±45.9 307.4±80.5 346.6±110.8 387.8±125.9 80/40 27 67.7±60.1 144.4±48.9 168.1±54.8 216.6±62.0 303.3±90.7 349.4±116.5 394.8±132.4 80/20 14 63.5±98.9 135.4±77.5 187.4±70.6 238.0±74.6 310.7±95.0 362.5±123.7 395.0±171.7 80/15 10 63.2±111.0 147.2±84.1 159.8±69.5 226.3±74.4 292.9±104.3 365.9±138.2 420.8±179.4 80/10 7 76.8±196.5 134.1±103.1 192.9±70.1 228.8±109.3 280.3±132.7 361.8±180.1 398.4±198.1
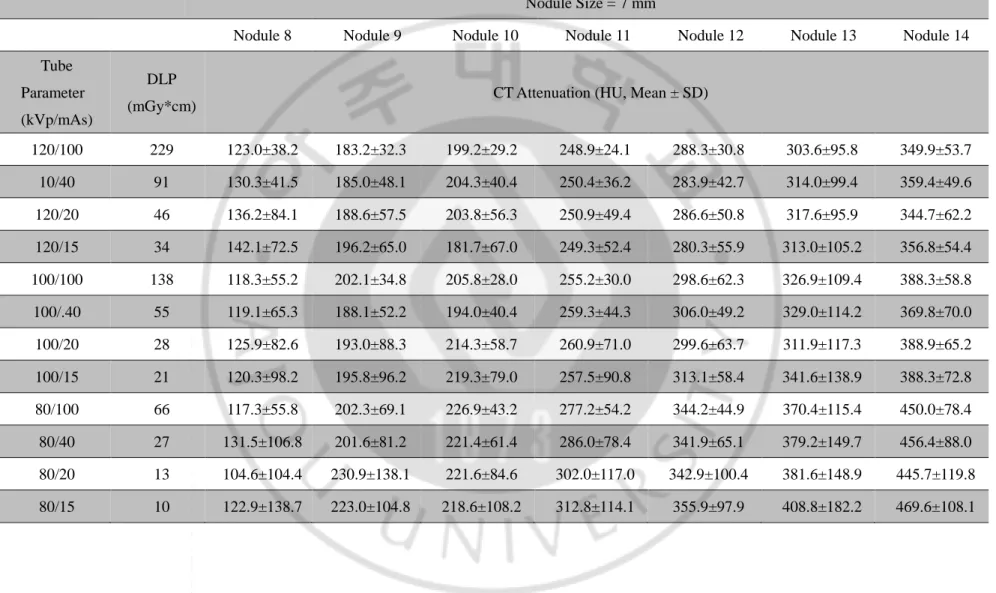
Table 2. CT attenuation of the phantom nodules in 128-detector-row CT scan Nodule Size = 7 mm
Nodule 8 Nodule 9 Nodule 10 Nodule 11 Nodule 12 Nodule 13 Nodule 14
Tube Parameter (kVp/mAs)
DLP
(mGy*cm) CT Attenuation (HU, Mean ± SD)
120/100 230 98.8±21.2 148.5±26.5 169.2±22.6 216.8±33.7 251.4±65.9 270.9±118.0 308.1±52.2 120/40 92 93.7±40.8 153.7±35.1 178.6±33.7 210.2±32.3 246.8±69.4 273.8±105.5 314.7±45.1 120/20 47 99.0±52.4 158.0±57.8 177.2±47.2 204.7±55.0 256.6±83.5 277.1±116.1 329.5±63.1 120/15 34 105.3±47.6 157.8±44.6 167.6±52.3 216.5±55.0 240.9±63.5 280.9±112.8 324.7±45.6 120/10 23 85.8±65.2 142.1±48.9 171.0±55.8 225.1±64.5 250.5±65.7 286.9±121.2 321.8±39.0 100/100 140 86.2±18.9 156.9±28.1 175.8±26.1 215.2±44.5 281.6±77.1 287.5±123.4 351.5±79.8 100/.40 56 95.8±34.8 151.6±51.4 177.7±30.0 228.8±54.6 271.5±63.9 298.8±121.8 344.1±52.6 100/20 29 96.1±64.0 151.0±46.2 175.2±46.3 226.6±84.9 278.8±66.9 299.1±144.2 338.8±51.5 100/15 21 110.1±78.6 144.9±46.1 176.1±56.9 251.7±95.8 275.7±98.3 300.4±135.0 351.8±88.6 100/10 14 102.2±71.8 179.1±90.6 175.0±83.1 228.6±99.0 292.1±118.7 352.6±172.8 329.5±98.6 80/100 66 89.1±53.2 165.9±34.5 171.5±36.2 241.3±42.2 313.9±92.2 355.9±158.4 406.0±64.0 80/40 27 97.0±55.6 159.6±77.0 167.4±50.0 248.8±52.1 312.9±93.3 357.8±178.9 393.9±87.5 80/20 14 72.2±113.4 174.0±101.4 178.7±86.4 245.1±97.8 316.7±77.3 373.0±201.2 401.6±96.2 80/15 10 84.7±124.1 185.7±85.1 177.9±106.3 261.1±120.7 329.2±121.1 374.9±239.6 405.1±99.6 80/10 7 84.0±119.4 203.1±163.6 200.0±89.4 223.5±115.9 318.4±151.1 355.1±196.7 419.1±115.9
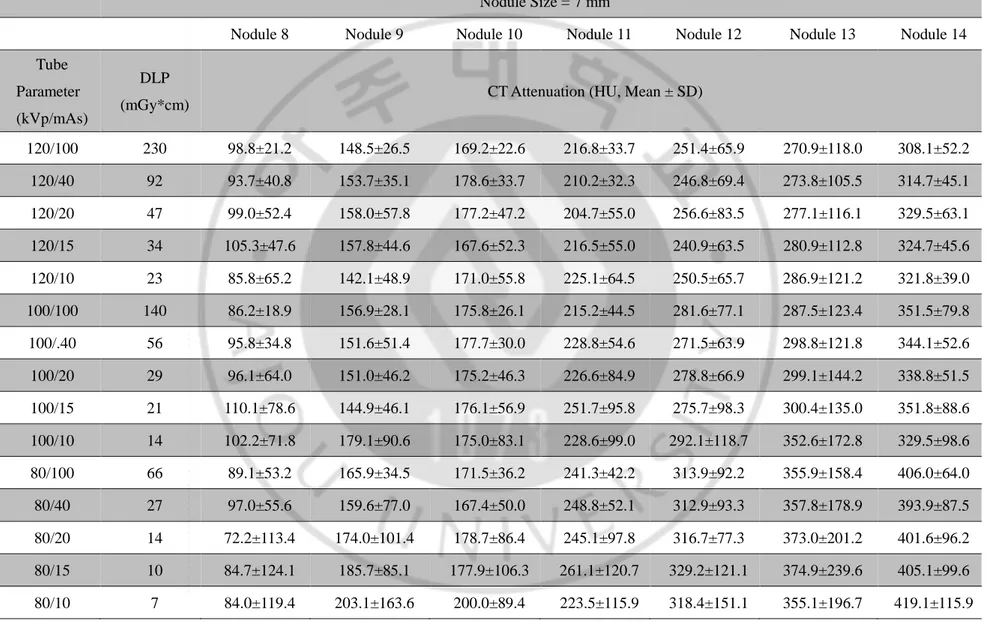
Table 3. CT attenuation of the phantom nodules in 64-detector-row CT scan
Nodule Size = 10 mm
Nodule 1 Nodule 2 Nodule 3 Nodule 4 Nodule 5 Nodule 6 Nodule 7
Tube Parameter (kVp/mAs)
DLP
(mGy*cm) CT Attenuation (HU, Mean ± SD)
120/100 229 109.4±35.8 174.5±26.9 203.3±24.1 233.6±26.0 307.7±56.9 320.8±72.3 402.7±64.9 120/40 91 111.9±54.9 183.3±42.3 202.5±38.7 232.9±41.6 300.3±51.6 318.5±79.0 404.8±69.5 120/20 46 113.5±61.8 174.1±36.9 203.6±40.0 232.2±45.3 306.2±61.1 318.0±74.7 401.8±97.6 120/15 34 116.5±77.8 184.7±50.2 196.3±55.4 229.7±63.6 300.1±52.9 309.8±61.0 396.1±89.9 100/100 138 101.6±43.1 179.6±23.5 193.3±31.8 239.0±48.5 322.0±53.9 345.6±85.1 437.6±78.5 100/.40 55 103.4±51.6 174.0±38.8 203.9±43.0 239.9±34.4 327.9±61.6 342.4±95.9 432.0±94.0 100/20 28 103.9±74.3 183.8±52.4 203.0±63.5 242.8±74.0 315.6±76.2 354.9±77.9 437.0±125.3 100/15 21 95.1±78.3 179.4±70.1 191.1±68.3 243.6±76.5 321.0±73.8 346.3±92.7 450.2±106.7 80/100 66 100.9±52.5 181.2±45.8 209.5±47.1 255.7±48.1 364.0±71.1 400.5±92.8 499.4±103.6 80/40 27 113.4±72.0 173.6±62.4 202.1±59.9 263.2±76.1 362.4±86.7 387.3±106.5 490.7±98.5 80/20 13 100.8±119.7 183.2±90.4 205.9±77.7 254.9±103.0 368.4±89.9 405.6±124.8 498.8±123.9 80/15 10 105.6±139.8 189.5±107.1 209.6±88.0 257.8±98.8 370.1±80.1 398.7±114.0 503.7±182.4
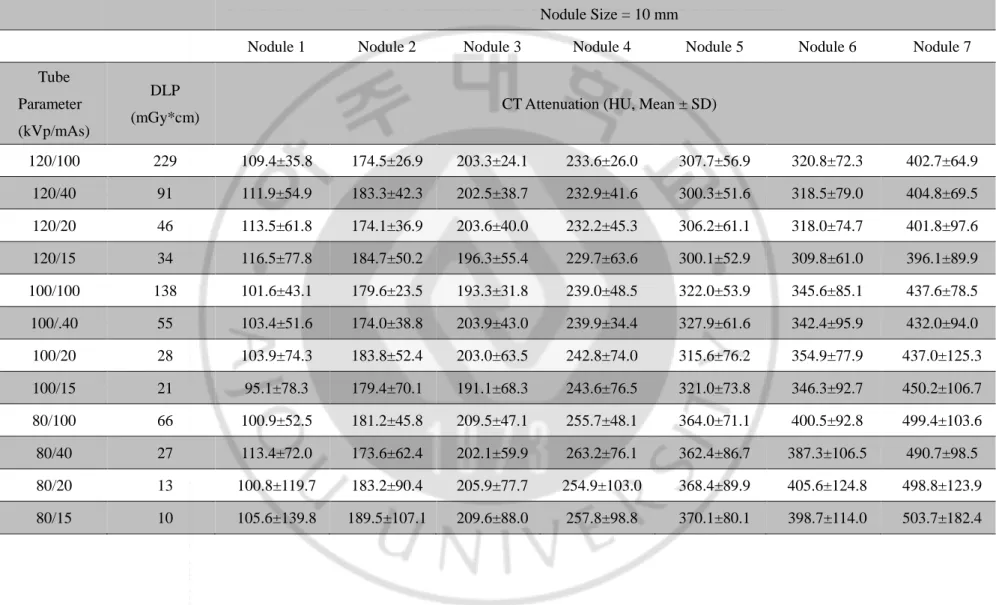
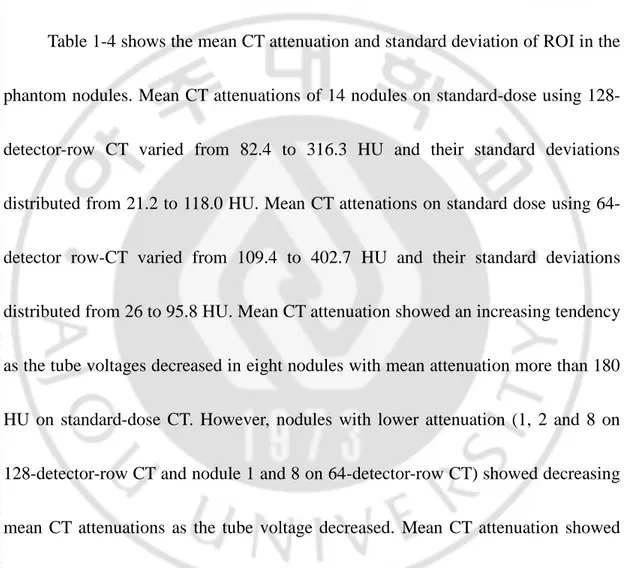
Table 4. CT attenuation of the phantom nodules in 64-detector-row CT scan
Nodule Size = 7 mm
Nodule 8 Nodule 9 Nodule 10 Nodule 11 Nodule 12 Nodule 13 Nodule 14
Tube Parameter (kVp/mAs)
DLP
(mGy*cm) CT Attenuation (HU, Mean ± SD)
120/100 229 123.0±38.2 183.2±32.3 199.2±29.2 248.9±24.1 288.3±30.8 303.6±95.8 349.9±53.7 10/40 91 130.3±41.5 185.0±48.1 204.3±40.4 250.4±36.2 283.9±42.7 314.0±99.4 359.4±49.6 120/20 46 136.2±84.1 188.6±57.5 203.8±56.3 250.9±49.4 286.6±50.8 317.6±95.9 344.7±62.2 120/15 34 142.1±72.5 196.2±65.0 181.7±67.0 249.3±52.4 280.3±55.9 313.0±105.2 356.8±54.4 100/100 138 118.3±55.2 202.1±34.8 205.8±28.0 255.2±30.0 298.6±62.3 326.9±109.4 388.3±58.8 100/.40 55 119.1±65.3 188.1±52.2 194.0±40.4 259.3±44.3 306.0±49.2 329.0±114.2 369.8±70.0 100/20 28 125.9±82.6 193.0±88.3 214.3±58.7 260.9±71.0 299.6±63.7 311.9±117.3 388.9±65.2 100/15 21 120.3±98.2 195.8±96.2 219.3±79.0 257.5±90.8 313.1±58.4 341.6±138.9 388.3±72.8 80/100 66 117.3±55.8 202.3±69.1 226.9±43.2 277.2±54.2 344.2±44.9 370.4±115.4 450.0±78.4 80/40 27 131.5±106.8 201.6±81.2 221.4±61.4 286.0±78.4 341.9±65.1 379.2±149.7 456.4±88.0 80/20 13 104.6±104.4 230.9±138.1 221.6±84.6 302.0±117.0 342.9±100.4 381.6±148.9 445.7±119.8 80/15 10 122.9±138.7 223.0±104.8 218.6±108.2 312.8±114.1 355.9±97.9 408.8±182.2 469.6±108.1
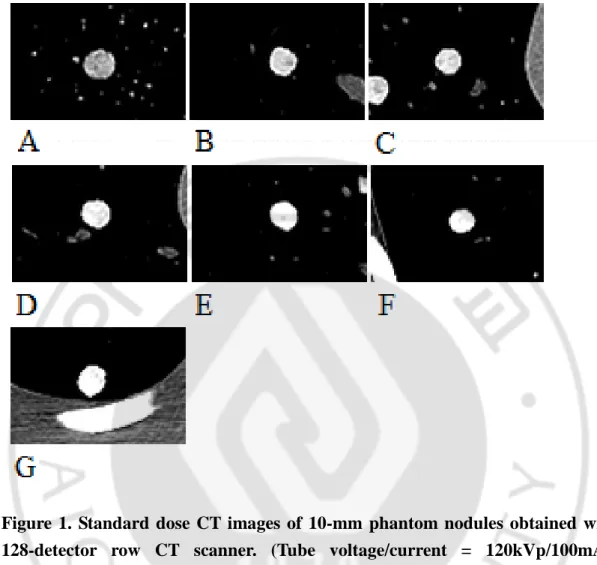
Figure 1. Standard dose CT images of 10-mm phantom nodules obtained with 128-detector row CT scanner. (Tube voltage/current = 120kVp/100mAs, Window width/level = 350/40)
(A) Nodule 1 (B) Nodule 2 (C) Nodule 3 (D) Nodule 4 (E) Nodule 5 (F) Nodule 6 (G) Nodule 7
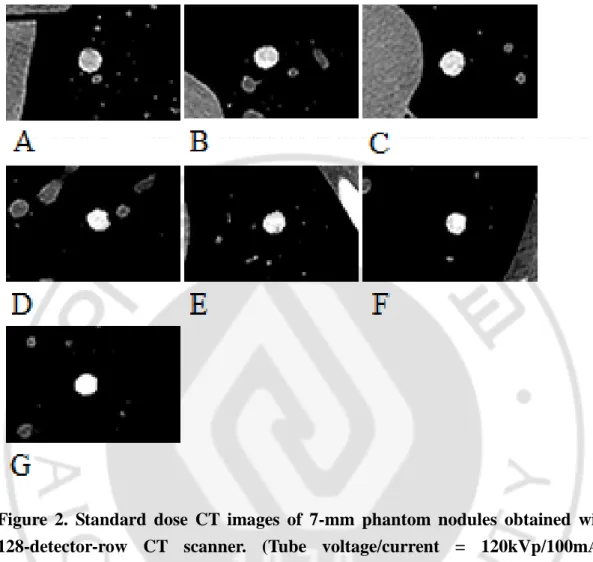
Figure 2. Standard dose CT images of 7-mm phantom nodules obtained with 128-detector-row CT scanner. (Tube voltage/current = 120kVp/100mAs, Window width/level = 350/40)
(A) Nodule 8 (B) Nodule 9 (C) Nodule 10 (D) Nodule 11 (E) Nodule 12 (F) Nodule 13 (G) Nodule 14
B. CT Imaging
CT images of the lung phantom containing artificial nodules were acquired
using a 128-detector-row CT scanner (SOMATOM Definition, Siemens, Munich,
Germany) and 64-detector-row CT scanner (Brilliance 64, Philips Healthcare,
Andover, MA). Imaging was performed with a variable combinations of tube
currents (15, 20, 40, 80, and 100 mAs in the both scanners and 10 mAs additionally
in 128-dector-row scanner) and voltages (80, 100, 120 kVp), which resulted in
eighteen and fifteen different protocols of each scanner. Fixed tube current was used
without automatic tube current modulation. SAFIRE (Siemens, Munich, Germany)
iterative reconstruction algorithm was used for image reconstruction on
128-detector-row CT scanner and iDose4 (Philips Healthcare, Andover, MA ) iterative reconstruction algorithm was used on 64-detector-row CT scanner. All images were
reconstructed by lung filter kernel. The other scan parameters were as follows:
collimation, 0.75 mm; pitch, 1.0; section thickness, 2mm.
C. Image Analysis
A mean value and standard-deviation of internal attenuation were measured by
circular region of interest (ROI) drawn in central area of nodules excluding periphery
within 1 mm from the surface using a slice image that showed the largest dimension
of the nodule. A tendency of alteration in CT attenuation of the nodules was
evaluated according to the change of tube current and voltage.
Two radiology trainees blinded to the results of attenuation measurement (with
3 years of training period) evaluated the phantom images of standard-dose (120
kVp/100 mAs) and five selected low-dose (120 kVp/40 mAs, 120 kVp/20 mAs, 100
kVp/20 mAs, 80 kVp/20 mAs, 80 kVp/10 mAs) CT images obtained using
128-detector-row CT for discrimination of hyperdense nodules. These low-dose tube
parameters were selected because they were thought to be representative for
evaluation of low-dose and ultra-low-dose chest CT using iterative reconstruction
referring to previous studies in the literature5, 19, 20. The threshold of 200 HU is used for the criteria of hyperdense nodule. Before the evaluation each reader had a
training period with the standard dose images showing a nodule with 200 HU of
mean attenuation. Each reader evaluated total 84 images of 14 nodules obtained with
under 200 HU ; 3-Equivocal attenuation ; 4-Probably over 200 HU ; 5-Absolutely
over 200 HU. The accuracy of grading was analyzed comparing with actual CT
attenuation of nodules. Interobserver correlation of nodule-grading between two
readers was also analyzed.
D. Statistics
The mean internal attenuation and standard-deviation of ROI were evaluated
by linear-regression analysis. The accuracy of nodule discrimination in five selected
low-dose CT scans were compared with standard-dose CT scan by McNemar test.
Interobsever correlation of nodule grading was analyzed using Cohen’s kappa
statistics. The Kappa strength of agreement was as follows: <0.20 poor agreement,
0.21–0.40 fair, 0.41–0.60 moderate, 0.61–0.80 good and 0.81–1.00 very good.
Linear-regression analysis and Cohen’s kappa statistics were performed using SPSS
III. RESULTS
A. CT Attenuation of Artificial Nodules
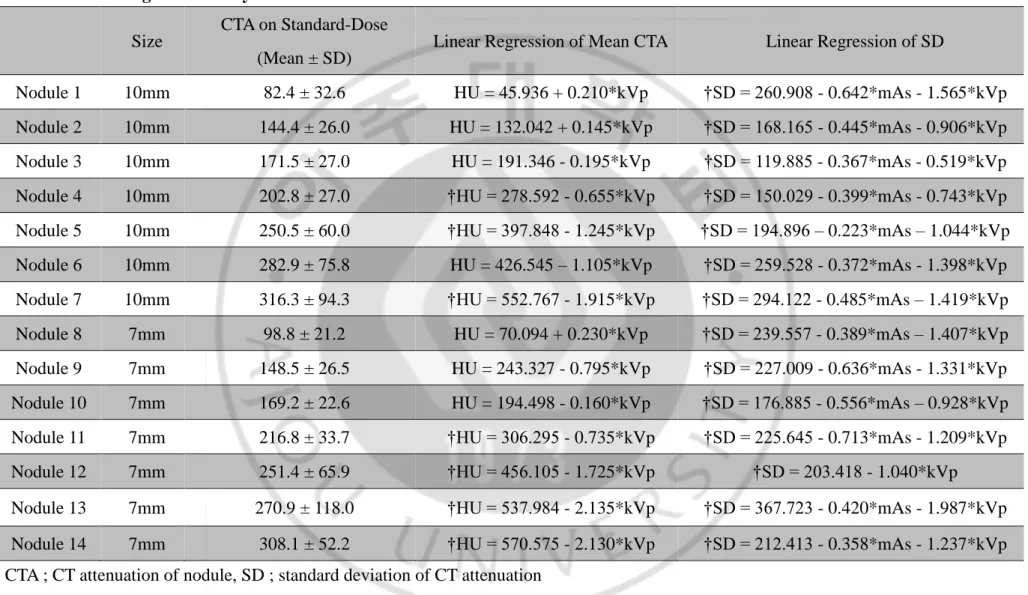
Table 1-4 shows the mean CT attenuation and standard deviation of ROI in the
phantom nodules. Mean CT attenuations of 14 nodules on standard-dose using
128-detector-row CT varied from 82.4 to 316.3 HU and their standard deviations
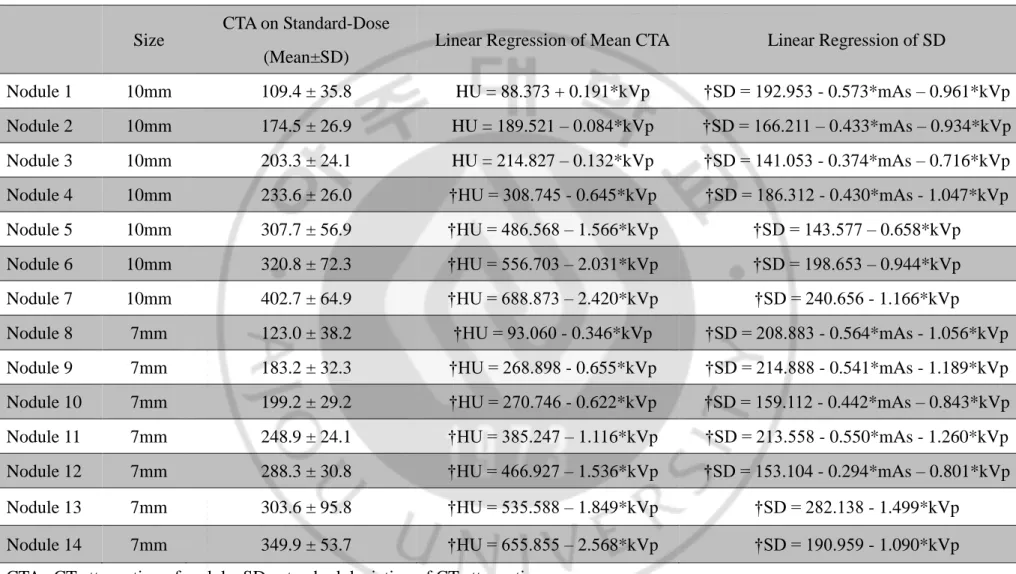
distributed from 21.2 to 118.0 HU. Mean CT attenations on standard dose using
64-detector row-CT varied from 109.4 to 402.7 HU and their standard deviations
distributed from 26 to 95.8 HU. Mean CT attenuation showed an increasing tendency
as the tube voltages decreased in eight nodules with mean attenuation more than 180
HU on standard-dose CT. However, nodules with lower attenuation (1, 2 and 8 on
128-detector-row CT and nodule 1 and 8 on 64-detector-row CT) showed decreasing
mean CT attenuations as the tube voltage decreased. Mean CT attenuation showed
negative linear relationship with tube voltage in seven nodules on 128-detector-row
CT and eleven nodules on 64-detector-row CT scanners. These results were
statistically significant (p<0.05). Tube current did not show linear relationship with
and 10 were below 200 HU on standard dose CT, they increased over 200 HU on low
dose CTs especially with 80 kVp/10 mAs combination. Standard deviation of CT
attenuation of nodules increased as the tube voltage decreased showing negative
linear relationship with statistical significancy (p<0.05) in both scanners. In relation
with the standard deviation of CT attenuation, tube current also showed statistically
significant (p<0.05) negative linear relationship in 13 nodules on 128-detector-row
CT and 9 nodules on 64-detector-row CT (Table 5 and 6). Standard deviations of
nodule attenuation are considerably increased when using low voltage and low
current combination (80 kVp/20 mA, or 80 kVp/15 mA) in more than 2 folds
Table 5. Linear regression analysis of CT attenuation in 128-detector-row CT scanner
Size CTA on Standard-Dose (Mean ± SD)
Linear Regression of Mean CTA Linear Regression of SD
Nodule 1 10mm 82.4 ± 32.6 HU = 45.936 + 0.210*kVp †SD = 260.908 - 0.642*mAs - 1.565*kVp Nodule 2 10mm 144.4 ± 26.0 HU = 132.042 + 0.145*kVp †SD = 168.165 - 0.445*mAs - 0.906*kVp Nodule 3 10mm 171.5 ± 27.0 HU = 191.346 - 0.195*kVp †SD = 119.885 - 0.367*mAs - 0.519*kVp Nodule 4 10mm 202.8 ± 27.0 †HU = 278.592 - 0.655*kVp †SD = 150.029 - 0.399*mAs - 0.743*kVp Nodule 5 10mm 250.5 ± 60.0 †HU = 397.848 - 1.245*kVp †SD = 194.896 – 0.223*mAs – 1.044*kVp Nodule 6 10mm 282.9 ± 75.8 HU = 426.545 – 1.105*kVp †SD = 259.528 - 0.372*mAs - 1.398*kVp Nodule 7 10mm 316.3 ± 94.3 †HU = 552.767 - 1.915*kVp †SD = 294.122 - 0.485*mAs – 1.419*kVp Nodule 8 7mm 98.8 ± 21.2 HU = 70.094 + 0.230*kVp †SD = 239.557 - 0.389*mAs – 1.407*kVp Nodule 9 7mm 148.5 ± 26.5 HU = 243.327 - 0.795*kVp †SD = 227.009 - 0.636*mAs - 1.331*kVp Nodule 10 7mm 169.2 ± 22.6 HU = 194.498 - 0.160*kVp †SD = 176.885 - 0.556*mAs – 0.928*kVp Nodule 11 7mm 216.8 ± 33.7 †HU = 306.295 - 0.735*kVp †SD = 225.645 - 0.713*mAs - 1.209*kVp Nodule 12 7mm 251.4 ± 65.9 †HU = 456.105 - 1.725*kVp †SD = 203.418 - 1.040*kVp Nodule 13 7mm 270.9 ± 118.0 †HU = 537.984 - 2.135*kVp †SD = 367.723 - 0.420*mAs - 1.987*kVp Nodule 14 7mm 308.1 ± 52.2 †HU = 570.575 - 2.130*kVp †SD = 212.413 - 0.358*mAs - 1.237*kVp CTA ; CT attenuation of nodule, SD ; standard deviation of CT attenuation
Table 6. Linear regression analysis of CT attenuation in 64-detector-row CT scanner
Size CTA on Standard-Dose (Mean±SD)
Linear Regression of Mean CTA Linear Regression of SD
Nodule 1 10mm 109.4 ± 35.8 HU = 88.373 + 0.191*kVp †SD = 192.953 - 0.573*mAs – 0.961*kVp Nodule 2 10mm 174.5 ± 26.9 HU = 189.521 – 0.084*kVp †SD = 166.211 – 0.433*mAs – 0.934*kVp Nodule 3 10mm 203.3 ± 24.1 HU = 214.827 – 0.132*kVp †SD = 141.053 - 0.374*mAs – 0.716*kVp Nodule 4 10mm 233.6 ± 26.0 †HU = 308.745 - 0.645*kVp †SD = 186.312 - 0.430*mAs - 1.047*kVp Nodule 5 10mm 307.7 ± 56.9 †HU = 486.568 – 1.566*kVp †SD = 143.577 – 0.658*kVp Nodule 6 10mm 320.8 ± 72.3 †HU = 556.703 – 2.031*kVp †SD = 198.653 – 0.944*kVp Nodule 7 10mm 402.7 ± 64.9 †HU = 688.873 – 2.420*kVp †SD = 240.656 - 1.166*kVp Nodule 8 7mm 123.0 ± 38.2 †HU = 93.060 - 0.346*kVp †SD = 208.883 - 0.564*mAs - 1.056*kVp Nodule 9 7mm 183.2 ± 32.3 †HU = 268.898 - 0.655*kVp †SD = 214.888 - 0.541*mAs - 1.189*kVp Nodule 10 7mm 199.2 ± 29.2 †HU = 270.746 - 0.622*kVp †SD = 159.112 - 0.442*mAs – 0.843*kVp Nodule 11 7mm 248.9 ± 24.1 †HU = 385.247 – 1.116*kVp †SD = 213.558 - 0.550*mAs - 1.260*kVp Nodule 12 7mm 288.3 ± 30.8 †HU = 466.927 – 1.536*kVp †SD = 153.104 - 0.294*mAs – 0.801*kVp Nodule 13 7mm 303.6 ± 95.8 †HU = 535.588 – 1.849*kVp †SD = 282.138 - 1.499*kVp Nodule 14 7mm 349.9 ± 53.7 †HU = 655.855 – 2.568*kVp †SD = 190.959 - 1.090*kVp CTA ; CT attenuation of nodule, SD ; standard deviation of CT attenuation
17 B. Visual Assessment and Interobserver Correlation
Accuracies of nodule grading by visual assessment of each imaging protocol
(kVp/mAs: 120/100, 120/40, 120/20, 100/20, 80/20, and 80/10) were 71.4%, 78.6%, 92.9%,
85.7%, 71.4%, 71.4% in observer 1 and 92.9%, 85.7%, 92.9%, 92.9%, 92.9%, 100% in
observer 2. Mean accuracy were 78.6% and 92.8% in observer 1 and observer 2. The
accuracy in five low-dose protocols were not significantly different with the accuracy in
standard-dose protocol in each observer. Sensitivity and specificity of detecting hyperdense
nodules more than 200 HU were not either significantly different in relation with variation of
tube voltage and current. The overall accuracy between two nodule sizes were not
significantly different in each observers. In the inter-observer agreement of nodule grading,
moderate agreement was shown in three protocols (120 kVp/40 mAs, 120 kVp/20 mAs, 100
kVp/20 mAs) with statistical significance (p<0.05). Assessment in other three protocols
18
Table 7. Five-point grading for discrimination of hyperdense nodules in each observers Nodule Grading
120kVp/100mAs 120kVp/40mAs 120kVp/20mAs 100kVp/20mAs 80kVp/20mAs 80kVp/10mAs Mean HU
of nodules Observer 1 Observer 2 Observer 1 Observer 2 Observer 1 Observer 2 Observer 1 Observer 2 Observer 1 Observer 2 Observer 1 Observer 2
Nodule 1 82.4 2 1 1 1 1 1 2 2 2 1 2 1 Nodule 2 144.4 3 1 3 2 2 2 3 2 4 2 3 2 Nodule 3 171.5 5 2 3 2 2 2 4 2 4 3 3 2 Nodule 4 202.8 5 4 4 4 3 3 4 3 4 3 4 3 Nodule 5 250.5 5 4 4 3 4 3 4 4 5 4 4 3 Nodule 6 282.9 4 4 4 4 2 4 5 3 4 4 5 4 Nodule 7 316.3 5 5 5 5 4 5 5 5 5 5 5 5 Nodule 8 98.8 2 1 1 1 1 1 1 1 1 1 1 1 Nodule 9 148.5 4 2 2 2 2 2 2 2 3 2 3 2 Nodule10 169.2 3 3 3 3 2 3 2 3 3 2 3 2 Nodule11 216.8 4 3 3 2 3 3 4 3 4 3 4 3 Nodule12 251.4 4 5 5 5 4 4 5 5 4 5 4 5 Nodule13 270.9 5 5 4 5 4 4 5 5 5 5 4 4 Nodule14 308.1 4 5 5 5 4 5 5 5 5 4 5 4
19
Table 8. Accuracy, sensitivity, specificity in discrimination of hyperdense nodule and inter-observer correlation of nodule grading between each readers
Tube Parameter (kVp/mAs) Average of SD of Nodules Reader 1 Reader 2 Kappa of Nodule Grading Accuracy Sensitivity Specificity Accuracy Sensitivity Specificity
Nodule size 7mm 10mm Overall Overall Overall 7mm 10mm Overall Overall Overall
120/100 44.9 HU 71.4% 71.4% 71.4% 100% 33.3% 85.7% 100% 92.9% 100% 83.3% 0.085 120/40 53.5 HU 85.7% 71.4% ‡78.6% 100% 50% 71.4% 100% ‡85.7% 87.5% 83.3% †0.563 120/20 65.2 HU 100% 85.7% ‡92.9% 83.3% 100% 85.7% 100% ‡92.9% 100% 83.3% †0.545 100/20 74.9 HU 100% 71.4% ‡85.7% 100% 66.7% 85.7% 100% ‡92.9% 100% 83.3% †0.458 80/20 106.1 HU 71.4% 71.4% ‡71.4% 100% 33.3% 100% 85.7% ‡92.9% 100% 83.3% 0.097 80/10 138.8 HU 71.4% 71.4% ‡71.4% 100% 33.3% 100% 100% ‡100% 100% 100% 0.019 † : Statistically significant (p < 0.05)
IV. DISCUSSION
Low-dose chest CT was introduced into lung cancer screening in 1998 in Japan,
for the first time21. Since then, many reports have been published about the clinical implication of low-dose chest CT for screening with long debate about the worth of
low-dose chest CT22-25. The effectiveness of the low dose-chest CT for lung cancer screening was proved in 2011 by the results of the National Lung Screening Trial
(NLST), which was prospective and randomized clinical trial of high risk subjects2. The study concluded that screening with low-dose CT resulted in reducing the lung
cancer mortality, while that with conventional chest radiograph did not. Yi et al. also
reported better detection of lung cancer and higher survival rate in patients with lung
cancer in non-high risk subjects of Asian population1. Nevertheless, it remains on the debates, such as optimal radiation dose, frequency of screening and low positive
predictive value26, 27.
Radiation exposure is one of the main problems of the CT examination. The
average radiation dose of CT scan used in the NLST was 1.5mSv which equates to
the carcinogenic effect related with the amount of radiation used for low-dose chest
CT would be very small, it cannot be totally negligible28, 29. Brenner reported that a single low-dose CT scan has a fairly low risk (<0.06%) for radiation-induced lung
cancer, but the risk can be increased by early screening (1.5-5% increase in high-risk
group)29. For further reduction of radiation dose, ultralow-dose chest CT began to be used for cancer screenig, however, its clinical effectiveness is yet to be determined.
Image noise in the CT scan is mainly caused by quantum noise which
significantly increases in low-dose setting of CT imaging30. Although the reduction of radiation dose decreases radiation-related hazard, image quality is also degraded.
Poor image quality has a bad effect on the detection and characterization of lung
nodule. Many reports proposed that an appropriate tube current and tube voltage
should be used in the setting of low-dose chest CT screening, for maintaining
adequate diagnostic imaging quality. However, proper radiation dose is still under
debate. Image noise is defined as the standard deviation in a region of interest. In our
study, standard deviation of CT attenuation of the nodules increased as the tube
current and voltage decreased (Fig. 3). Post-processing technique of image
CT scan. Iterative reconstruction technique is a recently introduced technique that
has become clinically applicable because increased computing power enables fast
image reconstruction. Many reports have shown the benefit of iterative
reconstruction for improving the image quality of low-dose chest CT5, 11-15. SAFIRE and iDose4 reconstruction algorithms were used in our study.
Several features of CT examination suggest benignity of lung nodule. One of
the features is the CT attenuation of lung nodule. Nodules with calcification of
diffuse, central, popcorn-shaped, or laminar types are generally considered benign.
CT densitometry has been investigated for determining a certain level of nodule
attenuation as a threshold for benignity. Proto et al. reported that nodules with an
attenuation above 200 HU can be considered as benign16. Siegelman et al suggested 164 HU as a threshold for discriminating benign from malignant nodules18. Erasmus et al. suggested that 200 HU of attenuation value is advocated by many as a good
discriminator between calcified and non-calcified nodules31.
Our study was designated to investigate for diagnostic accuracy of hyperdense
nodule over 200 HU of CT attenuation in the various settings of low-dose chest CT
deviation of CT attenuation increased showing negative linear correlation,
representing increased image noise on low dose setting. In protocols with low
voltage and low current combination (80 kVp / 20 mA, or 80 kVp / 15 mA) standard
deviation of nodule attenuation increased in more than 3 folds comparing with those
in standard dose protocol. These findings suggest a high degree of image noise in
low voltage and low current setting, that could affect the visual assessment of nodule
density. Although the mean attenuation of nodule was less affected by decreased tube
voltage and current, nodules with attenuation range of 140-200 HU on standard dose
setting could manifest as hyperdense nodules with a mean density above 200 HU on
low voltage and low current setting especially using 80 kVp/10 mA. This finding
suggests that the same attenuation criteria could not be used for hyperdense nodule
on CT densitometry using low voltage and low current setting even though iterative
reconstruction is used. The results of this study may be used as a guide for an
adjustment of those criteria when ultralow dose CT is used for nodule densitometry.
We performed visual assessment of phantom nodules using six protocols of CT
images obtained with a standard-dose and five low-dose scanning parameters.
discrimination of hyperdense nodule over 200HU showed 78.6% in observer 1 and
92.8% in observer 2 with mean values. A difference of accuracy between observers
might represent the subjectivity in visual assessment of non-calcified hyperdense
lung nodule. Two nodules (nodule 9 and 10) showed remarkable increase of mean
CT attenuation over 200HU in the lowest radiation-dose setting (80kVp/10mAs).
These nodules can be considered hyperdense nodules just in the lowest-dose CT scan
(Fig. 4 and 5). But there was no significant difference of accuracy between
standard-dose and low-standard-dose settings in each reader. This result suggest that the low-standard-dose chest
CT including ultra-low-dose setting maintains the diagnostic accuracy in evaluating
hyperdense nodule, though alteration of CT attenuation is increased. Several reports
showed that subjective image quality does not reveal significant difference in
low-dose chest CT using iterative reconstruction comparing with standard-low-dose CT using
conventional FBP32, 33. Our result also might be affected by iterative reconstruction technique. Inter-observer agreement of nodule grading showed moderate agreement
in three protocols (120 kVp/40 mAs, 120 kVp/20 mAs, 100 kVp/20 mAs) and poor
aggrement in relatively lower radiation-dose groups (80 kVp/20 mAs, 80 kVp/10
influence in perception of nodule attenuation, but it does not significantly disturb a
discrimination of hyperdense nodule when the experienced readers are adapted to the
image noise of ultra-low-dose setting.
Our study has several limitations. First, there was an inherent limitation of
phantom nodule. All phantom nodules used in this study were made manually and
composed of mixture with polyvinyl alcohol, calcium carbonate, and 3% solution of
borax. These nodules does not show a complete internal homogeneity. Internal
inhomogeneity of the nodules may cause an exaggeration of CT attenuation in
perception. Second, visual assessment of phantom nodules in our study was
subjective method and performed by only two readers training in radiology.
Discrimination of hyperdense nodule without direct measurement of ROI may
require an appropriate experience. Third, we could not suggest exact radiaton dose
criteria. Even though low-dose CT scans of our study showed comparable accuracy
compared with standard-dose CT scan in visual assessment, actual CT attenuation of
some nodules showed considerable alteration over 200 HU in low-dose setting.
Finally, the number of nodules and the covered range of attenuation were relatively
Figure 3. CT images of nodule 9 in various tube parameters obtained using 128-detector-row scanner. Note increasing image noise with low tube current. (Window width/level = 350/40)
(A)120kVp/100mAs (B)120kVp/40mAs (C)120kVp/20mAs (D) 100kVp/20mAs (E) 80kVp/20mAs (F) 80kVp/10mAs
Figure 4. Floating bar diagram showing mean values (midline of the boxes) and stadard deviations (a half of height in the boxes) of the nodule 9 in 128-detector-row CT images. Note markedly increasing standard deviation of attenuation on low mAs images.
Figure 5. Floating bar diagram showing mean values (midline of the boxes) and stadard deviations (a half of height in the boxes) of the nodule 10 in 128-detector-row CT images
V. CONCLUSION
In conclusion, our study showed a high degree of attenuation change of
nodules in low voltage and low current setting that suggests the need for an
adjustment of attenuation criteria for determining hyperdense nodule by CT
densitometry, and low-dose chest CT maintains the diagnostic accuracy in visual
REFERENCE
1. Yi CA, Lee KS, Shin MH, et al. Low-dose CT screening in an Asian population with diverse risk for lung cancer: A retrospective cohort study. Eur Radiol 2015;25:2335-45. 2. National Lung Screening Trial Research T, Aberle DR, Adams AM, et al. Reduced lung-cancer mortality with low-dose computed tomographic screening. N Engl J Med 2011;365:395-409.
3. Jaklitsch MT, Jacobson FL, Austin JH, et al. The American Association for Thoracic Surgery guidelines for lung cancer screening using low-dose computed tomography scans for lung cancer survivors and other high-risk groups. J Thorac Cardiovasc Surg 2012;144:33-8.
4. Saghir Z, Dirksen A, Ashraf H, et al. CT screening for lung cancer brings forward early disease. The randomised Danish Lung Cancer Screening Trial: status after five annual screening rounds with low-dose CT. Thorax 2012;67:296-301.
5. Christe A, Charimo-Torrente J, Roychoudhury K, et al. Accuracy of low-dose computed tomography (CT) for detecting and characterizing the most common CT-patterns of pulmonary disease. Eur J Radiol 2013;82:e142-50.
6. Das M, Muhlenbruch G, Heinen S, et al. Performance evaluation of a computer-aided detection algorithm for solid pulmonary nodules in low-dose and standard-dose MDCT chest examinations and its influence on radiologists. Br J Radiol 2008;81:841-7. 7. Michel JL, Reynier C, Avy G, et al. [An assessment of low-dose high resolution CT in the detection of benign asbestos-related pleural abnormalities]. J Radiol 2001;82:922-3. 8. Paul NS, Siewerdsen JH, Patsios D, et al. Investigating the low-dose limits of multidetector CT in lung nodule surveillance. Med Phys 2007;34:3587-95.
9. Yamada T, Ono S, Tsuboi M, et al. Low-dose CT of the thorax in cancer follow-up. Eur J Radiol 2004;51:169-74.
10. Zompatori M, Fasano L, Mazzoli M, et al. Spiral CT evaluation of pulmonary emphysema using a low-dose technique. Radiol Med 2002;104:13-24.
11. Willemink MJ, Leiner T, de Jong PA, et al. Iterative reconstruction techniques for computed tomography part 2: initial results in dose reduction and image quality. Eur Radiol 2013;23:1632-42.
12. Baumueller S, Winklehner A, Karlo C, et al. Low-dose CT of the lung: potential value of iterative reconstructions. Eur Radiol 2012;22:2597-606.
13. Xu Y, He W, Chen H, et al. Impact of the adaptive statistical iterative reconstruction technique on image quality in ultra-low-dose CT. Clin Radiol 2013;68:902-8. 14. Hwang HJ, Seo JB, Lee JS, et al. Radiation dose reduction of chest CT with iterative reconstruction in image space - Part I: studies on image quality using dual source CT. Korean J Radiol 2012;13:711-9.
15. Pontana F, Pagniez J, Flohr T, et al. Chest computed tomography using iterative reconstruction vs filtered back projection (Part 1): Evaluation of image noise reduction in 32 patients. Eur Radiol 2011;21:627-35.
16. Proto AV, Thomas SR. Pulmonary nodules studied by computed tomography. Radiology 1985;156:149-53.
17. Khan AN, Al-Jahdali HH, Irion KL, et al. Solitary pulmonary nodule: A diagnostic algorithm in the light of current imaging technique. Avicenna J Med 2011;1:39-51.
18. Siegelman SS, Zerhouni EA, Leo FP, et al. CT of the solitary pulmonary nodule. AJR Am J Roentgenol 1980;135:1-13.
19. Kim Y, Kim YK, Lee BE, et al. Ultra-Low-Dose CT of the Thorax Using Iterative Reconstruction: Evaluation of Image Quality and Radiation Dose Reduction. AJR Am J Roentgenol 2015;204:1197-202.
20. Kim H, Park CM, Chae HD, et al. Impact of radiation dose and iterative reconstruction on pulmonary nodule measurements at chest CT: a phantom study. Diagn Interv Radiol 2015;21:459-65.
21. Sone S, Takashima S, Li F, et al. Mass screening for lung cancer with mobile spiral computed tomography scanner. Lancet 1998;351:1242-5.
22. Bach PB. Reduced lung-cancer mortality with CT screening. N Engl J Med 2011;365:2036; author reply 2037-8.
23. Henschke CI. Re: inconsistencies in findings from the early lung cancer action project studies of lung cancer screening. J Natl Cancer Inst 2012;104:254-5; author reply 255-6.
24. Patz EF, Jr. Lung cancer screening, overdiagnosis bias, and reevaluation of the Mayo Lung Project. J Natl Cancer Inst 2006;98:724-5.
25. International Early Lung Cancer Action Program I, Henschke CI, Yankelevitz DF, et al. Survival of patients with stage I lung cancer detected on CT screening. N Engl J Med 2006;355:1763-71.
26. Ruano-Ravina A, Perez Rios M, Fernandez-Villar A. Lung cancer screening with low-dose computed tomography after the National Lung Screening Trial. The debate is still open. Arch Bronconeumol 2013;49:158-65.
27. Marshall HM, Bowman RV, Yang IA, et al. Screening for lung cancer with low-dose computed tomography: a review of current status. J Thorac Dis 2013;5 Suppl 5:S524-39.
28. Larke FJ, Kruger RL, Cagnon CH, et al. Estimated radiation dose associated with low-dose chest CT of average-size participants in the National Lung Screening Trial. AJR Am J Roentgenol 2011;197:1165-9.
29. Brenner DJ. Radiation risks potentially associated with low-dose CT screening of adult smokers for lung cancer. Radiology 2004;231:440-5.
30. Yu L, Liu X, Leng S, et al. Radiation dose reduction in computed tomography: techniques and future perspective. Imaging Med 2009;1:65-84.
31. Erasmus JJ, Connolly JE, McAdams HP, et al. Solitary pulmonary nodules: Part I. Morphologic evaluation for differentiation of benign and malignant lesions. Radiographics 2000;20:43-58.
32. Yanagawa M, Gyobu T, Leung AN, et al. Ultra-low-dose CT of the lung: effect of iterative reconstruction techniques on image quality. Acad Radiol 2014;21:695-703.
33. Vardhanabhuti V, Loader RJ, Mitchell GR, et al. Image quality assessment of standard- and low-dose chest CT using filtered back projection, adaptive statistical iterative reconstruction, and novel model-based iterative reconstruction algorithms. AJR Am J Roentgenol 2013;200:545-52.
- 국문요약 -
저선량 CT에서 다양한 촬영기법에 따른 폐결절의 석회화 발견
과 음영도 변화의 팬텀 연구
아주대학교 대학원 의학과 조재용 (지도교수 : 박경주) 목적: 흉부 저선량 CT에서 다양한 선량에 따른 폐결절의 음영도 변화와 미만성 석회화의 육안적 진단정확도를 표준선량 CT와 비교하여 알아보고 자 하였다. 대상 및 방법: 인공 폐결절을 삽입한 흉부 팬텀을 64-detector-row CT 와 128-detector-row CT 으로 촬영하였으며 표준선량과 다양한 관전 압, 관전류의 저선량을 통해 영상을 획득하였고 영상 재구성에 Iterative reconstruction 기법이 사용되었다. 인공폐결절의 평균 CT attenuation과 image noise를 표준선량과 저선량 CT영상에서 측정하였다. 표준선량과 5개의 저선량 CT영상에서 인공폐결절의 미만성 석회화에 대하여 두명의
관찰자가 평가하여 그 진단정확도를 비교하였다.
결과: 인공폐결절의 평균 CT attenuation과 image noise는 관전압과 관
전류가 감소할수록 증가하였다. 표준선량 CT영상에서 200HU 미만의 CT attenuation을 가지는 일부 폐결절들은 저선량 CT영상에서 200HU 보다 큰 CT attenuation을 보였다. 인공폐결절의 미만성 석회화에 대한 육안적 진단정확도는 표준선량 CT영상과 저선량 CT영상에서 차이를 보이지 않 았다. 저선량 CT영상에 비해 표준선량 CT영상에서 관찰자간 일치도가 높았다. 결론: 저선량 CT영상에서 표준선량 CT영상에 비하여 image noise가 증 가함에도 불구하고 인공폐결절의 미만성 석회화에 대한 육안적 진단 정확 도가 유지됨을 확인하였다.