The latent classes and factors affecting quality of life among South Koreans with metabolic syndrome †
Yoonju Lee 1 · Yi Kyung Ha 2 · Young-Suk Cho 3 · Heejin Kim 4
124 College of Nursing, Pusan National University
3 Department of Statistics, Pusan National University
Received 3 November 2017, revised 30 November 2017, accepted 5 December 2017
Abstract
The purpose of this study is to identify latent classes involving the health behaviors of patients with metabolic syndrome and to examine the effects of demographic char- acteristics and health- related lifestyles on their quality of life. The data was sourced from the database of the 2013 Korea health panel survey. Health behavior variables (smoking, drinking, body mass index, and physical activities) were dichotomously re- categorized for latent class analysis. Two latent classes of metabolic syndrome, named
‘low physical actor’ and ‘low physical actor with smoking and alcohol’ were identified.
Both latent classes showed statistically significant differences in demographic charac- teristics and EQ-5D index. Additionally, there were differences in the factors affecting quality of life between latent classes. This study’s findings suggest that a tailored inter- vention based on features of the latent classes is required to improve the lifestyle and quality of life of metabolic syndrome patients.
Keywords: Health behavior, latent class analysis, metabolic syndrome, quality of life.
1. Introduction
Metabolic syndrome (MS) has been widely defined as a combination of metabolic risk factors (Grundy et al., 2005; Alberti et al., 2005). This condition has been found to increase the risk of diabetes and the incidence of cerebro-cardiovascular disease by two to five times, and even overall mortality rate by 1.6 times (Mottillo et al., 2010). It is estimated that over 20% of the global adult population has MS (Aguilar et al., 2015), and in Korea, its prevalence has been steadily increasing, from 24.9% in 1998 to 33.0% in 2014 (Jung, 2016).
Consequently, it is clear that professional and systematic management of risk factors for MS is required.
† This work was supported by the Pusan National University Research & Development Fund [No:
20170390001].
1
Associate professor, College of Nursing, Pusan National University, Yangsan 50612, Korea.
2
Assistant professor, College of Nursing, Pusan National University, Yangsan 50612, Korea.
3
Professor, Department of Statistics, Pusan National University, Busan 46241, Korea.
4
Corresponding author: Instructor, College of Nursing, Pusan National University, Yangsan 50612, Ko-
rea. E-mail: [email protected]
Risk factors for MS include physiological factors (age, race); genetic factors; socio-economic factors (occupation, income, and education level); lifestyle factors (levels of smoking, drink- ing, exercise, and obesity, and dietary habits); and emotional factors (levels of sleep, stress, and depression) (Tran, et al., 2017; Han et al., 2013). In particular, the national cholesterol education program-adult treatment panel III (NCEP-ATP III) and the international dia- betes federation (IDF) have proposed that therapeutic lifestyle improvements are the most important and cost-effective method of alleviating the incidence of cardiovascular compli- cations in MS patients (Grundy et al., 2005). Recently, a variety of lifestyle intervention studies have been conducted in patients with MS (Wang et al., 2017; Saboya et al., 2017).
However, in one meta-analysis of intervention studies concerning lifestyle modification, only eight of the 28 studies used interventions that were found effective in regard to improving the risk factors of MS after one year (Bassi et al., 2014). Thus, there is still insufficient evidence concerning the effectiveness for lifestyle-improvement programs.
Health related- quality of life (HR-QoL) of MS patients is lower than that of non-MS individuals (Ford and Li, 2008), and lifestyle has been found to be a predictor of HR- QoL in MS (Han et al., 2013). It is thought to be due to MS patients have various forms of health-related lifestyles, and complex symptoms of MS and its tendency to become a chronic condition can significantly affect patients’ HR-QoL. However, an insufficient number of studies have been conducted concerning the factors that directly impact the HR-QoL of MS. Furthermore, the effect of lifestyle modification on HR-QoL with MS has also shown inconsistent results, which are limited in terms of the physical QoL (Wang et al., 2017;
Saboya et al., 2017). Consider that, it should be possible to improve HR-QoL by applying tailored intervention (Niar et al., 2007) depending on lifestyle patterns of MS. So, classifying the MS population according to lifestyle would represent the first step in developing a tailored health-promotion program.
Latent class analysis (LCA) is used to define groups of subtypes of cases and involves a subject-centered approach that focuses on the observed relationships between individuals (Muthen and Muthen, 2006). In most previous studies involving LCA of MS, physiological indicators such as waist circumference, blood pressure, body mass index (BMI), triglyceride, fasting glucose, and serum insulin have been considered (Boyko et al., 2011; Arguelles et al., 2015; Abbasi-Ghahramanloo et al., 2016); in contrast, only one study has conducted LCA of the physical activity types of MS patients (Metzger et al., 2010). MS acts as a marker of cardiovascular disease, metabolic disease, and some cancers; therefore, the goal of treatment is to prevent complications and to reduce mortality through lifestyle modification, rather than to treat MS itself (Shim et al., 2015). However, previous studies have not produced sufficient information of the factors that should be considered when implementing a program to improve the HR-QoL of MS patients through lifestyle-improvement interventions.
For this, the present study aims to identify the health-related lifestyle patterns of Korean
MS patients and to identify factors affecting the HR-QoL of latent classes to provide evidence
that can help design intervention programs.
2. Methods
2.1. Study population
The Korea health panel (KHP) is an investigation that has been conducted by the Ko- rea institute for health and social affairs and the national health insurance service since 2005. The objectives of KHP are to produce representative and reliable data concerning the actual condition of citizens’ healthcare use, levels of healthcare expenditure, health levels, and health behaviors. KHP extracts samples through a stratified, multistage, probability sampling method based on geographic area. In the 2013 survey, the total number of areas surveyed was approximately 350 neighborhoods, and the sample comprised approximately 5,200 households across the nation (Korea Institute for Health and Social Affairs, 2015).
As physiological indicators such as abdominal obesity, blood pressure, and fasting glucose were not included in the KHP’s survey data, in this study we set the selection criteria for MS patients as follows: subjects diagnosed with all three of hypertension, diabetes, and hyperlipidemia (or hyper-cholesterolemia). Using this method, of the 11,300 adult subjects aged 18 years or older who responded to the survey in 2013, 261 were selected for our analysis.
Of these, 12 subjects who had missing values for the analysis were excluded, leaving 249 subjects for the final analysis.
2.2. Variables for latent class analysis
For our LCA analysis, we specifically selected as variables smoking, drinking, physical activity, and BMI, which were found to be risk factors of MS in previous studies (Wang et al., 2017); these variables were then dichotomously re-categorized (smoking, “yes” = 1,
“no” = 2; drinking, “two or more per a month” = 1, “one or less per a month” = 2; physical activity, which was measured by asking the participants if they engaged in over 20 minutes of heavy exercise over three times a week or over 30 minutes of moderate exercise over five times a week, “no” = 1, “yes” = 2; BMI, 25kg/m 2 or more = 1, less than 25kg/m 2 = 2).
2.3. Dependent variable
KHP used the Euro quality of life questionnaire 5-dimensional classification (EQ-5D), which is a standardized instrument for measuring HR-QoL (EuroQol Group, 1990). The EQ-5D consists of multiple-choice questions that can be answered using a three-point scale ranging from 1 (“not affected”) to 3 (“seriously affected”) to determine current health status;
this is applied to five items: mobility, self-care, usual activities, pain/discomfort, and anxi- ety/depression. In this study we used the EQ-5D Index, which was calculated by weighting each item (Lee et al., 2009). The variable was dichotomously re-categorized (9.0 = “high”;
less than 9.0 = “low”) for complex sample simple logistic regression.
2.4. Predictors
After reviewing results of previous studies concerning the prevalence of MS and the HR-
QoL of patients with MS, we chose socio-demographic characteristics (gender, age, marital
status, education level, income level, household composition, employment status, etc.) and
health-related characteristics (experience receiving medical treatment, depression, suicidal
impulses, presence of disability, sleeping time, and subjective health status) (Tran et al.,
2017; Han et al., 2013; Wang et al., 2017; Saboya et al., 2017, Oh, 2017). These variables were re-categorized, so the number of categories did not exceed five.
2.5. Statistical analysis
The descriptive analyses(unweighted n, weighted %, mean, standard error) of the char- acteristics of participants was conducted by using complex sample analysis. Latent class regression model analysis was conducted, with five covariates associated with MS (age, gen- der, marital status, education level, and annual gross household income) (Arguelles et al., 2015). Specifically, we assessed the goodness-of-fit of four consecutive models that had one to four clusters each. To determine the optimal number of latent classes, information-based fit indices, including BIC (Bayesian information criterion), AIC (Akaike information criterion), and CAIC (consistent Akaike information criterion), were used, with lower values indicating a good-fitting latent class model (Nylund et al., 2007). Of these, BIC is the most commonly used index and is said to be the most reliable indicator for determining the number of classes (Nylund et al., 2007). For the tests of independence between latent classes, t-test, pearson χ 2 -test for complex samples was conducted. The adjusted F was presented as a result of pearson χ 2 -test for complex samples, which was a variant of the second-order Rao-Scott adjusted chi-square statistic. And complex samples simple logistic regression was conducted for factors related to the each latent class’s HR-QoL. The value of B, SE, p, Exp(B), R 2 for each variable was presented as results of complex samples simple logistic regression. For all analysis, SPSS 23.0 with the R poLCA package was used, and the statistical significance level for all tests was p < .05.
3. Results
3.1. Characteristics of subjects
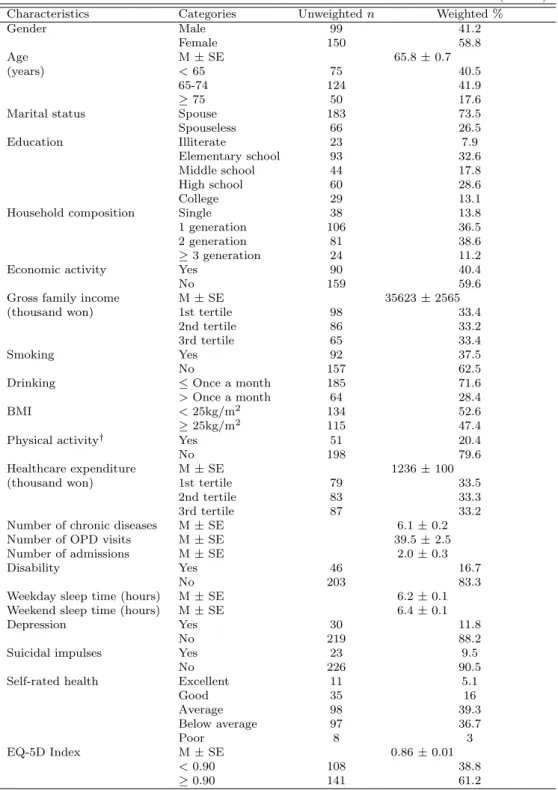
Of the sample, 58.8% were female, the mean age was 65.8 years, and 73.5% had a spouse.
In regard to education, illiterate or elementary school graduation level (40.5%) was the most populated category. The most common household composition was two generations of the family living together (38.6%). In all, 59.6% of respondents were not economically active, and the average annual gross family income was approximately 35.62 million won. In regard to lifestyle, 62.5% of the sample were not smoking, and 71.6% stated that they drank less than once a month. Further, 52.6% had a BMI of less than 25 kg/m 2 , and 20.4% of subjects performed physical activity.
The mean annual healthcare expenditure was approximately 1.2 million won, and the mean number of chronic diseases was 6.1. Further, 83.3% had no disability, and average sleeping time was 6.2 hours per weekday, and 6.4 hours on the weekends. Additionally, 11.8% of the subjects had been continuously depressed for over two weeks in the past year, while 9.5%
had experienced suicidal impulses in the past year. In terms of subjective health status, many respondents reported “average” (39.3%) (Table 3.1).
3.2. Latent class model
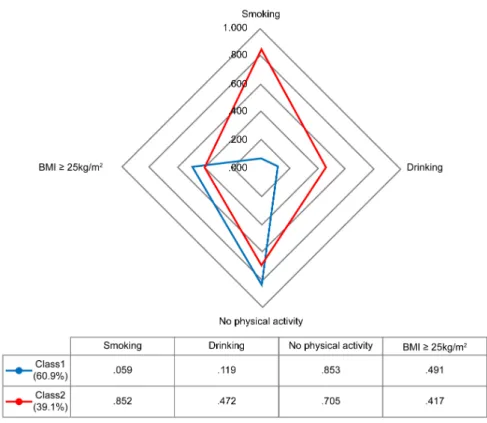
The best-fitting model was identified as a two-class model (Table 3.2). Of the sample,
60.9% were in Class 1 and 39.1% were in Class 2. Members of Class 1 had a very low
Table 3.1 Characteristics of participants
(N=249)
Characteristics Categories Unweighted n Weighted %
Gender Male 99 41.2
Female 150 58.8
Age M ± SE 65.8 ± 0.7
(years) < 65 75 40.5
65-74 124 41.9
≥ 75 50 17.6
Marital status Spouse 183 73.5
Spouseless 66 26.5
Education Illiterate 23 7.9
Elementary school 93 32.6
Middle school 44 17.8
High school 60 28.6
College 29 13.1
Household composition Single 38 13.8
1 generation 106 36.5
2 generation 81 38.6
≥ 3 generation 24 11.2
Economic activity Yes 90 40.4
No 159 59.6
Gross family income M ± SE 35623 ± 2565
(thousand won) 1st tertile 98 33.4
2nd tertile 86 33.2
3rd tertile 65 33.4
Smoking Yes 92 37.5
No 157 62.5
Drinking ≤ Once a month 185 71.6
> Once a month 64 28.4
BMI < 25kg/m
2134 52.6
≥ 25kg/m
2115 47.4
Physical activity
†Yes 51 20.4
No 198 79.6
Healthcare expenditure M ± SE 1236 ± 100
(thousand won) 1st tertile 79 33.5
2nd tertile 83 33.3
3rd tertile 87 33.2
Number of chronic diseases M ± SE 6.1 ± 0.2
Number of OPD visits M ± SE 39.5 ± 2.5
Number of admissions M ± SE 2.0 ± 0.3
Disability Yes 46 16.7
No 203 83.3
Weekday sleep time (hours) M ± SE 6.2 ± 0.1
Weekend sleep time (hours) M ± SE 6.4 ± 0.1
Depression Yes 30 11.8
No 219 88.2
Suicidal impulses Yes 23 9.5
No 226 90.5
Self-rated health Excellent 11 5.1
Good 35 16
Average 98 39.3
Below average 97 36.7
Poor 8 3
EQ-5D Index M ± SE 0.86 ± 0.01
< 0.90 108 38.8
≥ 0.90 141 61.2
M, mean; SE, standard error; OPD, outpatient department
†
Yes: ≥ 20 min of heavy exercise three times a week or ≥ 30 min of moderate exercise five times
a week; No: Less than the above.
probability of smoking (.059) and drinking (.119), but had a high probability of avoiding physical activity (.853); consequently, Class 1 was named ‘low physical actor.’ Meanwhile, Class 2 had a very high probability of smoking (.852) and of avoiding physical activity (.705);
consequently, Class 2 was named ‘low physical actor with smoking and alcohol.’ Finally, the likelihood of a BMI greater than 25 kg/m 2 was similar for both Class 1 (.491) and Class 2 (.417) (Figure 3.2).
Figure 3.1 Latent classes of metabolic syndrome in terms of health-related lifestyle patterns
Table 3.2 Goodness of fit for two to four latent classes
Model AIC BIC Maximum
log likelihood
1-Class 1216.072 1230.142 −604.036
2-Class 1022.790 1072.034 −497.395
3-Class 1032.395 1116.814 −492.197
4-Class 1044.080 1163.674 −488.040
AIC: Akaike information criterion, BIC: Bayesian information criterion
3.3. Differences between latent classes
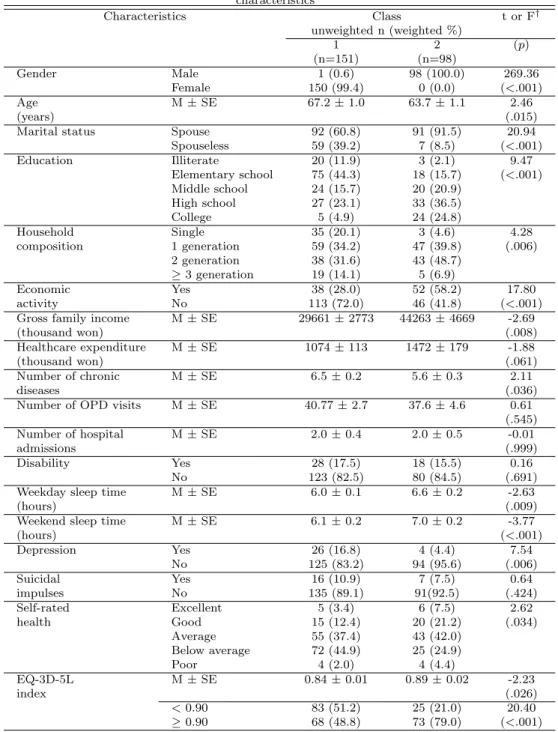
There were significant differences between the two classes in terms of gender (adjusted F = 26936, p < .001), age (t = 2.46, p = .015), marital status (adjusted F = 20.94, p < .001), household composition (adjusted F = 4.28, p = .006), education level (adjusted F = 9.47, p < .001) and economic activity (adjusted F = 17.80, p < .001). In regard to the health-related characteristics, significant differences were found in number of chronic diseases (t = 2.11, p = .036), weekday sleep time (t = −2.63, p = .009), weekend sleep time (t = −3.77, p < .001), depression (t = 7.54, p = 0.06), self-rated health (t = 2.62, p = 0.34) and EQ-5D Index (adjusted F = 20.40, p < .001) (Table 3.3).
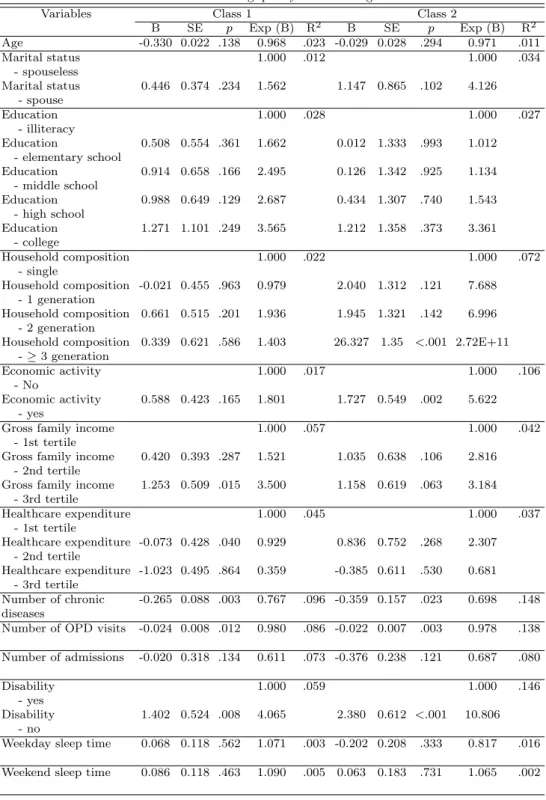
3.4. Factors affecting quality of life
The mean EQ-5D index of the subjects was 0.86, and 61.2% of the sample were found to have a score of 0.9 or higher. Further, there was also a significant difference between the two classes. Number of chronic diseases, number of outpatient department (OPD) visits, disability, depression, and self-rated health were common factors associated with HR-QoL in the two classes; however, only for low physical actor with smoking and alcohol class was HR-QoL affected when three generations of family members lived together (B = 26.327, p < .001, OR = 2.715E + 11), when the respondent was employed (B = 1.727, p = .002, OR = 5.622), or when they had suicidal impulses (B = 2.164, p = .017, OR = 8.704). For the low physical actor with smoking and alcohol class, the likelihood of high QoL was found to be greatly increased in the absence of depression (B = 2.441, p = .043, OR = 11.480) and disability (B = 2.380, p =< .001, OR = 10.806). Meanwhile, for low physical actor class, the odds ratio was highest, at 4.3 times, when suicidal impulses were absent, and was 4.1 times in the absence of disability (Table 3.4).
4. Discussion
This research constitutes the first LCA study of the health-related lifestyles of patients with MS. We explored whether these latent classes differ in regard to socio-demographic characteristics, health-related characteristics, and factors affecting HR-QoL.
The proportion of MS was found to be slightly higher in women. This result is similar to that of other studies, and this is considered to be associated with women experiencing increased abdominal obesity after menopause (Ervin, 2009). The mean age of this study’s sample was 65.8 ± 0.7 years; 40.5% of the subjects were under 65 years of age. It is known that the prevalence of metabolic syndrome increases with age (Aguilar et al., 2015; Jung, 2016;
Tran et al., 2017; Han et al., 2013); however, in a recent cross-sectional study using data from National Health and Nutrition Examination Survey, the mean age of MS subjects was 52.2 (Ford and Li, 2008). This strongly suggests that MS management is important in middle-age or early adulthood. Furthermore, the results of this study showed that approximately 20%
of the sample had a total annual household income of less than 10 million won, which is
far below the minimum living costs stated in 2015 for two-person households (Ministry of
Health and Welfare, 2014). We believe that a major reason for this is the decrease in income
after retirement, given that the mean age of our MS patients was almost 66 years. It can
be suggested that nationwide MS management and support systems be extended to elderly
individuals in low-income brackets.
Table 3.3 Differences between the two latent classes in terms of socio-demographic and health-related characteristics
Characteristics Class t or F
†unweighted n (weighted %)
1 2 (p)
(n=151) (n=98)
Gender Male 1 (0.6) 98 (100.0) 269.36
Female 150 (99.4) 0 (0.0) (<.001)
Age M ± SE 67.2 ± 1.0 63.7 ± 1.1 2.46
(years) (.015)
Marital status Spouse 92 (60.8) 91 (91.5) 20.94
Spouseless 59 (39.2) 7 (8.5) (<.001)
Education Illiterate 20 (11.9) 3 (2.1) 9.47
Elementary school 75 (44.3) 18 (15.7) (<.001) Middle school 24 (15.7) 20 (20.9)
High school 27 (23.1) 33 (36.5)
College 5 (4.9) 24 (24.8)
Household Single 35 (20.1) 3 (4.6) 4.28
composition 1 generation 59 (34.2) 47 (39.8) (.006)
2 generation 38 (31.6) 43 (48.7)
≥ 3 generation 19 (14.1) 5 (6.9)
Economic Yes 38 (28.0) 52 (58.2) 17.80
activity No 113 (72.0) 46 (41.8) (<.001)
Gross family income M ± SE 29661 ± 2773 44263 ± 4669 -2.69
(thousand won) (.008)
Healthcare expenditure M ± SE 1074 ± 113 1472 ± 179 -1.88
(thousand won) (.061)
Number of chronic M ± SE 6.5 ± 0.2 5.6 ± 0.3 2.11
diseases (.036)
Number of OPD visits M ± SE 40.77 ± 2.7 37.6 ± 4.6 0.61
(.545)
Number of hospital M ± SE 2.0 ± 0.4 2.0 ± 0.5 -0.01
admissions (.999)
Disability Yes 28 (17.5) 18 (15.5) 0.16
No 123 (82.5) 80 (84.5) (.691)
Weekday sleep time M ± SE 6.0 ± 0.1 6.6 ± 0.2 -2.63
(hours) (.009)
Weekend sleep time M ± SE 6.1 ± 0.2 7.0 ± 0.2 -3.77
(hours) (<.001)
Depression Yes 26 (16.8) 4 (4.4) 7.54
No 125 (83.2) 94 (95.6) (.006)
Suicidal Yes 16 (10.9) 7 (7.5) 0.64
impulses No 135 (89.1) 91(92.5) (.424)
Self-rated Excellent 5 (3.4) 6 (7.5) 2.62
health Good 15 (12.4) 20 (21.2) (.034)
Average 55 (37.4) 43 (42.0)
Below average 72 (44.9) 25 (24.9)
Poor 4 (2.0) 4 (4.4)
EQ-3D-5L M ± SE 0.84 ± 0.01 0.89 ± 0.02 -2.23
index (.026)
< 0.90 83 (51.2) 25 (21.0) 20.40
≥ 0.90 68 (48.8) 73 (79.0) (<.001)
M: mean, SE: standard error, OPD: outpatient department
†