INTRODUCTION
Identification of patients with high risk for cardiovascular (CV) disease is important to justify more aggressive medical thera-
pies for primary prevention.1,2 The coronary artery calcium score (CACS) has been used to non-invasively evaluate CV risk.3 CACS is correlated with coronary artery plaque burden, and previous studies have demonstrated a relationship be- tween CACS and all-cause mortality independent of other es- tablished risk factors.4,5 However, CACS requires radiation ex- posure, equipment, training, and time, and is poorly reimbursed, thus limiting their routine use in daily practice.
Recently, there has been growing interest in the difference in inter-arm blood pressure (BP), especially because increased dif- ferences in systolic BP (SBP), and also weakly in diastolic BP (DBP), are associated with a greater risk of CV events, and also both all-cause and CV mortality.6-9 Recent studies have also iden- tified a correlation between the difference in inter-arm BP and
Association of Inter-Arm Systolic Blood Pressure Difference with Coronary Atherosclerotic Disease Burden Using Calcium Scoring
Ae-Young Her
1, Kyoung-Im Cho
2, Scot Garg
3, Yong Hoon Kim
1, and Eun-Seok Shin
41Division of Cardiology, Department of Internal Medicine, Kangwon National University School of Medicine, Chuncheon, Korea;
2Division of Cardiology, Department of Internal Medicine, Kosin University Gospel Hospital, Busan, Korea;
3East Lancashire Hospitals NHS Trust, Blackburn, Lancashire, UK;
4Department of Cardiology, Ulsan University Hospital, University of Ulsan College of Medicine, Ulsan, Korea.
Purpose: There are no sufficient data on the correlation between inter-arm blood pressure (BP) difference and coronary athero- sclerosis found using coronary artery calcium score (CACS). We aimed to investigate if the increased difference in inter-arm BP is independently associated with severity of CACS.
Materials and Methods: Patients who had ≥3 cardiovascular risk factors or an intermediate Framingham Risk Score (FRS; ≥10) were enrolled. Inter-arm BP difference was defined as the absolute difference in BP in both arms. Quantitative CACS was mea- sured by using coronary computed tomography angiography with the scoring system.
Results: A total of 261 patients were included in this study. Age (r=0.256, p<0.001), serum creatinine (r=0.139, p=0.030), mean of right arm systolic BP (SBP; r=0.172, p=0.005), mean of left arm SBP (r=0.190, p=0.002), inter-arm SBP difference (r=0.152, p=0.014), and the FRS (r=0.278, p<0.001) showed significant correlation with CACS. The increased inter-arm SBP difference (≥6 mm Hg) was significantly associated with CACS ≥300 [odds ratio (OR) 2.17, 95% confidence interval (CI) 1.12–4.22; p=0.022]. In multivari- able analysis, the inter-arm SBP difference ≥6 mm Hg was also significantly associated with CACS ≥300 after adjusting for clinical risk factors (OR 2.34, 95 % CI 1.06–5.19; p=0.036).
Conclusion: An increased inter-arm SBP difference (≥6 mm Hg) is associated with coronary atherosclerotic disease burden using CACS, and provides additional information for predicting severe coronary calcification, compared to models based on traditional risk factors.
Key Words: Inter-arm blood pressure, difference, coronary artery, calcium score, atherosclerosis
pISSN: 0513-5796 · eISSN: 1976-2437
Received: February 6, 2017 Revised: May 21, 2017 Accepted: May 22, 2017
Corresponding author: Dr. Eun-Seok Shin, Department of Cardiology, Ulsan Uni- versity Hospital, University of Ulsan College of Medicine, 877 Bangeojinsunhwan- do-ro, Dong-gu, Ulsan 44033, Korea.
Tel: 82-52-250-7056, Fax: 82-52-250-7058, E-mail: [email protected]
•The authors have no financial conflicts of interest.
© Copyright: Yonsei University College of Medicine 2017
This is an Open Access article distributed under the terms of the Creative Com- mons Attribution Non-Commercial License (http://creativecommons.org/licenses/
by-nc/4.0) which permits unrestricted non-commercial use, distribution, and repro- duction in any medium, provided the original work is properly cited.
Yonsei Med J 2017 Sep;58(5):954-958 https://doi.org/10.3349/ymj.2017.58.5.954
target organ damage such as left ventricular mass index and ca- rotid or brachial-femoral pulse wave velocities.10,11 However, there are not much data on the relationship between the differ- ence in inter-arm BP and coronary atherosclerotic disease, found by using CACS.
In the present study, therefore, we aimed to investigate wh- ether the increased difference of inter-arm BP was indepen- dently associated with an abnormal CACS. Identification of an association between inter-arm BP difference and CACS may have significant implications for screening patients for athero- sclerotic coronary artery disease (CAD).
MATERIALS AND METHODS
Study population
Included patients had at least 3 CV risk factors or an intermedi- ate Framingham Risk Score (FRS; ≥10), were referred to the hos- pital with chest pain, and underwent evaluation of CAD be- tween March 2012 and August 2014. A total of 261 patients who underwent coronary computed tomography angiography (CTA) at the discretion of their treating physician were included in the analysis. Patients with known CAD, a previous history of re- vascularization, peripheral artery disease, and those with sig- nificant valvular heart disease were excluded from the analy- sis. The study protocol was approved by the Institutional Review Board of Ulsan University Hospital, and is in accordance with the Declaration of Helsinki.
The presence of known CV risk factors, including smoking history, hypertension, diabetes mellitus, and dyslipidemia, were identified through history taking and using medical question- naires. Smoking was classified as never, current, or ex-smoker, with smoking stopped less than 1 year before enrollment. Hy- pertension was diagnosed if patients had SBP ≥140 mm Hg or DBP ≥90 mm Hg, a history of hypertension or were using anti- hypertensive agents. Diabetes mellitus was diagnosed if pa- tients had a fasting plasma glucose level ≥126 mg/dL on 2 sepa- rate days, a history of diabetes mellitus or were using anti- diabetic agents. Dyslipidemia was diagnosed in patients with a history of using cholesterol-lowering medications or who had a fasting serum total cholesterol level ≥240 mg/dL or low- density lipoprotein cholesterol level ≥160 mg/dL. The FRS was used to estimate a 10-year risk of coronary heart disease, de- fined as angina pectoris, recognized or unrecognized myocar- dial infarction, coronary insufficiency, and cardiac death.12 The FRS score included age, gender, total cholesterol, high-density lipoprotein cholesterol, SBP, and use of anti-hypertensive agents as its individual components.
Measurement of blood pressure and inter-arm blood pressure difference
BP was synchronously measured in both arms by a trained nurse using separate cuff hoses in each electronic manometer
(Omron HEM-7001-E; Omron Corp., Tokyo, Japan). The BP was measured 3 times at two-minute intervals in each patient on the day of the examination. Thus, the patients were instructed to sit for 5 minutes on a straight chair with BP cuffs wrapped around both arms before performing the BP measurements.
Inter-arm BP difference was defined as right-arm BP minus left- arm BP. Then, the absolute value of the inter-arm BP differ- ence was calculated.
Coronary artery calcium score using coronary computed tomography angiography
Coronary CTA was performed using a 0.8-mm thickness 256-slice multi-detector CT scanner (Brilliance iCT 256; Phil- ips Medical Systems, Best, the Netherlands).13 Patients with a heart rate >65 bpm were given metoprolol 100 mg to reduce their heart rate down to ≤65 bpm. Scan parameters were as follows:
tube voltage, 120 kVp; tube current, 100 mAs; 220 mm field of view; rotation time, 0.27 s/rotation; reconstructed slice thickness, 0.8-mm; signal acquisition at 80 % of the R-R interval. CACS was measured using the Extended Brilliance Workspace work- station (Philips Medical Systems) after reconstruction. CACS was automatically displayed in color by calcium scoring soft- ware. Quantitative CACS was measured with the scoring system described by Agatston.14 We excluded the patients with 0 of CACS.
Statistical analysis
Continuous variables are presented as mean±standard devia- tion, whereas categorical variables are expressed as absolute values and percentages. The Wilcoxon rank-sum test for inde- pendent samples was used to identify differences between con- tinuous variables that were not normally distributed. Student’s t-test was used to identify differences between normally distrib- uted continuous variables. Differences between categorical variables were evaluated with the Fisher exact test. Bivariate correlation analysis with Spearman correlations was used to evaluate associations between variables. Multivariate logistic regression analysis was used to estimate the odds ratios (ORs) and 95% confidence intervals (CIs) for the CACS and other vari- ables. To evaluate whether inter-arm BP difference provides incremental value in predicting the CACS over traditional risk factors, we computed receiver operating characteristic (ROC) curves, and the DeLong method was then used to identify dif- ferences between ROC curves. All statistical analyses were done using SPSS version 18.0 (SPSS Inc., Chicago, IL, USA), and p<
0.05 was considered significant.
RESULTS
The demographic and clinical characteristics of patients are presented in Table 1. Included patients had a mean age of 60.6±
9.1 years, and 150 patients (57.0 %) were male. The mean value of inter-arm BP difference for SBP/DBP was 5.4/3.3 mm Hg,
the mean value of FRS was 10.2±7.3, and CACS was 169.4±326.6.
Table 2 shows the correlations of various parameters with the degree of CACS: Age (r=0.256, p<0.001), serum creatinine (r=
0.139, p=0.030), mean of right arm SBP (r=0.172, p=0.005), mean of left arm SBP (r=0.190, p=0.002), inter-arm SBP difference (r=0.152, p=0.014), and the FRS (r=0.278, p<0.001) showed a significant correlation with CACS.
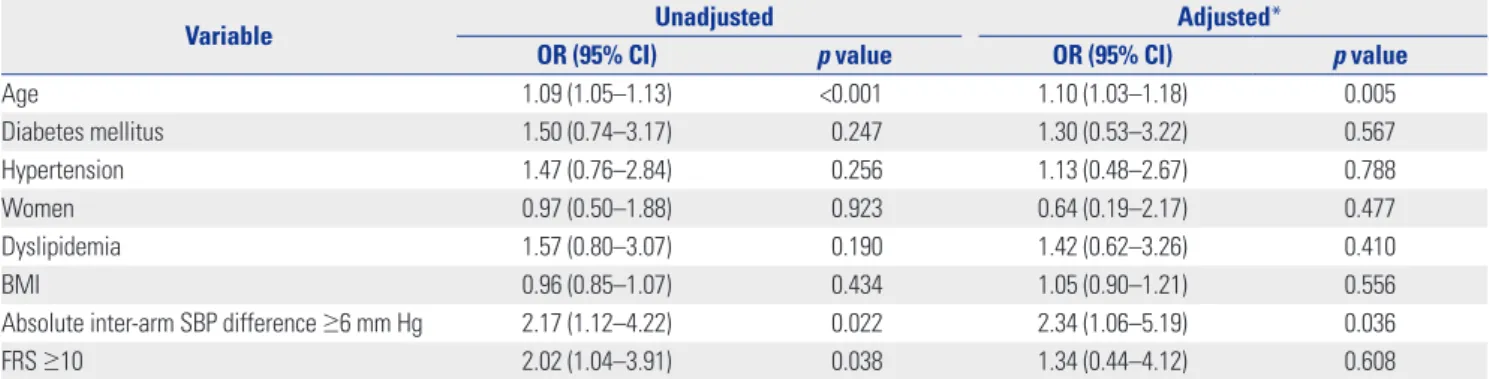
As shown in Table 3, an inter-arm SBP difference ≥6 mm Hg
was significantly associated with a CACS ≥300 (OR 2.17, 95%
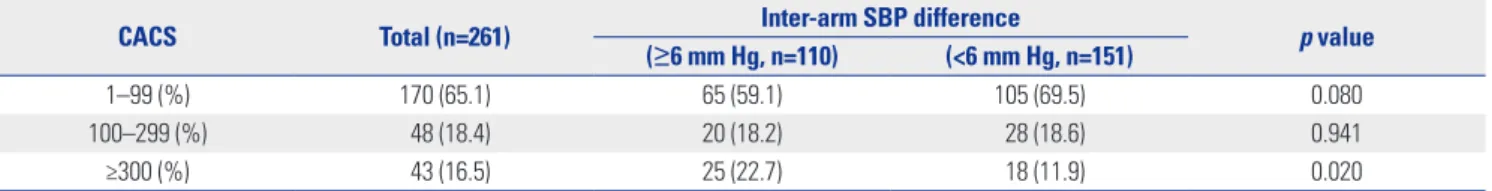
CI 1.12–4.22; p=0.022). This relationship was maintained even after adjustment for covariates including age ≥50 years, gen- der, hypertension, diabetes mellitus, dyslipidemia, body mass index, absolute inter-arm SBP difference, and FRS (OR 2.34, 95% CI 1.06–5.19; p=0.036). Additionally, the frequency of pa- tients with increased inter-arm SBP difference was significantly different between patients stratified by CACS ≥300 (Table 4).
Moreover, when the inter-arm SBP difference was added to a model that included the FRS, a significant improvement result- ed in the ability to predict an abnormal CACS (≥300), shown in Fig. 1. Specifically, additional inclusion of inter-arm SBP differ- ence to the FRS increased the area under the curve for predict- ing CACS ≥300, from 0.664 to 0.721 (p<0.0001).
DISCUSSION
The main findings in our study are; 1) increased inter-arm SBP Table 1. Baseline Clinical Characteristics
Variable n=261
Age (yr) 60.6±9.1
Men, n (%) 150 (57.0)
BMI (kg/m2) 24.4±3.0
Hypertension, n (%) 131 (50.2)
Diabetes mellitus, n (%) 61 (23.4)
Dyslipidemia, n (%) 140 (53.6)
Current smoker, n (%) 49 (18.8)
Laboratory findings
Creatinine (mg/dL) 1.0±0.2
Total cholesterol (mg/dL) 190.8±41.1
Triglyceride (mg/dL) 141.5±84.3
HDL cholesterol (mg/dL) 49.3±11.8
LDL cholesterol (mg/dL) 112.8±35.4
hs-CRP (mg/L) 0.2±0.7
Ejection fraction (%) 65.4±5.5
SBP of right arm (mm Hg) 135.2±17.7
SBP of left arm (mm Hg) 132.4±16.9
DBP of right arm (mm Hg) 80.1±9.7
DBP of left arm (mm Hg) 79.3±9.4
Absolute inter-arm SBP difference (mm Hg) 5.4±4.1 Absolute inter-arm DBP difference (mm Hg) 3.3±2.2
FRS (% per 10 yr) 10.2±7.3
CACS 169.4±326.6
BMI, body mass index; HDL, high-density lipoprotein; LDL, low-density lipo- protein; hs-CRP, high sensitivity C-reactive protein; SBP, systolic blood pres- sure; DBP, diastolic blood pressure; FRS, Framingham Risk Score; CACS, cor- onary artery calcium score.
Data are mean±SD or n (%).
Table 2. Bivariate Analysis Showing Correlation between CACS and Various Parameters
Variable r p value
Age 0.256 <0.001
Creatinine 0.139 0.030
Total cholesterol -0.102 0.108
LDL cholesterol -0.089 0.189
hs-CRP 0.030 0.678
Ejection fraction -0.084 0.193
Mean of right arm SBP 0.172 0.005
Mean of left arm SBP 0.190 0.002
Mean of right arm DBP 0.005 0.933
Mean of left arm DBP 0.022 0.726
Absolute inter-arm SBP difference 0.152 0.014 Absolute inter-arm DBP difference 0.085 0.196
FRS 0.278 <0.001
CACS, coronary artery calcium score; LDL, low-density lipoprotein; hs-CRP, high sensitivity C-reactive protein; SBP, systolic blood pressure; DBP, diastolic blood pressure; FRS, Framingham Risk Score.
Table 3. Multivariate Logistic Regression Analysis Showing the Association between Degree of CACS (≥300) and Various Parameters
Variable Unadjusted Adjusted*
OR (95% CI) p value OR (95% CI) p value
Age 1.09 (1.05–1.13) <0.001 1.10 (1.03–1.18) 0.005
Diabetes mellitus 1.50 (0.74–3.17) 0.247 1.30 (0.53–3.22) 0.567
Hypertension 1.47 (0.76–2.84) 0.256 1.13 (0.48–2.67) 0.788
Women 0.97 (0.50–1.88) 0.923 0.64 (0.19–2.17) 0.477
Dyslipidemia 1.57 (0.80–3.07) 0.190 1.42 (0.62–3.26) 0.410
BMI 0.96 (0.85–1.07) 0.434 1.05 (0.90–1.21) 0.556
Absolute inter-arm SBP difference ≥6 mm Hg 2.17 (1.12–4.22) 0.022 2.34 (1.06–5.19) 0.036
FRS ≥10 2.02 (1.04–3.91) 0.038 1.34 (0.44–4.12) 0.608
CACS, coronary artery calcium score; OR, odds ratio; CI, confidence interval; BMI, body mass index; SBP, systolic blood pressure; FRS, Framingham Risk Score.
*ORs have been adjusted for age ≥50 years, gender, hypertension, diabetes mellitus, dyslipidemia, BMI, absolute inter-arm SBP difference ≥6 mm Hg, FRS ≥10.
difference (≥6 mm Hg) is an independent predictor for coro- nary atherosclerosis using CACS even after adjusting for known CV risk factors; 2) inter-arm SBP difference provides addition- al information for predicting severe coronary calcification com- pared to models based on known traditional risk factors.
Recently, a great deal of interest has been paid on the pre- dictive value of inter-arm BP difference for clinical outcomes.
Previous data have indicated that an increased difference in in- ter-arm SBP is associated with an increased risk of subclinical atherosclerosis, left ventricular hypertrophy, aortic aneurysms and aortic dissection, and CV disease.9.10,15-17 In addition, a recent meta-analysis, based on 9 studies including over 15617 pa- tients,7 demonstrated that a greater difference in inter-arm SBP was a predictor of increased all-cause and CV mortality. How- ever, there were some limitations to these previous studies.
Most of the evidence on CV disease came from studies mea- suring BP sequentially in both arms, instead of synchronous measurements as in our study. Sequential BP measurements have been shown to overestimate the prevalence of an increased inter-arm BP difference.18 Also, there are a lack of studies as- sessing the correlation between inter-arm BP difference and
coronary atherosclerosis using CACS as measured by coro- nary CTA. In this regard, our data give more meaningful infor- mation for significant association of synchronously measured inter-arm BP difference with CACS obtained from coronary CTA in outpatient daily practice.
CACS has been shown to provide an increased predictive value over traditional CV disease risk factors. Indeed, CACS is a robust predictor of CV events and all-cause mortality for in- dividuals with an intermediate CV risk.4,19-21 Current guidelines give a Class IIa recommendation for the use of CACS in indi- viduals at intermediate CV risk.20,21 Moreover, a recent study suggested that an increasing CACS was significantly associated with a higher risk of all-cause mortality among patients with a very low CV risk factor profile.22 In the present study, our data showed that inter-arm SBP difference was significantly corre- lated with the degree of CACS. When we focused our analysis on CACS ≥300, as this is known to identify those at the highest risk of CV events,23 the cutoff value of inter-arm SBP difference
≥6 mm Hg was shown to be an independent predictor of CACS
≥300, especially in patients who had at least an intermediate risk of CV disease.
Although CACS is the most validated marker of coronary ath- erosclerosis among non-invasive imaging modalities, valid questions on radiation exposure and cost-effectiveness are ma- jor limitations to its repeated use in routine outpatient daily practice. In our study, additional inclusion of inter-arm SBP dif- ference improved the ability of risk prediction models, which are based on traditional risk factors for coronary atherosclero- sis such as FRS. In this regard, inter-arm SBP difference may be an alternative option for screening patients for coronary ath- erosclerosis.
The present study has several limitations. First, since our study had an observational study design, the identified associations do not necessarily confirm causation. Furthermore, due to the absence of randomization from the general population, gener- alization of our findings is restricted. However, because this study has important findings on the value of inter-arm SBP dif- ference in patients who had at least an intermediate risk of CV disease, confirmation with larger randomized studies is need- ed. Second, we used multivariable analysis for FRS and incor- porated known CAD risk factors such as age, hypertension, di- abetes mellitus, and dyslipidemia that would be associated with inter-arm BP difference. However, we could not clearly adjust for other non-traditional risk factor for CAD. Finally, we enrolled those patients who had ≥3 CV risk factors or a pre- Table 4. Frequency of Patients with Increased Inter-Arm SBP Difference Stratified by CACS
CACS Total (n=261) Inter-arm SBP difference
p value (≥6 mm Hg, n=110) (<6 mm Hg, n=151)
1–99 (%) 170 (65.1) 65 (59.1) 105 (69.5) 0.080
100–299 (%) 48 (18.4) 20 (18.2) 28 (18.6) 0.941
≥300 (%) 43 (16.5) 25 (22.7) 18 (11.9) 0.020
CACS, coronary artery calcium score; SBP, systolic blood pressure.
Fig. 1. Comparison of the receiver operating characteristic curves for inter-arm SBP difference in addition to a model of the 10-year CHD risk (FRS) to predict an abnormal CACS (≥300). CACS, coronary artery cal- cium score; SBP, systolic blood pressure; FRS, Framingham Risk Score;
CHD, coronary heart disease, CI, confidence interval.
100
80
60
40
20
0
0 20 40 60 80 100
FRS
FRS+Inter-arm SBP difference
Sensitivity
100-specificity
C-statistics 95% CI p value
FRS 0.664 0.596–0.728 0.0005
FRS+Inter-arm SBP difference 0.721 0.655–0.781 <0.0001
dominantly intermediate FRS (FRS ≥10). Therefore, the appli- cation of our findings is limited to patients who had at least an intermediate risk of CV disease, and generalizability of our findings to patients with low risk of severe coronary calcifica- tion needs further confirmation.
In conclusion, an increased inter-arm SBP difference (≥6 mm Hg) is an independent predictor for coronary atheroscle- rosis using CACS and provides additional information for pre- dicting severe coronary calcification, compared to models based on known traditional risk factors. Patients with evidence of increased inter-arm SBP difference may warrant a more thorough evaluation for coronary atherosclerotic disease with CACS.
REFERENCES
1. Smith SC Jr, Greenland P, Grundy SM. AHA conference proceed- ings. Prevention conference V: beyond secondary prevention:
identifying the high-risk patient for primary prevention: executive summary. American Heart Association. Circulation 2000;101:111-6.
2. Greenland P, Smith SC Jr, Grundy SM. Improving coronary heart disease risk assessment in asymptomatic people: role of traditional risk factors and noninvasive cardiovascular tests. Circulation 2001;
104:1863-7.
3. Greenland P, Alpert JS, Beller GA, Benjamin EJ, Budoff MJ, Fayad ZA, et al. 2010 ACCF/AHA guideline for assessment of cardiovas- cular risk in asymptomatic adults: a report of the American College of Cardiology Foundation/American Heart Association Task Force on Practice Guidelines. J Am Coll Cardiol 2010;56:e50-103.
4. Budoff MJ, Shaw LJ, Liu ST, Weinstein SR, Mosler TP, Tseng PH, et al. Long-term prognosis associated with coronary calcification:
observations from a registry of 25,253 patients. J Am Coll Cardiol 2007;49:1860-70.
5. Madhavan MV, Tarigopula M, Mintz GS, Maehara A, Stone GW, Généreux P. Coronary artery calcification: pathogenesis and prog- nostic implications. J Am Coll Cardiol 2014;63:1703-14.
6. Agarwal R, Bunaye Z, Bekele DM. Prognostic significance of be- tween-arm blood pressure differences. Hypertension 2008;51:657-62.
7. Cao K, Xu J, Shangguan Q, Hu W, Li P, Cheng X, et al. Association of an inter-arm systolic blood pressure difference with all-cause and cardiovascular mortality: an updated meta-analysis of cohort stud- ies. Int J Cardiol 2015;189:211-9.
8. Clark CE, Taylor RS, Shore AC, Ukoumunne OC, Campbell JL. As- sociation of a difference in systolic blood pressure between arms with vascular disease and mortality: a systematic review and me- ta-analysis. Lancet 2012;379:905-14.
9. Clark CE, Taylor RS, Shore AC, Campbell JL. The difference in blood pressure readings between arms and survival: primary care cohort study. BMJ 2012;344:e1327.
10. Su HM, Lin TH, Hsu PC, Chu CY, Lee WH, Chen SC, et al. Association
of interarm systolic blood pressure difference with atherosclerosis and left ventricular hypertrophy. PLoS One 2012;7:e41173.
11. Johansson JK, Puukka PJ, Jula AM. Interarm blood pressure dif- ference and target organ damage in the general population. J Hy- pertens 2014;32:260-6.
12. Wilson PW, D’Agostino RB, Levy D, Belanger AM, Silbershatz H, Kannel WB. Prediction of coronary heart disease using risk factor categories. Circulation 1998;97:1837-47.
13. Ann SH, Kim JH, Ha ND, Choi SH, Garg S, Singh GB, et al. Repro- ducibility of coronary artery calcium measurements using 0.8-mm- thickness 256-slice coronary CT. Jpn J Radiol 2014;32:677-84.
14. Agatston AS, Janowitz WR, Hildner FJ, Zusmer NR, Viamonte M Jr, Detrano R. Quantification of coronary artery calcium using ul- trafast computed tomography. J Am Coll Cardiol 1990;15:827-32.
15. Tanaka Y, Fukui M, Tanaka M, Fukuda Y, Mitsuhashi K, Okada H, et al. The inter-arm difference in systolic blood pressure is a novel risk marker for subclinical atherosclerosis in patients with type 2 diabetes. Hypertens Res 2014;37:548-52.
16. Baumann F, Makaloski V, Diehm N. [Aortic aneurysms and aortic dissection: epidemiology, pathophysiology and diagnostics]. In- ternist (Berl) 2013;54:535-42.
17. Weinberg I, Gona P, O’Donnell CJ, Jaff MR, Murabito JM. The sys- tolic blood pressure difference between arms and cardiovascular disease in the Framingham Heart Study. Am J Med 2014;127:209-15.
18. van der Hoeven NV, Lodestijn S, Nanninga S, van Montfrans GA, van den Born BJ. Simultaneous compared with sequential blood pressure measurement results in smaller inter-arm blood pressure differences. J Clin Hypertens (Greenwich) 2013;15:839-44.
19. Schulman-Marcus J, Valenti V, Hartaigh BÓ, Gransar H, Truong Q, Giambrone A, et al. Prognostic utility of coronary artery calcium scoring in active smokers: a 15-year follow-up study. Int J Cardiol 2014;177:581-3.
20. Goff DC Jr, Lloyd-Jones DM, Bennett G, Coady S, D’Agostino RB, Gibbons R, et al. 2013 ACC/AHA guideline on the assessment of cardiovascular risk: a report of the American College of Cardiolo- gy/American Heart Association Task Force on Practice Guidelines.
Circulation 2014;129(25 Suppl 2):S49-73.
21. Perk J, De Backer G, Gohlke H, Graham I, Reiner Z, Verschuren M, et al. European Guidelines on cardiovascular disease prevention in clinical practice (version 2012). The Fifth Joint Task Force of the European Society of Cardiology and Other Societies on Cardiovas- cular Disease Prevention in Clinical Practice (constituted by rep- resentatives of nine societies and by invited experts). Eur Heart J 2012;33:1635-701.
22. Nakanishi R, Li D, Blaha MJ, Whelton SP, Matsumoto S, Alani A, et al. The relationship between coronary artery calcium score and the long-term mortality among patients with minimal or absent coro- nary artery risk factors. Int J Cardiol 2015;185:275-81.
23. Okwuosa TM, Greenland P, Ning H, Liu K, Bild DE, Burke GL, et al. Distribution of coronary artery calcium scores by Framingham 10-year risk strata in the MESA (Multi-Ethnic Study of Atheroscle- rosis) potential implications for coronary risk assessment. J Am Coll Cardiol 2011;57:1838-45.