Journal of the Korea Institute of Building Construction, Vol. 12, No. 6
http://dx.doi.org/10.5345/JKIBC.2012.12.6.615 www.jkibc.org
A Basic Study to Measure the Effectiveness
of the Korean Green Building Certification System in Terms of Sustainability
Park, Young Jun1 Son, Kiyoung2 Ahn, Sungjin3 Kim, Sunkuk2*1)
Department of Construction Engineering and Environmental Sciences, Korea Military Academy, PoBox 77-2, Gongneung-dong, Nowon-gu, Seoul, 139-799, Republic of Korea 1
Department of Civil and Coastal Engineering, University of Florida, 460 Weil Hall, Gainesville, FL 32611, USA 2 Department of Architectural Engineering, Kyung Hee University, 1 Seocheon-dong, Giheung-gu, Yongin-si,
Gyeonggi-do, 446-701, Republic of Korea 3
Abstract
Humanity is facing a number of serious issues associated with increased energy consumption and environmental pollution. Various studies/guidelines concerning sustainable building construction have suggested solutions to these disastrous problems, including: net-zero energy buildings, the green building certification system, and others.
Sustainability pursues three expected effects: environmental, social, and economic merits. Korean Green Building Council (K-GBC) has also announced the Korean Green Building Certification System (K-GBCS) since 2003 based on sustainability. Some positive social and environmental aspects of the K-GBCS have already been reported. However, it is somewhat difficult to verify its economic merits, which are crucial to ensuring the validity of the K-GBCS. This research aims to verify the economic merits of the eco-friendly Korean-style condominiums accredited by K-GBCS.
Following this, the expected economic effectiveness of K-GBCS will be examined in terms of sustainability. The underlying assumption is that the potential economic effect should reflect the actual economic merits, and should reflect the value of the housing in particular. According to the analysis of the variance, it can be concluded the value of green certified buildings is statistically higher than the value of non-certified buildings. Furthermore, it was also observed that this tendency was more dominant in Gyeonggi Province than in the City of Seoul. This may be caused by one of the variables: the proximity to downtown. In future studies, this variable should be studied in greater detail.
Keywords : korean green building certification system (K-GBCS), korean green building council (K-GBC), sustainability, house-values, analysis of variance (ANOVA), quantitative analysis
1. Research Problem
This research aims to verify the economic merits of the eco-friendly, Korean-style condominium accredited by the Korean Green Building Certification System (K-GBCS). The expected economic effectiveness of the K-GBCS will then be
Received : July 4, 2012
Revision received : August 21, 2012 Accepted : October 10, 2012
* Corresponding author : Kim, Sunkuk
[Tel: 82-31-201-3365, E-mail: [email protected]]
ⓒ2012 The Korea Institute of Building Construction, All rights reserved.
examined in terms of sustainability.
2. Background and Significance
Humanity is faced with serious issues associated with increased energy consumption and environmental pollutants. As such, numerous studies and guidelines have been conducted and presented in an attempt to solve these disastrous problems. In early research of this kind, however, these efforts could not overcome their own limitations, i.e., qualitative outcomes. But currently, a few
A Basic Study to Measure the Effectiveness of the Korean Green Building Certification System in Terms of Sustainability
quantitative studies and guidelines have been announced with more objective data that support more enforceable standards concerning the sustainable environment, such as net-zero energy building or Leadership in Energy and Environmental Design (LEED)[1,2,3,4,5].
In Korea, the K-GBCS has been proposed.
While it is similar to LEED 2009 for New Construction and Major Renovation (LEED-NC), it still needs more objective support to draw more reasonable conclusions, particularly in terms of the economic merits. The K-GBC claims that K-GBCS brings the following economic merits associated with the developed technologies to protect living environments: a reduction of building operating energy and cost savings related to the maintenance of health thanks to the cleaner environment[6]. In a capitalist economy, these potential economic merits should be reflected in the actual asset, such as real estate[1,7].
The expected effectiveness of the K-GBCS- associated environmental and social aspects has already been revealed, but the economic benefits need to be clarified. Thus, in this study, by examining the difference in value between green-certified and non-certified buildings, the expected economic effectiveness of the K-GBCS will be identified as one of the most important aspects of sustainability.
3. Literature reviews
3.1 Sustainability
The English word 'sustainability' is derived from the Latin word 'sustinere.' While there are numerous meanings associated with the Latin term, it can be generally summarized as meaning 'maintain,' 'support' or 'endure.'[8] On the other hand, it has been applied more sensitively in
relation to environmental conservation and development since the 1980s, and is currently defined by the United Nations General Assembly as the reconciliation of environmental conservation, social equity, and economic demands[9]. However, the UN’s definition is somewhat broad, and is not accepted universally[10]. This openness rather than incompleteness dictates that it should be more precisely re-defined to ensure its serviceability[11].
In relation to building construction, the definition of sustainability is derived from the current trend of attempting to balance land development with environmental conservation.
Previously, land development and environmental conservation were considered to be mutually exclusive. But this is no longer true, and land development and environmental conservation can eventually evolve toward a complementary relationship. While environmental abuses caused by imprudent development may result in immediate economic gain but long-term economic and environmental disaster, sustainable land development hopefully guarantees long-term increases in economic value and a cleaner ecosystem[1]. For example, the United States Green Building Council (US-GBC) recently published “Leadership in Energy and Environmental Design 2009 for New Construction and Major Renovation (LEED-NC).” This metric enables one to make decisions concerning land development or restoration projects that limit the environmental impact on the regional ecosystem[2]. Similarly, today, particularly in the area of building construction, sustainable construction can establish a strong foothold toward achieving environmental conservation, social equity, and economic needs.
3.2 Leed Rating System In The United States LEED-NC aims to classify buildings that qualify
Gold, and Platinum. This classification, announced by the United States Environmental Protection Agency (EPA), is based on the potential environmental impacts and human benefits. Thus, certified buildings could be more effective in terms of energy efficiency and provide pleasant working or living conditions. In addition, certification also contributes to preserving our ecosystem. Even though the US-GBC has compiled the benefits of the LEED-NC Rating System based on many examples of the current certified buildings, these benefits are limited to the social and environmental aspects. In other words, it is currently difficult to verify the economic merits of the LEED-NC Rating System. But recently, a few studies have testified to its economic merits. Park and Son quantitatively evaluated the economic merits of sustainable construction following the LEED-NC metrics by showing the strong relationship between the LEED-NC Points and land values[1,4,5,7].
Therefore, it is currently known that the LEED-NC Rating System does not act as a restriction to block land development, but rather as a guideline to accelerate sustainable land development for both economic merits and environmental conservation.
3.3 Korea Green Building Certification System Sustainability can be simply accepted as the concept of improving the quality of human life while living within the carrying capacity of supporting eco-systems. However, the more universally-accepted definition of sustainability remains elusive, as it is often linked with other concepts[15]. For instance, in building construction, it could be recognized as a rudder to conserve as well as to develop our environment[1,4,5,6]. Based on this intent, the U.S. Green Building Council has developed
construction[2]. Likewise, the K-GBC is also a non-profit institute that encourages sustainability in how buildings are designed, built, and operated.
The K-GBC is best known for developing the Korean Green Building Certification System (K-GBCS) and Greenbuild, a green building conference and exposition that promotes the green building industry, including environmentally responsible materials, sustainable architecture techniques, and public policy[6].
Like the LEED-NC in the United States, Korea has also employed the K-GBCS in earnest since 2003. The LEED-NC is recommended by the private sector, but the K-GBCS is advised by the government (Ministry of Land, Transport and Maritime Affairs, and Ministry of Environment). In addition to managerial agents, the other difference between the LEED-NC and the K-GBCS is that the former provides recommendations or guidelines but the latter is closer to laws or regulations, and thus K-GBCS should be considered a more powerful tool than the LEED-NC.
The K-GBCS is defined as a system which authorizes the green building certification for buildings that contribute to saving operating energy and reducing environmental pollutants across the life cycle of the building, including the design, construction, maintenance, and management phases. Therefore, it eventually aims for a sustainable environment in which human beings and nature can coexist[6]. This definition shows that the K-GBCS is also a kind of metric that does not block development due to environmental conservation, but encourages sustainable development for the coexistence of humanity and nature, like the LEED-NC.
Similar to LEED-NC, the K-GBCS also promotes environmental, technical, and expected economic
A Basic Study to Measure the Effectiveness of the Korean Green Building Certification System in Terms of Sustainability
effectiveness, so that K-GBC also contains the benefits of the K-GBCS in terms of environmental and technical merits, both qualitatively and quantitatively[6]. On the other hand, politically, even though a couple of economic incentives have been provided to the owner or operator of the certified green building, it is difficult to quantitatively specify the actual added economic value.
3.4 House-Values
House-Value can be defined as a unit housing market price (₩/㎡) of residential condominiums.
The value of a house may be related to macroscopic variables such as real-estate policies, educational environment, and living environment, as well as macroeconomic variables such as incomes, population, interest rates, etc. The macroscopic variables are likely to significantly affect residential land values, while the macroeconomic variables tend to be less important.
Thus, the latter variables are generally ignored in residential land value models[12]. This tendency can also be explicitly evident in house (market) values[13].
Macroscopic variables are classified into physical characteristics and environmental features. Commonly, it has been shown that physical characteristics are more statistically significant to house-values than environmental features[13]. In terms of physical characteristics, residential area, completion year, and the number of households are representative variables. Those variables associated with environmental features are educational environment and spatial proximity to the downtown or a river[14].
4. Data Collection and Management:
Sampling and Assumptions
Currently, 242 buildings are certified as Green
Buildings by the K-GBCS in Korea. Of these, seven buildings are in the first grade and the remaining 235 are in the second one, as shown in Figure 1. The numbers of residential Korean-style condominiums, business office buildings, and schools are 213, 26, and 3, respectively, as shown in Figure 2.
Figure 1. Classification Distribution of the Certified Green Buildings
Figure 2. Use Distribution of the Certified Green Buildings
Figure 3. Sampled Green Certified Buildings in/around Seoul
·
Figure 4. The Non-Certified Buildings Sampling
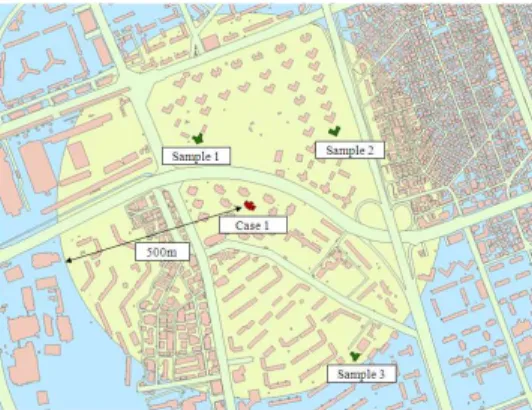
First of all, of the green-certified buildings, just one type, the residential condominium, was considered in this study. Of the 213 residential condominiums, 25 buildings in and around Seoul were randomly selected and formed a Green-Certified Building Group (GCB), i.e., a treatment group, as shown in Figure 3. Next, each selected green building became the center of an area, i.e., the circular zone (the radius is 0.5 km).
In each circular zone, three non-certified buildings were selected, so that the control group, i.e., a Non-Certified Building Group (NCB), was composed of these 75 residential condominiums as shown in Figure 4. In this study, the macroeconomic variables were not considered as independent variables because of their mimic impact on house-values. Of the macroscopic variables, it was only considered whether or not the building was certified by K-GBCS as a nominal variable. To control the other macroscopic variables, i.e., associated environmental features of the building, non-certified buildings within 0.5 km of the certified building were sampled in each region because the non-certified building was in a circular zone whose centroid was a certified green building and the radius was 0.5 km. In addition, to lessen the impact caused by the physical characteristics of macroscopic variables such as completion year, area of exclusive-use space, etc.,
from among the sampled buildings in each region.
However, for a more accurate study, the controlled variables should be considered in future studies.
Second, within each region, it was possible to compare the absolute house values of the sampled building. However, it was impossible to make a house-value comparison of houses in different regions. One of the available ways was to make the relative House-Value Index (HVI). Thus, the jth building in the ith region is as shown in Equation (1).
--- (1)
where, n is the number of samples in each region, HV means house-values
The HVI shows the relative value of a building regardless of its location. If HVI is larger than one, its absolute house value is higher than the average house value. Otherwise, its absolute house value is less than the average house value.
Likewise, the HVI is a value to express relative scale; thus, an arithmetic analysis across building location was possible.
Table 1 shows physical characteristics, house- values, and calculated house-value index for the sampled condominiums. R, G, A, CY, UV, and HVI mean a region, a group, area of exclusive use space, completion year, unit house value, and house-value index, respectively.
5. Descriptive Statistics And Outliers
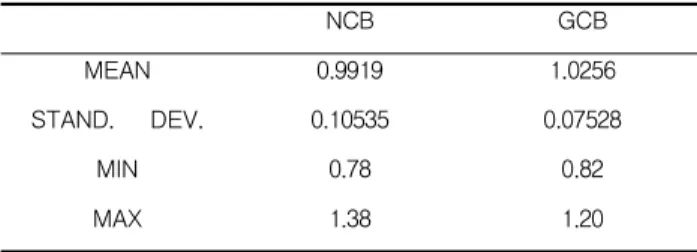
Table 2 shows the descriptive statistics for both the NCB and GCB. According to this descriptive analysis, the HV for the group GCB is higher than the one for the group NCB.
A Basic Study to Measure the Effectiveness of the Korean Green Building Certification System in Terms of Sustainability
R ID G A
(㎡) CY HV
(KW/㎡) HVI R ID G A
(㎡) CY HV
(KW/㎡) HVI
A 1 GCB 106.60 2010.01 361.16 0.95 M 51 NCB 112.55 2010.04 275.43 0.96
2 NCB 105.78 2007.02 359.24 0.95 52 NCB 109.25 2010.06 283.75 0.99
3 NCB 109.09 2008.04 421.67 1.11 N 53 GCB 109.70 2010.08 296.26 1.05
4 NCB 103.02 2010.07 373.71 0.99 54 NCB 113.65 2009.09 246.37 0.87
B 5 GCB 108.83 2009.03 422.68 0.97 55 NCB 109.33 2010.06 301.84 1.07
6 NCB 111.75 2009.01 456.38 1.05 56 NCB 110.26 2010.06 287.96 1.02
7 NCB 105.42 2010.01 445.84 1.02 P 57 GCB 111.31 2010.08 289.73 1.06
8 NCB 113.64 2008.06 417.99 0.96 58 NCB 112.55 2010.04 275.43 1.01
C 9 GCB 105.78 2010.04 392.32 0.82 59 NCB 109.25 2010.06 283.75 1.04
10 NCB 112.39 2008.02 422.64 0.88 60 NCB 113.65 2009.09 246.37 0.90
11 NCB 109.52 2010.03 657.41 1.38 Q 61 GCB 111.54 2010.07 300.34 1.03
12 NCB 106.00 2009.11 438.68 0.92 62 NCB 109.33 2010.06 301.84 1.04
D 13 GCB 108.05 2010.08 476.63 1.20 63 NCB 110.26 2010.06 287.96 0.99
14 NCB 109.09 2009.10 437.71 1.10 64 NCB 112.55 2010.04 275.43 0.95
15 NCB 112.39 2008.04 338.11 0.85 R 65 GCB 109.25 2010.00 302.06 1.07
16 NCB 112.40 2009.07 338.08 0.85 66 NCB 109.25 2010.06 283.75 1.00
E 17 GCB 107.32 2010.09 507.83 1.13 67 NCB 113.65 2009.09 246.37 0.87
18 NCB 112.33 2010.06 480.73 1.07 68 NCB 109.33 2010.06 301.84 1.06
19 NCB 112.14 2010.07 430.27 0.96 S 69 GCB 114.65 2010.08 361.97 1.05
20 NCB 109.74 2008.10 373.61 0.83 70 NCB 114.65 2010.08 344.53 1.00
F 21 GCB 112.33 2010.06 480.73 1.07 71 NCB 120.08 2010.07 333.11 0.96
22 NCB 107.32 2010.09 507.83 1.13 72 NCB 112.32 2009.11 342.77 0.99
23 NCB 112.14 2010.07 430.27 0.96 T 73 GCB 120.40 2010.00 332.23 0.98
24 NCB 109.74 2008.10 373.61 0.83 74 NCB 114.65 2010.08 344.53 1.02
G 25 GCB 112.14 2010.07 430.27 0.96 75 NCB 120.08 2010.07 333.11 0.99
26 NCB 107.32 2010.09 507.83 1.13 76 NCB 112.32 2009.11 342.77 1.01
27 NCB 112.33 2010.06 480.73 1.07 U 77 GCB 112.46 2010.08 342.34 1.00
28 NCB 109.74 2008.10 373.61 0.83 78 NCB 114.65 2010.08 344.53 1.01
H 29 GCB 113.41 2010.10 1014.02 0.93 79 NCB 120.08 2010.07 333.11 0.98
30 NCB 113.14 2009.07 1259.50 1.15 80 NCB 112.32 2009.11 342.77 1.01
31 NCB 116.87 2009.03 1167.96 1.07 V 81 GCB 113.90 2010.02 235.29 0.99
32 NCB 110.49 2010.02 941.26 0.86 82 NCB 118.40 2009.07 232.26 0.97
I 33 GCB 109.55 2010.11 447.28 1.08 83 NCB 127.79 2010.05 275.84 1.16
34 NCB 111.60 2008.02 340.50 0.82 84 NCB 114.50 2010.02 209.61 0.88
35 NCB 108.61 2008.12 391.31 0.94 W 85 GCB 109.88 2010.02 259.37 1.06
36 NCB 105.79 2010.08 484.45 1.16 86 NCB 112.15 2010.04 234.06 0.96
J 37 GCB 109.09 2010.02 531.67 1.14 87 NCB 127.79 2010.05 275.84 1.13
38 NCB 105.64 2008.12 492.24 1.05 88 NCB 114.50 2010.02 209.61 0.86
39 NCB 109.09 2009.03 485.84 1.04 X 89 GCB 111.62 2010.06 335.96 1.02
40 NCB 105.78 2007.06 363.96 0.78 90 NCB 110.22 2010.05 285.79 0.86
K 41 GCB 109.63 2010.05 415.03 1.00 91 NCB 111.44 2009.11 332.02 1.00
42 NCB 108.06 2007.09 365.54 0.88 92 NCB 106.70 2009.07 370.20 1.12
43 NCB 106.38 2010.05 491.16 1.18 Y 93 GCB 113.51 2010.03 240.07 1.03
44 NCB 111.42 2010.12 394.90 0.95 94 NCB 113.39 2010.02 240.32 1.04
L 45 GCB 110.34 2010.05 421.42 1.00 95 NCB 113.49 2009.07 237.91 1.03
46 NCB 111.42 2010.12 394.90 0.94 96 NCB 115.62 2009.11 209.74 0.90
47 NCB 106.38 2010.05 491.16 1.17 Z 97 GCB 112.45 2010.08 244.11 1.00
48 NCB 109.90 2007.02 370.79 0.88 98 NCB 109.21 2010.12 228.92 0.93
M 49 GCB 107.70 2010.06 301.76 1.05 99 NCB 110.19 2009.05 254.11 1.04
50 NCB 110.26 2010.06 287.96 1.00 100 NCB 110.55 2008.04 253.28 1.03
Table 1. Allowable load comparison for each case Table 2. Descriptive Statistics for the Both NCB and GCB
NCB GCB
MEAN 0.9919 1.0256
STAND. DEV. 0.10535 0.07528
MIN 0.78 0.82
MAX 1.38 1.20
However, considering the distribution associated standard deviation, maximum and minimum values, it is necessary to check the outliers. According to the standard residual, Cook’s distance, and Leverage, two records in NCB and one record in GCB need to be deleted.
The main concern of this study is whether there is an HVI difference between group GCB and NCB.
Commonly, it should be obvious that the sample means for the two groups could not be numerically identical, as shown in Table 2. However, statistically, it is not so simple to conclude that this difference is meaningful. The Analysis of Variance (ANOVA) aims to determine whether the numerical difference between these sample means is statistically significant. If the difference is more than what might be possible accidentally, i.e., caused by the properties of two groups, GCB and NCB, it could be concluded that there is sufficient evidence to verify there are reasonable differences between the population means. The hypotheses to testify this ANOVA problem are as follows.
--- (2)
≠ --- (3)
where, and are the HV means for the green certified building and non-certified building respectively.
The variance of the data to determine the statistical difference between two group means could be analyzed through the F test, which provides the p-value. With this p-value, the hypotheses above are tested for a decision.
Through the F test, if the between-group variability is larger than the within-group variability, H0 could be rejected; i.e., it could be concluded that the means for the two groups are statistically different. The F test results are shown in Table 3.
NCB.
SUM OF
SQUARES DF MEAN
SQUARE F SIG.
BETWEEN
GROUPS 0.036 1 0.036 4.782 0.031
WITHIN
GROUPS 0.717 95 0.008
TOTAL 0.753 96
The p-value for this ANOVA is 0.031, which is less than the a-value, 0.05. Thus the null hypothesis, which would hold that the means of the populations are the same, is rejected. Thus, it could be concluded that the means of the populations are not the same.
Even though the mean difference for the two groups is identified statistically, the F test should satisfy the following assumptions: Independence, Normality, and Equal Variance.
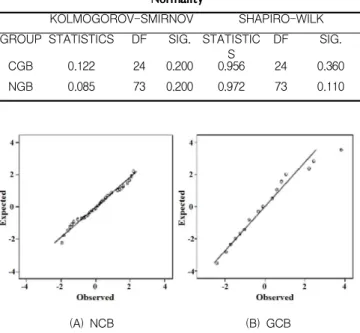
The sample data, which are not related to each other, are extracted from the GIS database, so that no observation provides any information associated with any other observations. Residual normality is crucial because the ANOVA theory is based on this assumption. Thus, if the residual is not normally distributed, the results cannot be reasonably accepted. Table 4 shows the numerical analysis to reflect the normality of the standard residuals for both the GCB and NCB. Generally, if the number of samples is bigger than 50, Kolmogorov-Smirnov is more valid than Shapiro-Wilk. Otherwise, the opposite is true. The sample size of the NCB is 73, so that both ways are acceptable. However, for the GCB, just Shapiro-Wilk should be used. According to Table 4, all the p-values are bigger than the alpha-values, 0.05, i.e., the null hypotheses (Standard Residual is normally distributed) cannot be rejected. This hypothesis test could be also verified graphically, as shown in Figure 5 and Figure 6. Thus, it is concluded that the standard residual is normally distributed.
A Basic Study to Measure the Effectiveness of the Korean Green Building Certification System in Terms of Sustainability
Table 4. Numerical Analysis to Check Standard Residuals Normality
KOLMOGOROV-SMIRNOV SHAPIRO-WILK
GROUP STATISTICS DF SIG. STATISTIC
S DF SIG.
CGB 0.122 24 0.200 0.956 24 0.360
NGB 0.085 73 0.200 0.972 73 0.110
(A) NCB (B) GCB
Figure 5. Q-Q plots for the Standard Residuals for NCB (A) and GCB (B)
Figure 6. Histograms of Standard Residuals for NCB (Left) and GCB (Right)
There are two representative ways to check the assumption of equal variance: looking at descriptive statistics and conducting a test for equal variance. In a situation of unequal variance, the probability that a biased conclusion will be drawn from the analysis is increased. According to the Levene test, the p-value is 0.084, so it failed to reject the null hypothesis, and population variance is equal. Thus, it could be concluded that the variance is equal. In sum, the ANOVA test satisfied the three assumptions: normality,
independency, and homogeneity.
Therefore, it is possible to conclude that the house-values of green-certified buildings are higher than those for the non-certified buildings.
A notable observation is that the tendency verified in this study is stronger in Gyeonggi Province than in Seoul. This may be caused by the variable
“associated proximity from downtown.” To identify this additional tendency, further study is required.
7. Conclusion
The K-GBCS has been provided by the K-GBC for the sustainable building system over the life cycle of a building. Numerous quantitative and qualitative results to support the K-GBCS has been found in terms of environmental and social effectiveness, but it is rare to find quantitative outcomes related to the expected economic effectiveness of the K-GBCS, even though there are many qualitative findings in this area.
In this study, by examining the difference between green-certified buildings and non-certified buildings in terms of house-value, the expected economic effectiveness of the K-GBCS was identified as one of the most important aspects of sustainability. The main assumption of this research is that the potential economic effectiveness should be reflected in actual economic effects, such as house-values. According to the analysis, it is possible to conclude that the house-values of green-certified buildings are higher than those for non-certified buildings. In addition, it was revealed that this tendency is more apparent in Gyeonggi Province than in Seoul.
This may be caused by the variable “proximity to downtown,” which should be a consideration in further studies.
1. Park YJ. Predicting the Unit Appraisal Value of the Unimproved and Private Land in the City of Houst on by LEED Sustainable Site Criteria [Dissertation]. Texas (TX):
Texas A&M University; 2009. 102 p.
2. US-Green building Council. LEED 2009 for New Construction and Major Renovation. Washington (WA): US Green building Council; 2009. 88 p.
3. Living Building Challenge, NETZERO Energy Buidling Certification [Internet]. Seattle: Living Building Challenge [cited 2011 April 20]. Available from:
http://living-future.org/netzero.
4. Son K, Choi K, Woods P, Park Y. Urban Sustainability Predictive Model Using GIS: Appraised Land Value Versus LEED Sustainable Site Credits. Journal of Construction Engineering and Management. 2011 July;138(9):1107-12.
5. Choi K, Son K, Woods P, Park Y. LEED Public Transportation Accessibility and Its Economic Implications.
Journal of Construction Engineering and Management. 2011 June; 138(9):1095-102.
6. K-GBC. Green Building Certification Information System [Internet]. Seoul: K-GBC [cited 2011 June 15]. Available from: http://greenbuilding.re.kr
7. Son K. Regression Model Predicting Appraised Unit Value of Land in San Francisco County from Number of and Distance to Public Transit Stops Using GIS [Dissertation]. Texas (TX):
Texas A&M University; 2011. 85 p.
8. Onions TC. The Shorter Oxford English Dictionary. Oxford (UK): Clarendon Press; 1964. 3804 p.
9. United Nations General Asembly. World Summit Outcome [Internet]. United Nations [cited 2011 Feb 10. Available form: http://data.unaids.org/topics/universalaccess/worlds ummitoutcome_resolution_24oct2005_en.pdf.
10. International Institute for Sustainable Development. What is Sustainable Development? [Internet]. International Institute for Sustainable Development [cited 2012 Feb 9]. Available form: http://www.iisd.org/sd.
11. Stephan M, Frank B, Hagen VO, Juliane R. National Contexts Matter: The Co-Evolution of Sustainability Standards in Global Value Chains. Ecological Economics.
2012 Nov; 83:197-209.
12. Rho T, Kang C. The impacts of Urban Environment on the Price of Residential Land. Journal of the Korea Real Estate Analysis Association. 2009 April;15(1):81-101.
Affecting Housing Market Prices. Suwon (Korea); Gyeonggi Research Institute; 2007 Nov. 179 p. Report No.: 2007-24 14. Kang Y. Modelling Spatial Variation of Housevalue
Determinants. Journal Articles of the Korean Geographical Society. 2004 Dec;39(6):907-21.