Financial Analysis by Conditional Quantile Regression on Corporate Research & Development Intensity for KOSDAQ-listed Firms in the
Korean Capital Market
Hanjoon Kim
Division of Business Administration, Hoseo University
국내 자본시장의 코스닥 상장기업들의 연구개발비 비중에 대한 분위회귀모형을 활용한 재무적 분석
호서대학교 경영대학 경영학부
김한준
Abstract This research analyses the financial characteristics of corporate R&D intensity in the Korean capital market. It is important to pay greater attention to this subject, given the current situation of the shortage of core components domestically in Korea. Three hypotheses are postulated to investigate the financial factors of R&D investments for KOSDAQ-listed firms during the post-era of the global financial turmoil. By applying a conditional quantile regression (CQR) model, three variables included R&D intensity in the previous year (Lag_RD), the squared term of Lag_RD, and interaction between the high-tech sector and Lag_Rd, reveal significant effects on the current R&D ratio. Whereas more than half of the total variables show variable impacts between firms with higher and lower R&D intensity, only Lag_RD and squared term of Lag_RD were found to be significant. It is expected that these results may contribute to being financial catalysts for an optimal level of R&D expenditures, thereby maximizing firm value for shareholders in KOSDAQ-listed firms.
요 약 본 연구의 주제는 국내 자본시장에서 기업의 연구개발비 비중에 영향을 줄 수 있는 재무적 결정요인들을 심층적 으로 분석하고자 하는 것이다. 최근까지 다른 국가들에서 정기적으로 수입하여 왔던 국내 기업들의 핵심 소재와 부품들 에 대한 부족 현상이 지속되고 있는 상황 속에서, 해당 핵심소재들의 자급을 위한 국내 연구개발비 투자와 관련된 추가 연구에 더 많은 관심을 기울이는 것은 이론적 그리고 실무적 측면에서 더욱 중요하다고 판단된다. 연구개발비 투자 확대 를 위한 정부와 기업들의 정책을 기준으로, 국제금융위기 이후 코스닥 상장기업들의 연구개발비 비중의 결정요인들 분석 하기 위하여, 3가지의 가설들이 본 논문에서는 검정되었다. 분위회기모형을 응용한 첫번쨰 가설 검정 결과, 총 설명변수 들 중, 전년도의 연구개발 비중(Lag_RD), 비선형성을 검정을 위한 Lag_RD의 제곱 항, 그리고 하이텍 기술군과 Lag_Rd 간의 교호작용 등이 연구개발비 비중에 유의한 영향을 보였다. 두번째 가설에서 총 설명 변수들 중 과반수 이상의 재무변 수들이 연구재발비 비중이 높은 기업군과 낮은 기업군을 통계적으로 구분하는 요인들로 판명되었으다. 본 연구의 결과들 은 향후 기업의 연구개발비의 적정 수준을 측정하기 위한 재무적 결정요인으로서 활용되어, 주주의 측면에서 기업가치의 극대화에 기여할 수 있을 것으로 기대된다.
Keywords : Conditional Quantile Regression, Financial Components, Korean Capital Market, KOSDAQ-listed Firms, Research & Development Intensity
*Corresponding Author : Hanjoon Kim(Hoseo Univ.) email: [email protected]
Received February 3, 2020 Revised March 2, 2020 Accepted May 8, 2020 Published May 31, 2020
1. Introduction
This study aims to conduct further research on corporate research and development (henceforth R&D) expenditures for KOSDAQ-listed firms (i.e., firms listed on the Korea Securities Dealers Association Automated Quotation) stock market during the post-period of the global financial turmoil begun in the year 2008. In other words, the sample period comprehends the entire period of the post-financial crisis, that covers from the year 2010 to 2018 (for 9 years).
Moreover, as an extension of the previous studies such as [1] and [2], the sample data in this study are also collected from the population of the KOSDAQ-listed firm in the domestic capital market. As for an underlying rationale to select the KOSDAQ-listed firm as the samle data is overall associated with the fact that their buinesses or operatons are more concentrated in the field of information & technology (I/T) than their counterparts listed on the KOSPI (Korea Composite Stock Price Index) stock market. As described in [2], there are ongoing shortages of core components or materials for the firms in the domestic industries, that have been regularly imported from other nation(s). Therefore, it seems to be important or even imperative to identify financial components of the R&D intensity for the KOSDAQ-listed firms which are more equipped with technologies applicable to produce the components or parts in the future.
It was officially announced by Ministry of Science and ITC (Information, Communication and Technology) of the Korean government that the total amount of R&D expenditures at the national level were estimated at KRW 69.4055 trillion (about US$ 57.8billion) in the year 2016, which was the top 5th rank among total OECD (Organization for Cooperation and Development) member nations. The proportion of R&D expenses scaled by national GDP (Growth Domestic Product) was also estimated at 4.24%,
which ranked 2nd on a global basis.[3] Moreover, the official plan projected for the year 2020 was initiated by the domestic government, such that active investments developing “NANO and core components-related technologies”, are expedited which may be motivated by the recent export restraints imposed by other nation, as reported in [4]. The government announced that the amount of KRW 335.9 billion (about US$279.9 million) are scheduled to be invested in the sectors of core components, parts and equipment developments in 2020. Approximately 70% of the total amount is invested in the R&D activities to develop the NONO and Core-components, which increases by 136% points on a year-over-year basis.
Followings are primary motivations to conduct
this research. First, given the modern finance
theorizing a trade-off relationship between
benefits and risks of corporate R&D
expenditures, this study is to identify financial
components to determine R&D intensity for the
KOSDAQ-listed firms. However, this study differs
from the previous literature such as [1] and [2],
even if it is an extension of them, as described
above. First, to implement further analyses on
the financial determinants subject of R&D
intensity, entire sample observations are divided
into each category on the basis of the level of
R&D expenditures. That is, conditional quantile
regression (CQR) model is applied to conduct
thess procedures. Financial determinants of R&D
outlays are separately estimated for each
stratified quantile, that is different from the
methodologies used in [1] and [2]. And then, the
results are statistically compared to examine
commonalities or differences across all the
quantiles. Moreover, ithe findings may also be
compared with those in [13] which employed the
model for the KOSPI-listed firms. Second, in
comparison with the dependent variable (DV1)
adopted in the previous studies of [1] and [2],
alternative dependent variable (i.e., DV2) is also
employed to measure for corporate R&D intensity in the study for a robustness check.
Finally, the sample data in the study of [1] were limited to only one regional area (i.e., Chungcheong province), whose results were compared with those of other areas, But, the entire KOSDAQ-listed sample firms across all the provinces are employed in this study to be tested for each relevant hypothesis, as described later.
Second, it is of concern to identify whether or not, firms that have “conventionally” maintained lower R&D intensity with less growth potentials, may be currently in a transition to making more R&D expenditures than their counterparts with higher R&D intensity. Provided that ongoing development of newly sophisticated technologies on a global basis, that may be applied to various industrial products, it will be interesting to examine that firms in the former (or lower R&D intensity) may continue to make larger R&D investments than ever, to support new investment opportunities, as also described in [2]. Finally, financial components found to be statistically significant to determine a level of R&D expenditures, is expected to function as financial catalysts to test for an existence of optimal R&D intensity as for a future direction of this research. That is, a quadratic relationship between corporate R&D intensity and dependent variable of firm value may be tested in the future study by adopting all the aforementioned financial components in the model, as described in [5].
2. Literature Review
Concerning the previous literature related to the subject of corporate R&D intensity, major studies are chronologically reviewed, which have also been cited in the previous studies inclusive of [1] and [2].
In the study of [6], primary hypotheses were
tested to detect a relationship between benefits or costs of a firm’s R&D investments, and stock price of a firm by using the U.S. sample observations during the period of 1979 to 1985.
Systematic and financial components that may significantly influence a change of stock price were examined, on the basis of each type of R&D expenses. Results provided evidence that announcements of the increase of R&D expenditures are overall estimated to be positive information on the increase of firm value.
Moreover, both positive and negative earnings did not show their statistically significant differences to increase the value in the long-term basis. As for the study of [7], outcome obtained from the tests on the hypotheses revealed that corporate earnings seemed to be manipulated or artificially adjusted by incumbent management in the short-run basis, in case that projected earnings appears to be deviated from its original target.
The study presented that a linear relationship existed between a firm’s unexpected R&D spending and corporate earnings. The research done by [8] also presented that there has been an unprecedented or sudden increase in R&D investments for firms with headquarters in advanced or emerging capital markets during the two past decades. Regression model was applied to examine a relationship between annual operating income and R&D expenditures. The authors found that the average duration of benefits from R&D investment for the chemical and pharmaceutical industries in the U.S. capital market was estimated at 9 years, while the duration of R&D benefits in the scientific instruments industry was the shortest as 5 years.
Meanwhile, in the study of [9], a relationship between a rate of return of stock of firm and its R&D expenditures was empirically examined.
The sample data for the U.S. corporations
comprised all the firms listed on the stock
exchanges of NYSE, AMEX, or NASDAQ.
Methodologically, two variables to represent corporate R&D intensity were used such as the ratio of R&D expenditures scaled by either sales or market value of equity. When testing the former variable, there did not exist statistically significant difference between firms with and without R&D investments in terms of market reaction. The study also showed that the so-called as glamour stock spending higher R&D expenditures was found to earn a higher rate of return than its counterpart spending lower R&D outlays. In the research of [10], a trade-off relationship between the hypothetical effects was tested in the context of the bond market. That is, means and variances of expected cash flows, which are related to the benefits relevant to the
“mean” effect and risks relevant to the “variance”
effect, respectively, seems to offset each other in bond valuation. As for test results applying the SUR model, firm’s R&D spending defined as annual R&D expenditures showed its explanatory influence to affect bond price. Other control variables as determinants of bond risk, firm size showed a negative effect on the bond risk. As for the study done by [11], market reaction in terms of both long-term rate of return of stock and corporate operating performance were separately tested since corporate R&D activities were announced. Concerning the results for each subsample group comprising high-tech, low-tech, high-growth and low-growth firms, there were statistically significant abnormal rates of returns in all of the subsample groups, if measured by the equally weighted method. In the study of [12], hypothesis was postulated such that U.S. investors seem to favorably respond to positive prospects of high-tech firm’s R&D spending in terms of stock return before it announces a seasoned equity offerings issue.
Over-investors in high-tech firms seemed to outperform low-tech over-investors in terms of cumulative abnormal returns. They concluded that the U.S. capital market may favorably react
to positive discretionary R&D expenditures by high-tech issuers, if over-investments are made in the R&D activities.
The study by [13] generally analyzed the financial determinants of R&D expenditures for KOSPI-listed firms in the domestic capital market. In the first hypothesis test, conditional quantile regression model was applied to the sample firms during the post-era of the global economic crisis. Moreover, firms in the groups of relatively high- and low-R&D intensity were also compared to identify financial differences by applying a multinomial logistic model that also included firms without R&D outlay. The variables such as R&D spending of the prior year, firm size, business risk and advertising expense showed significant impacts to determine the R&D level from a statistical perspective. The study conducted in [17] investigates two primary hypotheses for the KOSPI-listed firms in relation to corporate R&D expenditure. In one of the hypotheses, financial factors which may discriminate between firms in high-growth and low-growth industries are empirically tested.
Results suggested that the explanatory variables
such as one-period lagged R&D expenses,
interaction term between the lagged R&D
intensity and type of industry, and advertising
expenses show significant influence on corporate
R&D intensity. Moreover, it is empirically found
that high-growth firms in the domestic capital
market, on average, have higher lagged R&D
intensity, profitability and foreign equity
ownership (FOS) than their counterparts in
low-growth sector, whereas low-growth firms
had higher market-value based leverage and
advertising expenses, respectively. Overall, the
results are expected to be applied to search for
an optimal level of R&D expenditure, which may
enhance shareholders' wealth as an ultimate goal
of corporate management.
3. Empirical Research Settings 3.1 Sampling Criteria and Proposed Variables
As an extension of the previous studies on the corporate R&D intensity such as [1] and [2], data collection criteria and proposed variables of this research follow the criteria in the studies for comparability and consistency. The criteria for sampling the data is reported in [Table1].
1. Data for all financial variables are available for at least nine years from the year 2010 to 2018 (for 9 years) since the global financial turmoil begun 2008.
2. Sample firms are listed on the KOSDAQ stock market at the end of the fiscal year of 2018.
3. Data are included in the population of the database of KisValue sourced by the NICE.
4. Firm belongs to one of the 25 domestic industries defined by the KSIC (Korea Standard Industry Code or the KRX (Korea Exchange) classifications.
5. All the financial data are collected on the basis of consolidated financial statements, if available.
6. Firms in the financial and regulated industries are excluded in the final sample data set.
Table 1. Sampling criteria for KOSDAQ-listed firms
To specify, the post-period is particularly adopted to mitigate any spillover effects associated with the financial crisis as described in the previous research. To summate, total 842 KOSDAQ-listed firms across the 25 domestic industries in the domestic capital market are finalized to be in the entire sample observations.
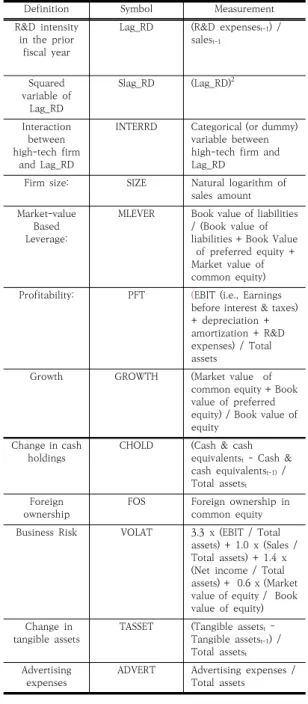
Meanwhile, proposed variables or predictors adopted to test for the relevant hypotheses are listed in [Table 2]. To enhance objectivity in selecting explanatory variables, this study takes in account of the following criteria, as also described in [1]. That is, the variable is supported by the theory of finance, while it may have conflicting or consistent results in the previous studies. All the data are available for each sample observation.
Definition Symbol Measurement
R&D intensity in the prior
fiscal year
Lag_RD (R&D expensest-1) / salest-1
Squared variable of
Lag_RD
Slag_RD (Lag_RD)2
Interaction between high-tech firm
and Lag_RD
INTERRD Categorical (or dummy) variable between high-tech firm and Lag_RD
Firm size: SIZE Natural logarithm of sales amount Market-value
Based Leverage:
MLEVER Book value of liabilities / (Book value of liabilities + Book Value of preferred equity + Market value of common equity) Profitability: PFT (EBIT (i.e., Earnings
before interest & taxes) + depreciation + amortization + R&D expenses) / Total assets
Growth GROWTH (Market value of common equity + Book value of preferred equity) / Book value of equity
Change in cash
holdings CHOLD (Cash & cash equivalentst - Cash &
cash equivalentst-1) / Total assetst
Foreign
ownership FOS Foreign ownership in
common equity Business Risk VOLAT 3.3 x (EBIT / Total
assets) + 1.0 x (Sales / Total assets) + 1.4 x (Net income / Total assets) + 0.6 x (Market value of equity / Book value of equity) Change in
tangible assets TASSET (Tangible assetst – Tangible assetst-1) / Total assetst
Advertising
expenses ADVERT Advertising expenses / Total assets
Table 2. List of proposed variables employed
To illustrate, two alternative dependent variables are employed to enhance validity of the results of the study. First dependent variable (i.e, DV1) is the ratio of R&D expenses scaled by sales, while the second one (DV2) is defined as the R&D expenses over market-value of assets.
Moreover, qualitative variables to represent the
24 domestic industries are employed in the model to test each relevant hypothesis. (The reference (or baseline) industry sets to be the food and beverage industry.) Moreover, as also described in [1], the entire sample firms listed on the KOSDAQ stock market are categorized into two sectors such as high-tech and low-tech ones, that are used to formulate the cross-product term (INTERRD). The term represents an interaction between corporate R&D intensity of the prior year (i.e., Lag_RD) and high-tech industry. Meanwhile, the criteria to divide into the two sectors are fundamentally compatible with those described in [14]. They are analogous to the guidelines set by the OECD. According to the guidelines, 8 industries among the total 25 industries are categorized into the high-tech sector for this study. These comprehend the chemistry, the pharmaceutical, the machinery, the electric and electronic, the medical precision, the transportation equipment, the professional science & technology service and the publishing, media & information service industries.
3.2 Hypothesis Postulations
In the section, three primary hypotheses relevant to corporate R&D intensity are postulated to be empirically tested.
<First Hypothesis>
H
0: During the post-period of the global financial turmoil begun in 2008, there may not exist any statistically discriminating financial components to determine corporate R&D intensity for KOSDAQ-listed firms which are categorized by conditional quantile regression (CQR) model.
In the first hypothesis test, the interval grouped by 20% percentile is used to separate the entire sample firms, that results in in 4 separate quantile (i.e., 20%, 40%, 60% and 80%) groups, each of which are then mutually compared with the outcome of the other quantiles. Along with the results of the CQR
model, those from the OLS model are presented in [Table 3]. As outlined in [15] on the CQR model, let yi, xi, (where i=1,. . .,n) be a sample from a population where xi is a (Kx1) vector of regressors. Assuming that the θth quantile of the conditional distribution of yi is linear in xi, CQR model is formulated as follows:
yi = xi'αθ + μθi
Quantθ (yi┃xi) ≡= {y: Fi(y┃x)θ} = xi'α Quantθ (μθi┃xi)= 0,
where Quantθ (yi┃xi) indicates the θth conditional quantile of yi on the regressor vector of xi'. αθ is the unknown vectors of parameters to be estimated for varying values of θ in (0,1). μ θ is the error term which is assumed to be a continuously differentiable c.d.f. Fμθ (.|x) and a density function fμθ(.|x). By varying the value of θ from 0 to 1, we trace the entire distribution of y conditional on x. The estimator for αθ is:
min ,
where ρθ(μ) is the check function as ρθ(μ) = θμ if μ ≥ 0, (θ-1)μ, otherwise.
The check function indicates that positive and negative values are asymmetrically assigned varying weights, according to the positive and negative residuals, and a linear programming method for optimization is applied to estimate each coefficients. It minimizes the weighted sum of absolute deviations between the dependent and the predictor variables, which is described in [16].
<Second Hypothesis>
H
0:KOSDAQ-listed firms whose values of R&D intensity (DV1) are above 35% range (among the total sample observations), may, have financially discriminating factors than their counterparts located in R&D intensity below 35% range during the sample period.
Firms in the former group within above 35%
range have values of R&D intensity (DV1) larger
than 0.015846, whereas those in the latter group
(within below 35% range) show the values less
than 0.000450142. To compare the two group,
Variable OLS Quantile (20%) Quantile (40%) Quantile (60%) Quantile (80%)
Constant 0.1331* 0.0000 0.0000 -0.0000 0.0055*
Slag_RD -0.1238* -0.0664* -0.1164* -0.1486* -0.1929*
Lag_RD 0.6179* 0.1490* 0.6011* 0.9369* 1.2771*
INTERRD 0.3162* 0.4886* 0.2941* 0.1237* 0.0113
SIZE -0.0050* -0.0000 -0.0000 -0.0000 -0.0002*
MLEVER -0.0086 -0.0000 0.0000 0.0000 -0.0000
PFT -0.0306* -0.0000 -0.0000 -0.0001 -0.0044*
GROWTH 0.0005* -0.0000 -0.0000 0.0000* 0.0002
CHOLD -0.0137 -0.0000 -0.0000 -0.0001 -0.0011
FOS 0.01075 0.0000 0.0000 -0.0000 0.0002
VOLAT -0.0001 0.0000 0.0000 -0.0000 0.0001
TASSET 0.0045 0.0000 0.0000 0.0001 0.0007
ADVERT -0.0103 0.0000 0.0000 -0.0002 0.0007
<Note> * indicates that the estimated coefficient is statistically significant at the 5% level.
Table 3. Results of the estimated coefficients of the explanatory variables on corporate R&D Intensity (DV1) for KOSDAQ-listed firms by applying conditional quantile regression (CQR) model during the sample period
models such as logit, probit and complementary log-log (CLOG) models, are employed to enhance robustness, as also applied in [1] and [2].
Finally, subsequent to the test of the first hypothesis, another tests utilizing the CQR model are separately applied to identify financial factors to discriminate R&D intensity for the sample firms that are divided into high-tech and low-tech sectors. To avoid redundancy or possible multicollinearity between industry classifications, dummy variables to represent industry classifications are not included in the hypothesis, in contrast to the second hypothesis.
<Third Hypothesis>
H
0: During the period between the year 2010 and 2018, the sample firms belonging to the high- (or low-) tech sector, may not possess financial factors to determine R&D intensity by applying the conditional quantile regression (CQR) model.
4. Analyses and Discussion 4.1 Results of First Hypothesis Test
With respect to outcome obtained from the tests of the first hypothesis, two alternative dependent variables such as DV1 and DV2 are separately employed for robustness checks, as previously described. The results are reported in [Table 3] and [Table 4]. Among the total 12 explanatory variables, Slag_RD, Lag_RD and INTERRD show their significant effects to determine both DV1 and DV2 across the models inclusive of the OLS one. Moreover, the variables are the same across the models, in terms of the sign of the estimated coefficient. One of the intriguing consequences presented in the tables, is that the magnitudes or values of the estimated coefficients are too minimal, that are close to
“0.0000“. The phenomenon may, in large part, arise from the fact that the levels of R&D expenditures (i.e., DV1 or DV2) esp., for the sample firms categorized into the lower quantiles, are close or equal to ”0“, in comparison with those of their counterparts positioned in upper quantiles.
Moreover, it seems to be empirically evident that
there exist nonlinear relationships between
Lag_RD and DV1, and Lag_RD and DV2, as
Variable OLS Quantile (20%) Quantile (40%) Quantile (60%) Quantile (80%)
Constant 0.0054 -0.0004* -0.0000 -0.0000 0.0023*
Slag_RD -1.4495* -1.6377* -2.0695* -1.5182* -1.8998*
Lag_RD 0.8304* 0.5153* 0.7996* 1.0183* 1.3250*
INTERRD 0.1091* 0.1594* 0.1191* 0.0800* 0.0314
SIZE -0.0002 0.0000* 0.0000 0.0000 -0.0001
MLEVER 0.0018* -0.0000 -0.0000 -0.0000 -0.0002
PFT 0.0117* 0.0004* 0.0000 0.0000 0.0004
GROWTH -0.0001 0.0000 -0.0000 0.0000 -0.0000
CHOLD -0.0085* -0.0001* -0.0000 -0.0000 -0.0011*
FOS 0.0009 -0.0000 0.0000 -0.0000 0.0002
VOLAT -0.0001* -0.0000* -0.0000 -0.0000 -0.0000
TASSET -0.0030* -0.0000 -0.0000 -0.0000 -0.0004
ADVERT 0.0194* -0.0002 0.0000 0.0000 0.0031
<Note> * indicates that the estimated coefficient is statistically significant at the 5% level.
Table 4. Results of the estimated coefficients of the explanatory variables on corporate R&D Intensity (DV2) for KOSDAQ-listed firms by applying conditional quantile regression (CQR) model during the sample period
indicated by the negative sign of the quadratic term of Lag_RD (i.e., Slag_RD) presented in [Table 3] and [Table 4].
4.2 Results of Second Hypothesis Test In the section, the results analyzed on a relative basis, are reported in [Table 5]. Based on the output, there are consistent phenomena across the models, such that Slag_RD, Lag_RD, SIZE, PFT and GROWTH are financially significant factors to discriminate between firms in the higher (i.e., within the upper 35 percentile) and the lower R&D intensity (i.e., within the lower 35 percentile). Given that probability modeled is the former group of firms set to be “1”, it is found that the probability to be classified into the latter group, becomes higher, if firm size (SIZE) gets larger. Moreover, even if industry effects are not reported in the above table due to the limitations of space in the study, 5 domestic industries found to be positive and statistically significant in all the models, include the chemistry, the pharmaceutical, the machinery, the electric and electronic, the medical precision industries during the investigated period.
4.3 Results of Third Hypothesis Test
As in [Table 6], the sample firms are grouped into two types of technological development (i.e., high-tech vs. low-tech sector). Only two explanatory variables (i.e., Slag_RD and Lag_RD) with opposite signs of the estimated coefficients, seem to have pronounced effects to determine the R&D intensity across all or the majority of the quantiles for low-tech and high-tech firms, respectively. As presented, a majority of the coefficients that are estimated at or close to
“0.0000“ in the table, seem to be largely
associated with the extremely low or zero R&D
intensity of the sample firms, esp., in the
low-tech sector. On the output estimated by the
usage of the statistical software package (i.e., SAS
9.4), it is presented that the values of t-statistics
of some of the variables in the sector, are not
derived for the low-tech sector. Meanwhile, the
outcome to test for equal coefficients of each
proposed variable, reveals that aforementioned
two variables have unequal coefficients across all
quantiles.
Variable
Test for equal
coefficients# Quantile (20%) Quantile (40%) Quantlie (60%) Quantile (80%)
H L H L H L H L H L
Constant <N.A.> <N.A.> 0.001 0.000 0.001 0.000 0.000 0.000 0.014* 0.000
Slag_RD 34.12* 0.68 -0.064* -0.219* -0.116* -0.354* -0.148* -0.448* -0.191 -0.603*
Lag_RD 34.12* 26.86* 0.623* 0.492* 0.892* 0.793* 1.058* 1.004* 1.277* 1.353*
SIZE 6.02 0.00 -0.000* 0.000 -0.000 0.000 -0.000 0.000 -0.001 -0.000
MLEVER 0.08 0.00 -0.000 0.000 0.000 0.000 0.000 0.000 0.001 -0.000
PFT 6.15 0.00 -0.001 0.000 -0.001 0.000 -0.001 0.000 -0.009* -0.000
GROWTH 0.47 0.00 -0.000 0.000 -0.000 0.000 0.000* 0.000 0.001 0.000
CHOLD 0.24 0.00 -0.000 0.000 -0.000 0.000 -0.000 0.000 -0.001 -0.000
FOS 0.09 0.00 -0.000 0.000 0.000 0.000 -0.000 0.000 0.001 0.000
VOLAT 0.41 0.00 0.000 0.000 0.000 0.000 -0.000 0.000 0.001 0.000
TASSET 4.38 0.00 0.001 0.000 0.000 0.000 0.001 0.000 0.001 0.000
ADVERT 0.45 0.00 0.001 0.000 0.001 0.000 -0.001 0.000 0.005 0.000
<Note> # indicates a statistic of chi-square for each corresponding variable to test for equal coefficients across quantiles. * denotes a statistical significance at the 5% level .
Table 6. Separate Results of the estimated coefficients of the explanatory variables on corporate R&D Intensity (DV1) for KOSDAQ-listed firms in the high-tech (H) and low-tech (L) sectors by applying the CQR model.
Proxy Variable Logit Probit CLOG
constant 1.513 2.803* 2.012*
Slag_RD 1366.5* 579.8* 217.7*
Lag_RD 84.963* 3.837* 4.322*
SIZE -0.166* -0.163* -0.168*
MLEVER -0.273 -0.375* -0.251
PFT 1.699* 1.913* 2.435*
GROWTH 0.077* 0.053* 0.046*
CHOLD -1.150* -0.480* -0.666
FOS 0.739 0.410 0.568*
VOLAT -0.003 0.001 0.001
TASSET 0.465 0.180 0.417
ADVERT -0.405 1.333 2.389
Goodness of Fit 3640.28* 2459.93* 2144.41*
<Note> Each coefficient is estimated by the maximum likelihood method. Test for overall goodness of fit is performed by the likelihood ratio test, while the Wald test is used to test for a significance of each individual coefficient.
* indicates a significance at the 5% level.
Table 5. Financial factors to discriminate between the sample firms with high and low R&D intensity (DV1)
4.2 Discussion
In regard to the analysis of the first hypothesis to identify financially important catalysts to determine corporate R&D intensity, it is
interesting to detect a quadratic relationship between Slag_RD and Lag_RD, as reported in [Table 3] and [Table 4]. By considering the opposite signs of the estimated coefficients between them, there seems to exist an optimal level of R&D intensity for the KOSDAQ-listed sample firms across all the quantiles, as discussed. In other words, current level of R&D intensity (i.e., DV1 and DV2) that was positively related to the R&D spending made in the prior fiscal year (i.e., Lag_RD), may decrease after attaining to a certain point, thereby implying the existence of an optimal level of R&D expenditures for the sample firm. The positively significant association between Lag_RD and current R&D intensity was also corroborated by the findings by [7] and [12] for the U.S. sample firms as well as [13] for the KOSPI-listed firms.
The latter study employing KOSPI-sample firms
showed consistent results with this study on the
positive relationship between the dependent
variables and INTERRD. That is, corporate R&D
outlays made in the previous year may increase,
in proportion to the current R&D level, only if
the firm belongs to the high-tech sector. Lastly, it is noteworthy that corporate profitability is found to be negatively related to the DV1 for the firms in the category of the 80% quantile in [Table 3].
Therefore, the phenomenon may suggest that the sample firms having sustained the highest level of R&D expenditures, may have less profitable investment opportunities related to R&D investments that are supported by corporate profit. Concerning the outcome of the second hypothesis test in [Table 5], there are several implications to be noted for, as follows.
First, across the models, the probability to be classified into the group maintaining a lower level of R&D intensity tends to be larger, if firm size (SIZE) gets bigger. The findings are not consistent with those obtained from [13] for the KOSPI-listed firms, that showed insignificant difference in firm size (as a proposed variable of R&D intensity) between the two comparison groups. The phenomenon may, in part, arise from the fact that firms with lower R&D intensity are more likely to be in the mature stage of business and large size (in sales) than their counterparts in the growth stage. Accordingly, firms in the former group may not need to spend larger amount of R&D expenditures than their counterparts to support growth potentials.
Higher growth opportunities anticipated by the latter group seem to be corroborated by the results of the positive and significant difference between the two groups across the models, in terms of GROWTH. Second, it is interesting to find an empirical result, such that firms in the higher R&D intensity maintain higher profitability (PFT) than those in the group of lower intensity. In the study by [8], positive relationships between corporate profit and R&D expenditures were found across the U.S. sample industries with different average duration of R&D benefits. The finding on PFT in this study may imply that KOSDAQ-listed firms with higher
intensity are more likely to provide their R&D
investments for supporting the aforementioned
growth potentials by means of internally
generated corporate earnings rather than
external financing such as issuing new equity or
new debt. In terms of Myers’ pecking order
theory in finance, the choice of these firms that
prefer internal fund over external financing,
seems to be reasonable to mitigate the
phenomenon of asymmetric information, that
may result in underpricing issue of external
financing. Third, in contrast the findings of [13],
there are positive linkage between Lag-RD and
Slag_RD across all the models, indicating that
non-linear relationship exists between R&D
intensity and Lag_RD, but it is a positive
quadratic one. The results may suggest that, as
KOSDAQ-listed firms continue to increase their
R&D investments in the prior fiscal year, the
probability to be classified into the group of
higher R&D expenditures in the current year will
be more expedited. Finally, amongst total 8
domestic industries classified into the high-tech
sector, only 5 industries such as the chemistry,
the pharmaceutical, the machinery, the electric
and electronic, the medical precision industries,
are found to maintain higher R&D intensity
during the sample period. Therefore, the other 3
industries such as the transportation equipment,
the professional science & technology service
and the publishing, media & information service
industries, seem to be in transition to attaining to
higher R&D intensity to support their future
growth potentials. In regard to the consequences
of the last hypothesis test, only a few variable
such as Slag_RD and Lag_Rd, reveal their
pronounced effects (with opposite directions of
the sign) to affect current levels of R&D intensity
across all quantiles. Therefore, from a statistical
perspective, possibility of the existence of an
optimal R&D intensity that was presented in the
first hypothesis, seems to be corroborated by
these results that are separately derived on the
basis of both types of technological development.
Even if a majority of the proposed variables do not show their importance to determine corporate R&D intensity, it is interesting to identify a inverse and significant relationship between PFT and DV1 in the 80% quantile. The result may corroborate the finding in the first hypothesis, implying that KOSDAQ-listed firms, esp., in the high-tech sector, spending the largest R&D expenditures among the total quantiles, seem to possess less profitable investment opportunities supported by R&D outlays.
4. Concluding Remarks
This study addresses one of the contemporary issues in finance, that may recently draw more attention in the domestic capital market. That is, further analyses on the financial determinants of corporate R&D intensity are conducted for the KOSDAQ-listed sample firms during the post-period of the global economic crisis, as an extension of the previous literature such as [1]
and [2]. By applying a conditional quantile regression model, variables such as Slag_RD, Lag_RD and INTERRD, show their pronounced effects on both DV1 and DV2. More than a half of the total variables are found to have financially discriminating power between the firms with high and low R&D intensity in the second hypothesis. In spite of the legitimate weaknesses from which most empirical research may suffer in terms of different research settings, the results obtained from this study are expected to be applied well. That is, the findings may function as financial catalysts to increase firm value by adjusting themselves to achieve optimal levels of corporate R&D intensity for the KOSDAQ-listed firms, given the ongoing plans to invest in R&D activities at the government and corporate levels.
References
[1] H. Kim, “Financial Attributes of Research &
Development Expenditures for KOSDAQ Listed Firms with Headquarters in Chungcheong Province in the Korean Capital Market”, Journal of International Trade & Commerce, vol.15, no.4, pp. 125-143, 2019.
DOI: http://dx.doi.org/10.16980/jitc.15.4.201908.125 [2] H. Kim, “Further Analyses on Corporate Research &
Development Intensity for Firms Listed on the KOSDAQ Stock Market”, Unpublished Working Paper, 2020.
[3] Ministry of Science and ICT (2016), Report on the 2016 R&D Activities [Internet]. Available From:
https://www.msit.go.kr/web/msipContents/contentsVi ew.do?cateId=_policycom2&artId=1368919 (accessed Nov. 8, 2018)
[4] Ministry of Science and ICT (2019), Report on the Plan of Technological Development of NANO and Core Components in 2020 [Internet].Available From:
https://www.msit.go.kr/web/msipContents/contentsVi ew.do?cateId=_policycom2&artId=2429173 (accessed Dec. 23, 2019)
[5] C. Martinez-Sola, P. Garcia-Teruel, and P.
Martinez-Solano, "Corporate Cash Holding and Firm Value", Applied Economics, vol.45, no.2, pp. 161-170, 2013.
DOI: https://doi.org/10.1080/00036846.2011.595696 [6] S. Chan, K. Martin, J. Kensinger, “Corporate Research
and Development Expenditures and Share Value,”
Journal of Financial Economics, vol.26, pp. 255-276, 1990.
DOI: https://doi.org/10.1016/0304-405X(90)90005-K [7] S. Perry and R. Grinaker, “Earnings Expectations and
Discretionary Research and Development Spending,”
Accounting Horizons, vol.8, no.4, pp. 43-51. 1994.
[8] B. Lev, T. Sougiannis, "The Capitalization, Amortization, and Value-relevance of R&D,” Journal of Accounting and Economics, vol.21, pp. 107-138, 1996.
DOI: https://doi.org/10.1016/0165-4101(95)00410-6 [9] L. Chan, J. Lakonishok, T. Sougiannis, “The Stock
Market Valuation of Research and Development Expenditures,” Journal of Finance, vol.56, no.6, pp.
2431-2456, 2001.
DOI: https://doi.org/10.1111/0022-1082.00411 [10] C. Shi, "On the Trade-off between the Future Benefits
and Riskness of R&D: a Bondholders' Perspective,"
Journal of Accounting and Economics, vol.35, pp.
227-254, 2003.
DOI: https://doi.org/10.1016/S0165-4101(03)00020-X [11] A. Everhart, W. Maxwell, A. Siddique, “An Examination
of Long-term Abnormal Stock Returns and Operating Performance Following R&D Increases,” Journal of Finance, vol.59, no.2, pp. 623-650, 2004.
DOI: https://doi.org/10.1111/j.1540-6261.2004.00644.x [12] H. Quin, K. Zhong and Z. Zhong, “Seasoned Equity
Issuers’ R&D Investments: Signaling or Overoptimism,”
Journal of Financial Research, vol.35, no.4, pp.
553-580, 2012.
DOI: https://doi.org/10.1111/j.1475-6803.2012.01328.x [13] H. Kim, “Conditional Quantile Regression Analyses on
the Research & Development Expenses for KOSPI-listed Firms in the Post-era of the Global Financial Turmoil”, Journal of the Korea Contents Association, vol.18, no.4, pp.444-453, 2018.
DOI: https://doi.org/10.5392/JKCA.2018.18.04.444 [14] D. Czarnitzki and S. Thorwarth, “Productivity Effects
of Basic Research in Low-Tech and High-Tech Industries”, Research Policy, vol.4, no.9, pp.
1555-1564, 2012.
[15] B. Fattouh, P. Scaramozzino, and L. Harris, “Capital Structure in South Korea: a Quantile Regression Approach,” Journal of Development Economics, Vol.76, No.1, pp.231-250, 2005.
DOI: https://doi.org/10.1016/j.jdeveco.2003.12.014 [16] W. Nelson and B. Arshanapalli, “Using Quantile
Regressions to Examine the Capital Structure Decision of US Firms,” Global Conference on Business and Finance Proceedings, Vol.9, No.1, pp.321-328, 2014.
[17] H. Kim, “Further Examinations on the Financial Aspects of R&D Expenditure For Firms Listed on the KOSPI Stock Market,” Journal of the Korea Academia-Industrial Cooperation Society, Vol.19, No.4, pp.446-453, 2018.
DOI: https://doi.org/10.5762/KAIS.2018.19.4.446
Hanjoon Kim [regular member]
• Feb., 1985 : Yonsei Univ., Seoul.
• Sept., 1987 : The George Washington Univ., MBA, U.S.A.
• Jan., 1999 : Boston University DBA (Major: Finance), U.S.A.
• Mar. 2010 ∼ Present: Hoseo Univ. Dept. of Business Administration. Professor
<Research Interests>
Corporate Finance, M&A