Print ISSN: 2288-4637 / Online ISSN 2288-4645 doi:10.13106/jafeb.2021.vol8.no4.0001
The Effect of Non-Oil Diversification on Stock Market Performance:
The Role of FDI and Oil Price in the United Arab Emirates
*Rachna BANERJEE1, Sudipa MAJUMDAR2
Received: November 30, 2020 Revised: February 20, 2021 Accepted: March 02, 2021
Abstract
UAE has rapidly developed into one of the leading global financial hubs, with significant transformations in its stock exchanges. In its attempt at economic diversification in the last two decades, the country has also taken a lead in the GCC region in introducing extensive reforms to attract FDI to the Emirates. However, oil price volatilities have posed a significant challenge to all oil-exporting countries. The main aim of this study is to explore the impact of economic diversification and oil price on the UAE stock market. The study applies Granger Causality and Vector Autoregressive Model on monthly Abu Dhabi stock exchange index, Dubai Fateh crude oil spot price, and FDI inflows during 2001–19. The short-term interbank rate has been included as a monetary policy variable. The results show a substantial difference between the two phases of reforms. Oil price and Abu Dhabi stock index show bidirectional relationship during 2001–09 but no causality was found during 2010–19. Furthermore, the second phase was characterized by unidirectional causation from FDI to ADX index. This study highlights FDI inflows as a key driver of stock market performance during the last decade and emphasizes the success of the intense reforms in the UAE initiated for the diversification of its economy.
Keywords: Abu Dhabi Stock Exchange, Oil Price, Foreign Direct Investment, Times Series Modelling, United Arab Emirates JEL Classification Code: B26, C32, F21, G120, Q43
to trade in international stocks. With a modern trading system, sophisticated working mechanisms, and robust organizational structure, the stock markets have continued their efforts in bringing themselves in line with international best practices.
DFM, established in March 2000, was the first to have offered its shares through an IPO in the Middle East. ADX was established in November 2000 and currently has 69 companies are listed on the stock market, experiencing impressive growth in investments from expatriate investors from the UK, USA, and Luxembourg. ADX is recognized for the positive impact of its Innovation Strategy and the rapid and responsible measures it has taken to ensure business continuity during the pandemic outbreak. The total trading value on ADX during the first half of 2020 was AED 41 billion with a market capitalization of AED 495 billion, as of June 2020. In May 2020, ADX won the Best Trading Innovation Excellence – Gulf Cooperation Council (GCC) Award for its innovation in developing a range of digital products and initiatives, the most notable being its digital wallet ‘Pay it’ (ADX, 2020).
Stock market performance in all GCC countries has witnessed fluctuations in the past two decades in response
*Acknowledgments:
This research project is supported by Abu Dhabi Exchange under the research grant titled “ADX Research Award & Zayed Center of Excellence for Finance Research 2019”. We thank the management who provided insight and expertise that assisted the research.
1 First Author and Corresponding Author. Assistant Professor, Business Department, Higher Colleges of Technology, United Arab Emirates [Postal Address: Dubai Women’s Campus, Al Qusais, Dubai, P.O Box. 16062, United Arab Emirates]
Email: [email protected]
2 Senior Lecturer, Business Department, Middlesex University Dubai, United Arab Emirates. Email: [email protected]
© Copyright: The Author(s)
This is an Open Access article distributed under the terms of the Creative Commons Attribution Non-Commercial License (https://creativecommons.org/licenses/by-nc/4.0/) which permits unrestricted non-commercial use, distribution, and reproduction in any medium, provided the original work is properly cited.
1. Introduction
United Arab Emirates (UAE) has rapidly developed into
one of the leading global financial hubs, with significant
reforms in its stock exchanges, namely Abu Dhabi Stock
Exchange (ADX), Dubai Financial Market (DFM), and
NASDAQ Dubai. DFM and ADX primarily list UAE
companies whereas NASDAQ Dubai was set up in 2005
improve liquidity and levels of activity in the stock markets.
First, companies were allowed to buy back 10% of their own shares, replacing the mandate where such buyback was allowed only if the value of shares fell below book value.
Second, foreigners were allowed to invest in UAE stock markets that improved its GDP through foreign direct and institutional investments (Awartani & Maghyereh, 2013) and a commensurate rise in the stock prices as well. The markets were then adversely affected by the financial crisis in 2008–09 when ADX recorded a 70 percent fall while DFM suffered 43 percent in terms of trading values (Paltrinieri, 2015). Another new legislation in 2010 made it easier for companies to launch initial public offerings by floating as little as 30 percent of their shares (down from 55 percent) which resulted in a significant stock market recovery during the 2010–2013 period. In 2013, a major boost to the UAE capital market was the grant of the ‘Emerging Market’ status by Morgan Stanley Capital International (MSCI), which marked a new era in facilitating long-term capital flows and access to foreign funds.
movement were not in tandem.
During the last decade, UAE witnessed impressive growth in foreign direct investment (FDI) inflows (2.7% of GDP) while the average inflows into GCC fell from 4.8% of GDP in 2007 to below 2% in 2017 (ADX, 2020). A major regional FDI policy reform in 2004 was marked by the formulation of National Investment Reform Agendas (NIRA), which was then implemented by the UAE government in 2007.
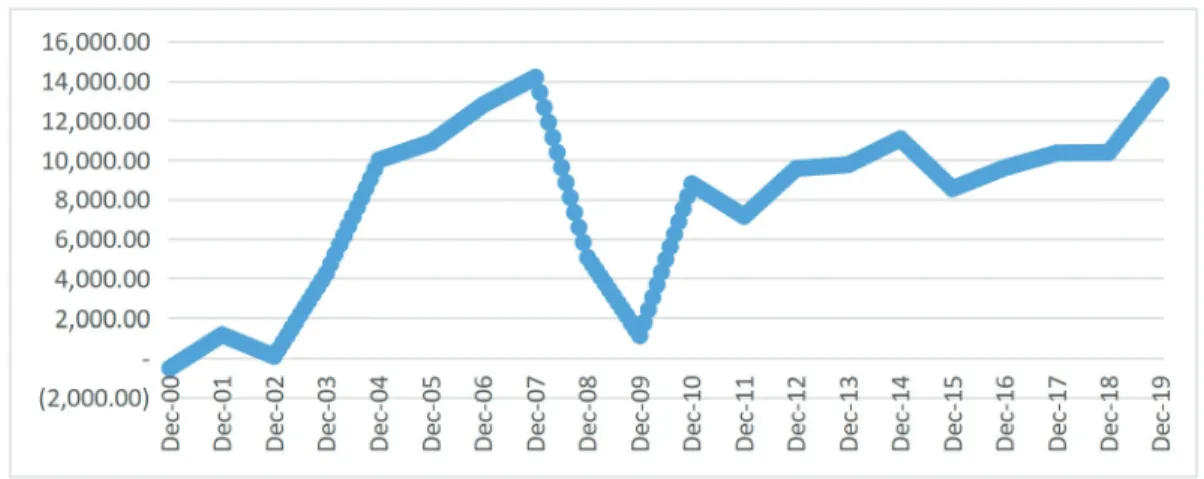
Following the slump in investments during the financial crisis, the UAE Government began to encourage FDI into the country by signing 40 bilateral investment treaties during 2010–14 (ADX, 2020). Consequently, FDI inflows attained an average growth rate of 16.4 percent accompanied by a spike in the stock market index to touch AED 5,253.41 in May 2014 (Figure 2). Another major initiative came with a new law in September 2018 that allowed 100% foreign ownership of UAE limited companies outside the free trade zones, removing the foreign investment restriction of 49%.
In 2019, UAE became the largest recipient of FDI in the Middle East, accounting for 50% of the total inflows in the
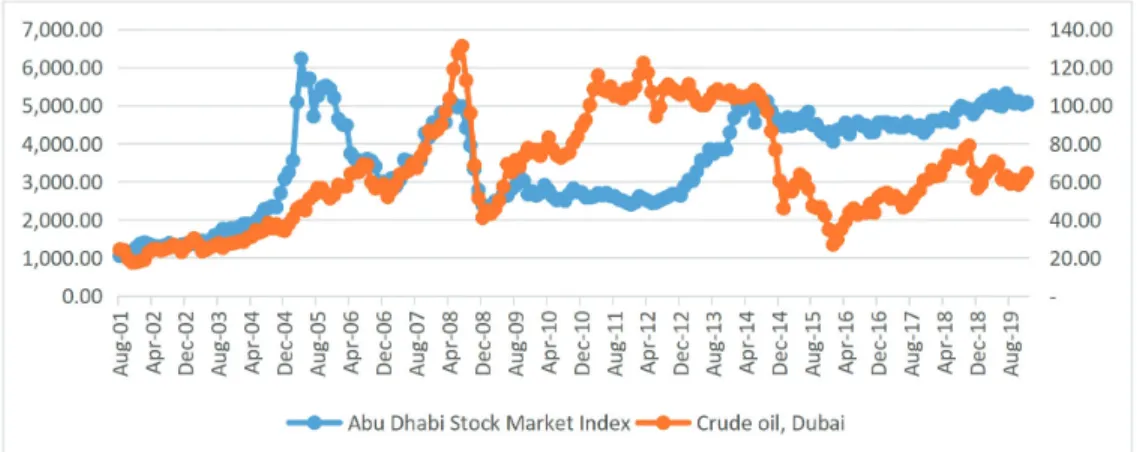
Figure 1: ADX Index Versus Dubai Fateh Crude Oil Spot Price Per Barrel from 2001–2019 Source: Abu Dhabi Securities Exchange (www.adx.ae);
World Bank Commodity Price Data (https://www.worldbank.org/en/research/commodity-markets)
region, amounting to $13,787 million (UNCTAD, 2020).
UAE further consolidated its commitment to FDI growth by launching the Abu Dhabi Investment Office under Ghadan 21 program (UAE Economic Bulletin, 2020). The new laws, thus, helped in removing the existing legal barriers to FDI inflows into non-oil sectors like real estate, retail, financial services, and manufacturing.
The spate of major policy reforms relating to the UAE stock markets in the past two decades contributed to the vibrancy of the local bourses and explains the relevance of our research. This research augments the existing literature by extending the econometric analysis into a multivariate time-series model since past studies had often ignored FDI considerations in investigating the stock market-oil relationship. Further, the diversification policy reforms in the UAE were explored for two separate periods, 2001–09 and 2010–19.
The rest of the paper is structured as follows. The following section presents a review of the existing literature on related studies. The data and research methodology is described in Section 3 and 4 respectively. Section 5 presents the discussion and implications of the research. Our main conclusions are highlighted in Section 6 along with directions for future research.
2. Literature Review
Extant research on the oil price and stock market performance interaction encapsulates changes like this relationship based on a country’s industrial structure, its net position in the global oil market, and demand-supply forces within the oil sector with few studies showing the effect of FDI on stock market development. In the context of developed economies with deep financial markets, Jones
and Kaul (1996) found negative relationships for the USA, Canada, and UK stock prices, as did Kaneko and Papapetrou (2001) for Greece while European stock indices confirmed a significant positive effect of oil and gas sector on stock returns (Bagirov & Mateus, 2019).
For developing countries, extensive research has been carried out in Asian and African countries. Oil price shocks have shown a significant positive impact on real stock returns of most Chinese stock market indices before the financial crisis but negative effects during the 2007–17 period (Xiao et al., 2018). For India, there was no long-run relationship between crude oil prices and market indices (Nifty for overall market index and BSE Energy for the energy sector), while the impulse functions for BSE Energy showed a negative impact of lagged values of oil future prices (Sharma et al., 2018).
Earlier, Chittedi (2012) confirmed a long-run relationship in India, with stock index volatilities influencing oil prices.
Kenneth et al. (2019) used the Autoregressive Distributive Lag model and Bound testing approach for Nigeria and showed a positive significant effect of oil price on the stock market, in line with the results from Ghana stock returns (Lin et al., 2014).
Within the Middle Eastern studies, there are contradictory views on the association between oil price and GCC stock markets. Arouri and Rault (2010) examined long‐run links between oil prices and stock markets in Gulf Cooperation Council (GCC) using recent bootstrap panel cointegration techniques and seemingly unrelated regression (SUR) methods. Since GCC countries are major world energy market players, their stock markets are likely to be susceptible to oil prices. They showed that there is evidence for cointegration between oil prices and stock markets in GCC countries, while the SUR results indicate that oil price increases have a positive impact on stock prices, except in Saudi Arabia.
Figure 2: Net FDI Flows in UAE (In Million Dollars) from 2001–2019 Source: data.worldbank.org
stock returns was found, signifying that the performance of the ADX index continued to be influenced by oil price volatility (Hammoudeh & Aleisa, 2002).
The effect of FDI on stock market development also remains ambiguous. In line with this argument, Malik and Amjad (2013) found a positive impact of FDI on the Pakistani during 1985–2011. In complete contrast. They concluded that countries that are riskier, financially underdeveloped, and institutionally weaker have a higher inflow of FDI. Effects of exogenous macroeconomic variables have been explored in the context of the stock market and oil price associations (Conrad et al., 2014) establishing that interest rates and stock prices are closely related. An increase in interest rate tends to have an adverse impact on corporate profitability and stock market returns through an increase in the cost of capital.
Conversely, a fall in real interest rates is associated with an expansionary monetary policy whereby businesses expand their operations and increase their future income stream resulting in higher stock prices (Shiller, 1981). Filis and Chatziantoniou (2014) used the IS-LM model to explain that short-term interest rates may be used as a monetary tool to tackle demand-side inflation in oil-exporting countries since a fall in interest rates causes expansion of investments with a positive impact on stock market performance.
Alam and Uddin (2009) studied fifteen developed and developing countries and found a significant negative relationship between the interest rate and share price for all the countries. Ologunde et al. (2006) found that interest rate was a key positive determinant of share price movements in Ghana and Nigeria. They argued that lending interest rates from deposit money banks exerted an adverse effect on Ghanaian stock market performance.
Our research investigates the association between oil price movement and the ADX stock market index under the influence of macroeconomic factors, namely FDI inflows and the Central Bank monetary policy indicator (EIBOR) as a proxy for the monetary policy variable. Although causal relationships between oil prices, interest rates, and FDI have been examined separately by previous researchers in
Yt
= α
10+ α
11. Y
t−1+ ... + α
1p. Y
t−p+ β
11. X
t−1+ ... + β
1p. X
t−p+ u
1tXt
= α
20+ α
21. Y
t−1+ ... + α
2p.Y
t−p+ β
21. X
t−1+ ... + β
2p. X
t−p+ u
2t(1)
Our dataset includes the interaction between four variables, as follows:
i. Stock market index (ADX): Monthly data on the stock market index has been used for the ADX index from August 2001 to December 2019. August 2001 marked the first trading data on the Abu Dhabi Stock Exchange. Stock market data was obtained from the Abu Dhabi Securities Exchange website.
ii. Oil Prices (OIL): Data for the Dubai Fateh crude oil spot price per barrel (in USD) was procured from the World Bank Commodity Price database
iii. Interest rate (EIBOR): The interest rate was included as the monetary policy variable, represented by the Emirates Interbank Offered Rate (EIBOR). We used the three-month short term inter-bank rate released by the UAE Central Bank.
iv. Foreign Direct Investment (FDI): Net FDI inflows (in USD) was sourced from World Bank country indicators.
The time series model with our 4–variable (k = 4) case transforms into
ADX
t= f (∑ADX
t−n, ∑OIL
t−n, ∑EIBOR
t−n, ∑FDI
t−n) OIL
t= f (∑ADX
t−n, ∑OIL
t−n, ∑EIBOR
t−n, ∑FDI
t−n) EIBOR
t= f (∑ADX
t−n, ∑OIL
t−n, ∑EIBOR
t−n, ∑FDI
t−n) FDI
t= f (∑ADX
t−n, ∑OIL
t−n, ∑EIBOR
t−n, ∑FDI
t−n)
(2)
Based on our observation of the co-movement of oil
price and stock index (Figure 1) and, a rebound in FDI
inflows from 2010–2019 compared to 2006–2009 (Figure 2), a structural change is evident in the UAE, with increased intensity in FDI reforms, initiatives by ADX and the constant volatilities in oil price. We incorporated the structural change in our analysis by splitting the full sample into two sub-periods, 2001–2009 and 2010–2019.
4. Research Methodology 4.1. Time Series with Stationarity
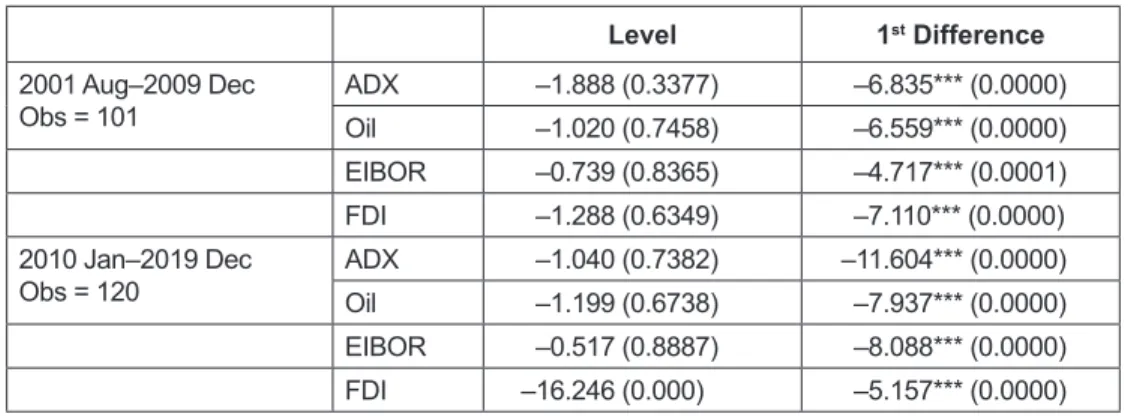
We seek to model the time series during the two sub- periods separately. The data on the stock prices, oil prices, and FDI inflows were first transformed by taking their natural logarithms to reduce the variance in the datasets. Stationarity in the series, at levels and first-differences, was investigated using the augmented Dickey and Fuller test. The ADF results at the levels show that the data contain unit roots and is non- stationary for both the periods in our time series (Table 1).
Only FDI was stationary at the level. To smoothen the data, first-order differences were taken on the sequences and
Table 1: Augmented Dickey-Fuller (ADF) Stationarity Test
Level 1st Difference
2001 Aug–2009 Dec
Obs = 101 ADX –1.888 (0.3377) –6.835*** (0.0000)
Oil –1.020 (0.7458) –6.559*** (0.0000)
EIBOR –0.739 (0.8365) –4.717*** (0.0001)
FDI –1.288 (0.6349) –7.110*** (0.0000)
2010 Jan–2019 Dec
Obs = 120 ADX –1.040 (0.7382) –11.604*** (0.0000)
Oil –1.199 (0.6738) –7.937*** (0.0000)
EIBOR –0.517 (0.8887) –8.088*** (0.0000)
FDI –16.246 (0.000) –5.157*** (0.0000)
Note: Figures in parentheses indicate the p-values.
***indicates significance at 99% level of confidence.
Ho = Variable has a unit root.
Table 2: Johansen Test for Cointegration Max
Rank Parameters Lag
Length Eigen
Value Trace
Statistic 5% Critical Value 2001 Aug–2009 Dec
Obs = 101 0 20 268.37 36.4954* 47.21
1 27 276.26 0.14729 20.7208 29.68
2 32 282.11 0.11145 9.0223 15.41
2010 Jan–2019 Dec
Obs = 120 0 20 611.29 42.0855* 47.21
1 27 622.91 0.17876 18.8466 29.68
2 32 629.42 0.10454 5.8177 15.41
the ADF test on the first-differenced data confirmed the stationarity of the series for both periods (Table 1). This fulfills the requirement for carrying out our time series modeling for the first differenced logarithmic series.
4.2. Diagnostic Tests for Time Series Analysis With stationarity at the first difference, we needed to establish the suitability of the Vector Autoregressive (VAR) model or Vector Error Correction Model (VECM) in our time series data by implementing Johansen’s ‘trace’ statistic method to identify the number of co-integrating equations.
The output in Table 2 shows the rejection criteria is at a 95% significance level such that the rejection of the null hypothesis (H0: no co-integrating equations) is indicated by the ‘*’ in the trace statistic. Our results confirm that there was no identifiable long-term co-integrating relationship between the variables.
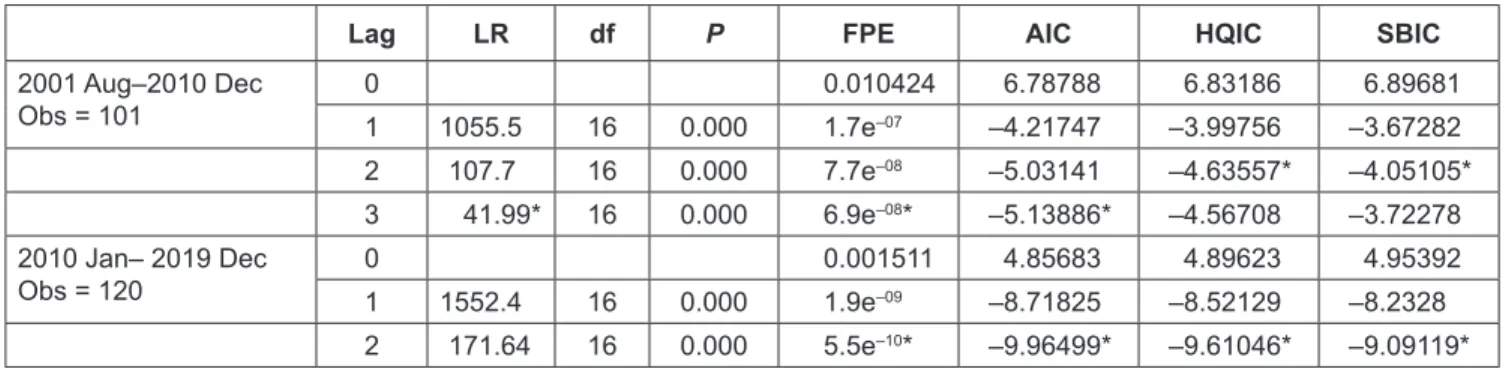
Model selection criteria further require the explicit choice
of lag length in the equations. If one chooses too many lags,
there would be a loss of degrees of freedom, while too few
Table 3: Selection-Order Criteria: Likelihood Ratio Test
Lag LR df P FPE AIC HQIC SBIC
2001 Aug–2010 Dec
Obs = 101 0 0.010424 6.78788 6.83186 6.89681
1 1055.5 16 0.000 1.7e–07 –4.21747 –3.99756 –3.67282
2 107.7 16 0.000 7.7e–08 –5.03141 –4.63557* –4.05105*
3 41.99* 16 0.000 6.9e–08* –5.13886* –4.56708 –3.72278
2010 Jan– 2019 Dec
Obs = 120 0 0.001511 4.85683 4.89623 4.95392
1 1552.4 16 0.000 1.9e–09 –8.71825 –8.52129 –8.2328
2 171.64 16 0.000 5.5e–10* –9.96499* –9.61046* –9.09119*
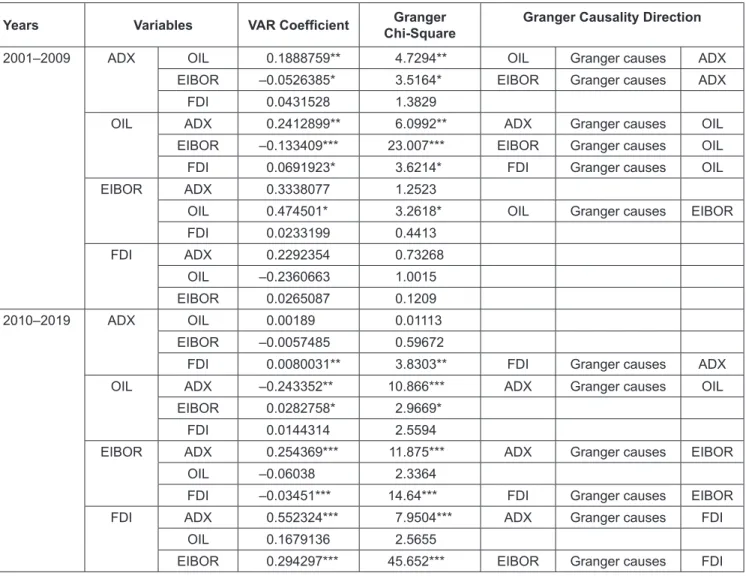
In the absence of any long-term co-integrating relationship, we proceeded to estimate the Vector Autoregressive (VAR) model at lag 2 involving all four variables. Further, to determine the short-term causal relationships between the variables, the Granger Causality tests were carried out. A variable ‘x’ is said to Granger-cause a variable ‘y’ if past values of ‘x’ are useful for predicting ‘y’.
A common method for testing Granger causality is to regress
‘y’ on its own lagged values and lagged values of ‘x’ and test the null hypothesis that the estimated coefficients on the lagged values of ‘x’ are jointly zero. Failure to reject the null hypothesis is equivalent to failing to reject the hypothesis that ‘x’ does not Granger-cause ‘y’. For each equation, Granger Causality tests the hypotheses that each of the other endogenous variables does not Granger-cause the dependent variable in that equation. The results have been collated and presented in Table 4.
For 2001–2009, the VAR coefficients along with Granger Chi-square statistics show a positive bi-directional relationship between oil and stock prices in the UAE (at 95% level of significance) while EIBOR had a negative effect on stock prices (at 90% level of significance). FDI did not granger cause ADX in this period. Moreover, oil prices were found to be significantly influenced by all three variables in the first half of our study. The results in the
first decade of our study represents the non-diversification phase in UAE, where the oil-GDP constituted a substantial share of the government revenues along with significant oil dependency. Although this period witnessed early reforms in FDI and the stock market, it is evident that the stock market was highly integrated with the oil market and vulnerable to oil price volatility. Furthermore, a unidirectional causality from interest rate to stock market during 2001–09 was also found by Pradhan et al. (2015) for G-20 countries. We find a negative association of interest rate with stock prices. This may be because the historically low Fed rates kept interest rates low in the UAE, thereby attracting foreign investments due to lower borrowing costs.
An analysis of the 2
ndperiod highlights that FDI inflows
significantly influenced ADX performance. The 2010–2019
phase was marked by major reforms in FDI aimed at a
diversified economy and efforts by the regulators were
focused on moving away from oil dependency. Our results on
bidirectional causality between stock market development
and FDI were consistent with the regulatory reforms, as
was confirmed for emerging market studies by Otchere
et al. (2015). We argue that an increase in FDI inflows may
have been in sectors with greater influence on the stock
market, causing the upward trend in the ADX index during
this phase.
Table 4: Vector AutoRegression (VAR) with Granger Causality Wald Test
Years Variables VAR Coefficient Granger
Chi-Square Granger Causality Direction
2001–2009 ADX OIL 0.1888759** 4.7294** OIL Granger causes ADX
EIBOR –0.0526385* 3.5164* EIBOR Granger causes ADX
FDI 0.0431528 1.3829
OIL ADX 0.2412899** 6.0992** ADX Granger causes OIL
EIBOR –0.133409*** 23.007*** EIBOR Granger causes OIL
FDI 0.0691923* 3.6214* FDI Granger causes OIL
EIBOR ADX 0.3338077 1.2523
OIL 0.474501* 3.2618* OIL Granger causes EIBOR
FDI 0.0233199 0.4413
FDI ADX 0.2292354 0.73268
OIL –0.2360663 1.0015
EIBOR 0.0265087 0.1209
2010–2019 ADX OIL 0.00189 0.01113
EIBOR –0.0057485 0.59672
FDI 0.0080031** 3.8303** FDI Granger causes ADX
OIL ADX –0.243352** 10.866*** ADX Granger causes OIL
EIBOR 0.0282758* 2.9669*
FDI 0.0144314 2.5594
EIBOR ADX 0.254369*** 11.875*** ADX Granger causes EIBOR
OIL –0.06038 2.3364
FDI –0.03451*** 14.64*** FDI Granger causes EIBOR
FDI ADX 0.552324*** 7.9504*** ADX Granger causes FDI
OIL 0.1679136 2.5655
EIBOR 0.294297*** 45.652*** EIBOR Granger causes FDI
Note: ***significant at 99% level of confidence.
**significant at 95% level of confidence.
*significant at 90% level of confidence.
Our result on causality from ADX to FDI highlights the importance of stock market performance for FDI. In this context, Zhao et al. (2017) pointed out the tendency of FDI to seek financially developed systems, support the argument that countries with well-developed financial markets seem to gain significantly from FDI. Moreover, UAE’s re-classification from frontier market to emerging market status by FTSE in 2010 and MSCI in 2014 may have attracted long term and stable FDI flows during the past decade in response to the non-oil diversification policy reforms by the Government.
It was interesting to note the significant causal effect from ADX to EIBOR. Although UAE does not have its independent monetary policy since the exchange rate is
pegged to the US Dollar, this relationship indicates that stock market performance in the local bourse gives a signal for an increase or decrease in short-term interest rates. This seems to be followed by the UAE Central Bank for the repo market transactions and gets reflected in the inter-bank offered rates during its open market operations.
Another important outcome of our analysis was the
fact that there was no association between oil and ADX, as
revealed by the VAR coefficients and the Granger Causality
Wald test statistics during this period. This strongly suggests
that the dependency of stock market performance on the
oil market ceases to exist, emphasizing the success of the
diversification program drive. Our result contradicts Cheikh
et al. (2018) who studied the Gulf stock market returns
performance. The main aim of this research was to examine the effect of oil price movement on stock market performance from 2001 to 2019 by exploring the relationship in the context of FDI inflows and interest rate movements. Further, to capture the diversification drive and policy reforms in the UAE since 2010, we investigated the oil price-stock index nexus for two separate phases 2001–2009 and 2010–2019.
The evidence of a short-term two-way relationship between oil price and the stock market during the 1
stphase revealed the vulnerability of ADX to oil price movement and significant oil- stock market integration. This period was also characterized by stock market sensitivity to interest rates while the influence of FDI was not evident. In complete contrast, the 2
ndphase was marked by a bi-directional association of stock price with FDI which strongly evidences that stock market reforms have been a driver of economic growth through increased FDI inflows and vice versa. Our study confirms that the financial reforms initiated by the UAE government and market regulator for stimulating the capital market have successfully protected the stock market from any contagion effect of the oil price shock during 2016–17. Economic diversification through increased FDI inflows in non-oil sectors has brought desirable results concerning the sustainability of the stock market.
In terms of policy implications, results from the 2
ndperiod suggest that promoting FDI in a wider range of sectors may give a further boost to the stock market performance in UAE. If the market regulator and policymakers work towards better market transparency, improving the liquidity of its market, and market liberalization, it could attract and retain long-term foreign investors leading to more stability in its markets and economy. In this context, maintaining its emerging Market status is crucial to UAE to reap benefits from its diversification efforts and FDI inflows.
Future studies may investigate the structural break by incorporating other relevant macroeconomic events that may have an influence on the stock market-oil and stock- FDI interactions. The effect of foreign institutional investors on oil- stock interaction may reveal interesting insights
and Management, 4(3), 43–51. https://doi.org/10.5539/ijbm.
v4n3p43
Arouri, M. E. H., & Rault, C. (2012). Oil prices and stock markets in GCC countries: Empirical evidence from panel analysis.
International Journal of Finance and Economics, 17(3), 242–253.
Awartani, B., & Maghyereh, A. I. (2013). Dynamic spillovers between oil and stock markets in the Gulf Cooperation Council Countries. Energy Economics, 36(C), 28–42. https://doi.
org/10.1016/j.eneco.2012.11.024
Bagirov, M., & Mateus, C. (2019). Oil prices, stock markets and firm performance: Evidence from Europe. International Review of Economics and Finance, 61, 270–288. https://doi.
org/10.1016/j.iref.2019.02.007
Cheikh, N. B., Naceur, M. S. B., Kanaan, M. O., & Rault, C. (2018).
Oil prices and GCC stock markets: New evidence from smooth transition models (Working Paper No 18/98). International Monetary Fund. https://www.imf.org/en/Publications/WP/
Issues/2018/05/09/Oil-Prices-and-GCC-Stock-Markets-New- Evidence-from-Smooth-Transition-Models-45819
Chittedi, K. R. (2012). Do oil prices matter for Indian stock markets? An empirical analysis. Journal of Applied Economics and Business Research, 2(1), 2–10. https://mpra.ub.uni- muenchen.de/35334/
Conrad, C., Loch, K., & Rittler, D. (2014). On the macroeconomic determinants of long-term volatilities and correlations in U.S.
stock and crude oil markets. Journal of Empirical Finance, 29, 26–40. https://doi.org/10.1016/j.jempfin.2014.03.009
Filis, G., & Chatziantoniou, I. (2014). Financial and monetary policy responses to oil price shocks: Evidence from oil-importing and oil-exporting countries. Review of Quantitative Finance and Accounting, 42(4), 709–729. https://doi.org/10.1007/s11156- 013-0359-7
Hammoudeh, S., & Aleisa, E. (2002). Relationship between spot/
futures price of crude oil and equity indices for oil-producing economies and oil-related industries. Arab Economic Journal, 11(27), 37–62. https://doi.org/10.1016/j.eneco.2014.03.006 Jones, C. M., & Kaul, G. (1996). Oil and the stock markets. The
Journal of Finance, 51(2), 463–491.
Kaneko, T., & Lee, B. S. (1995). The relative importance of economic factors in the US and Japanese stock markets.
Journal of the Japanese and International Economies, 9(3), 290–307. https://doi.org/10.1006/jjie.1995.1015
Kenneth, A., Hillary, E., Josaphat, O., & Emeka, O. (2019). Does oil price fluctuation affect stock market returns in Nigeria?
International Journal of Energy Economics and Policy, 9, 194–199. https://www.econjournals.com/index.php/ijeep/article/
view/7145/4109
Lin, B., Wesseh, P. K., & Appiah, M. O. (2014). Oil price fluctuation, volatility spillover, and the Ghanaian equity market: Implication for portfolio management and hedging effectiveness. Energy Economics, 42(C), 172–182. https://doi.
org/10.1016/j.eneco.2013.12.017
Maghyereh, A., & Al‐Kandari, A. (2007). Oil prices and stock markets in GCC countries: New evidence from nonlinear cointegration analysis. Managerial Finance, 33(7), 449–460.
https://doi.org/10.1108/03074350710753735
Malik, I. A., & Amjad, S. (2013). Foreign direct investment and stock market development in Pakistan. Journal of International Trade Law and Policy, 12(3), 226–242. https://doi.org/10.1108/
JITLP-02-2013-0002
Mohanty, S. K., Nandha, M., Abdullah Q. T., & Muhammed Y. A.
(2011). Oil price movements and stock market return:
Evidence from Gulf Cooperation Council (GCC) countries.
Global Finance Journal, 22, 42–55. https://doi.org/10.1016/j.
gfj.2011.05.004
Ologunde, A., Elumilade, D., & Saolu, T. (2006). Stock market capitalization and interest rate in Nigeria: A time series analysis.
International Research Journal of Finance and Economics, 4, 154–67. https://www.ajol.info/index.php/epr/article/view/39274 Otchere, I., Soumaré, I., & Yourougou, P. (2016). FDI and financial
market development in Africa. The World Economy, 39(5), 651–678. https://doi.org/10.1111/twec.12277
Paltrinieri, A. (2015). Stock exchange industry in UAE: An assessment of potential merger between Dubai financial market and Abu Dhabi securities exchange. International Journal of
Emerging Markets, 10(3), 362–382. https://doi.org/10.1108/
IJoEM-12-2012-0181
Papapetrou, E. (2001). Oil price shocks, stock market, economic activity and employment in Greece. Energy Economics, 23(5), 511–532. https://doi.org/10.1016/S0140-9883(01)00078-0 Pradhan, R. P., Arvin, M. B., & Ghoshray, A. (2015). The dynamics
of economic growth, oil prices, stock market depth, and other macroeconomic variables: Evidence from the G-20 countries.
International Review and Financial Analysis, 39, 84–95.
https://doi.org/10.1016/j.irfa.2015.03.006
Sharma, A., Giri, S., Vardhan, H., Surange, S., Shetty, R., &
Shetty, V. (2018). Relationship between crude oil prices and stock market: Evidence from India. International Journal of Energy Economics and Policy, 8(4), 331–337. https://www.
econjournals.com/index.php/ijeep/article/view/4439/3869 Shiller, R. J. (1981). Do stock prices move too much to be
justified by subsequent changes in dividends? American Economic Review, 71, 421–736. https://www.aeaweb.org/aer/
top20/71.3.421–436.pdf
UAE Economic Bulletin. (2020). Ministry of Foreign Affairs and International Cooperation report. https://sp.mofaic.gov.ae/
OpenData/Documents/2020.pdf
UNCTAD. (2020). World investment report 2020. https://unctad.
org/webflyer/world-investment-report-2020
Xiao, J., Zhou, M., Wen, F., & Wen, F. (2018). Asymmetric impacts of oil price uncertainty on Chinese stock returns under different market conditions: Evidence from oil volatility index.
Energy Economics, 74, 777–786. https://doi.org/10.1016/j.
eneco.2018.07.026
Zawya.com. (2019). Infographic: How MENA equity markets performed last year. https://www.zawya.com/mena/en/
markets/story/Infographic_How_MENA_equity_markets_
performed_last_year-ZAWYA20190306084741/
Zhao, L., Liu, Z., Wei, W., & Andreosso-O’Callaghan, B. (2017).
FDI outflows, exports, and financial development. Journal of Economic Studies, 44(6), 987–1002. https://doi.org/10.1108/
JES-01-2017-0020