Introduction
Cone-beam computed tomography(CBCT) is an imaging modality that provides a multiplanar view of the maxillo- facial structures based on a reconstruction of multiple 2-di- mensional images acquired around the patient’s head. Even though the indications of CBCT for different diagnostic tasks have been well described, the modality is still inher- ently affected by the formation of multiple artifacts, such as those caused by high-density materials, the patient’s movements, and the projection geometry.1-3 These artifacts are seen as alterations in the reconstructed image that do
not accurately reflect the original situation, and may nega- tively affect the resulting image and its ability to provide a correct evaluation.2,4-6
Multiple tools have been implemented by the manu- facturers of CBCT units to correct different types of arti- facts,4,7-9 and variations have been observed in their level of effectiveness.4-6 The artifacts generated by high-density materials, such as gutta-percha, titanium, and zirconi-
um,8,10,11 pose a major challenge for professionals, and the
effectiveness of the available tools is still debatable.5,6,8,11-13
The production of artifacts can be problematic for practi- tioners due to the way that metal artifact reduction(MAR) algorithms are activated in most machines, as they are ei- ther enabled or not before the acquisition begins. In clini- cal situations, this means that the professional may either choose whether to activate the MAR algorithm before the exam or perform 2 acquisitions to see whether the algo-
Does the metal artifact reduction algorithm activation mode influence the magnitude of artifacts in CBCT images?
Rocharles C. Fontenele 1, Eduarda H.L. Nascimento 1, Gustavo M. Santaella 1, Deborah Q. Freitas 1,*
1Department of Oral Diagnosis, Division of Oral Radiology, Piracicaba Dental School, University of Campinas(UNICAMP), Sao Paulo, Brazil
ABSTRACT
Purpose: This study was conducted to assess the effectiveness of a metal artifact reduction(MAR) algorithm activated at different times during cone-beam computed tomography(CBCT) acquisition on the magnitude of artifacts generated by a zirconium implant.
Materials and Methods: Volumes were obtained with and without a zirconium implant in a human mandible, using the OP300 Maxio unit. Three modes were tested: without MAR, with MAR activated after acquisition, and with MAR activated before acquisition. Artifacts were assessed in terms of the standard deviation(SD) of gray values and the contrast-to-noise ratio(CNR) in 6 regions of interest with different distances(10 to 35mm, from the nearest to the farthest) and angulations(70° to 135°) from the implant region.
Results: In the acquisitions without MAR, the regions closer to the implant(10 and 15mm) had a higher SD and lower CNR than the farther regions. When MAR was activated(before or after), SD values did not differ among the regions (P>0.05). The region closest to the implant presented a significantly lower CNR in the acquisitions without MAR than when MAR was activated after the acquisition; however, activating MAR before the acquisition did not yield significant differences from either of the other conditions.
Conclusion: Both modes of MAR activation were effective in decreasing the magnitude of CBCT artifacts, especially when the effects of the artifacts were more noticeable.(Imaging Sci Dent 2020; 50: 23-30)
KEY WORDS: Artifacts; Cone-Beam Computed Tomography; Dental Implant; Zirconium
Copyright ⓒ 2020 by Korean Academy of Oral and Maxillofacial Radiology
This is an Open Access article distributed under the terms of the Creative Commons Attribution Non-Commercial License(http://creativecommons.org/licenses/by-nc/3.0) which permits unrestricted non-commercial use, distribution, and reproduction in any medium, provided the original work is properly cited.
Imaging Science in Dentistry·pISSN 2233-7822 eISSN 2233-7830 This study was financed in part by the Coordenação de Aperfeiçoamento de Pessoal
de Nível Superior - Brasil (CAPES) - Finance Code 001.
Received October 18, 2019; Revised December 19, 2019; Accepted January 8, 2020
*Correspondence to : Prof. Deborah Queiroz Freitas
Department of Oral Diagnosis, Piracicaba Dental School, University of Campinas, Av. Limeira, 901, Zip Code 13414-903, Piracicaba, Sao Paulo, Brazil
Tel) 55-19-2106-5327, E-mail) [email protected]
rithm was effective or if it compromised the image; howev- er, the latter option is unacceptable due to the unnecessary radiation exposure to the patient.
To balance these needs, some newer units, such as the OP300 Maxio(Instrumentarium Dental, Tuusula, Finland) and Cranex 3Dx(Soredex, Tuusula, Finland) have imple- mented an option in the unit menu to re-reconstruct the latest acquired image with the MAR algorithm activated or inactivated.13 Therefore, the operator now has 3 options to choose from before an acquisition: a) to perform the ac- quisition and reconstruction with the MAR algorithm dis- abled, b) to perform the acquisition and reconstruction with the MAR algorithm enabled, and c) to perform the acquisi- tion and reconstruction with the MAR algorithm turned off, and to reconstruct the same volume a second time with the MAR algorithm turned on if the professional evaluates the exam and perceives that MAR might be useful. This en- ables the clinician to compare 2 reconstructions of the same volume, and it may be possible to obtain the advantages of the MAR algorithm without a new exam acquisition. The problem is that the manufacturers do not provide detailed information on how these multiple reconstructions work and whether the MAR algorithm is applied in the same way when it is enabled before and after the acquisition, so the real advantages of this possibility remain unknown.
Therefore, the aim of the present study was to evaluate the effectiveness of enabling the MAR algorithm before and after the acquisition on the reduction of artifacts in the tissue around a zirconium implant.
Materials and Methods
This study was conducted after receiving approval from the local research ethics committee(protocol number # 2.163.038).
Phantom
The phantom used in this study was a partially eden- tulous macerated human mandible. A zirconium oxide implant(Z-Look 3, Z-systems, Oensingen, Switzerland), measuring 4mm×11mm, was installed in the alveolus of the right first molar tooth. An epoxy resin-based bone sub- stitute block(ERB)(18mm×10mm×7mm) was placed in contact with the buccal cortical plate at the height of the middle level of the implant in the right mandibular first molar region with the aid of wax. The use of an ERB is important for the standardized selection of axial images evaluated without the presence of the implant. In addition, another ERB block of the same size was fixed in the buccal
cortical plate of the most anterior region of the mandible to serve as a control area, free of pronounced effects from the artifacts.
CBCT scanning
The images were obtained with an OP300 Maxio unit (Instrumentarium Dental, Tuusula, Finland). The same ac- quisition parameters were used for all the scans: 90kVp;
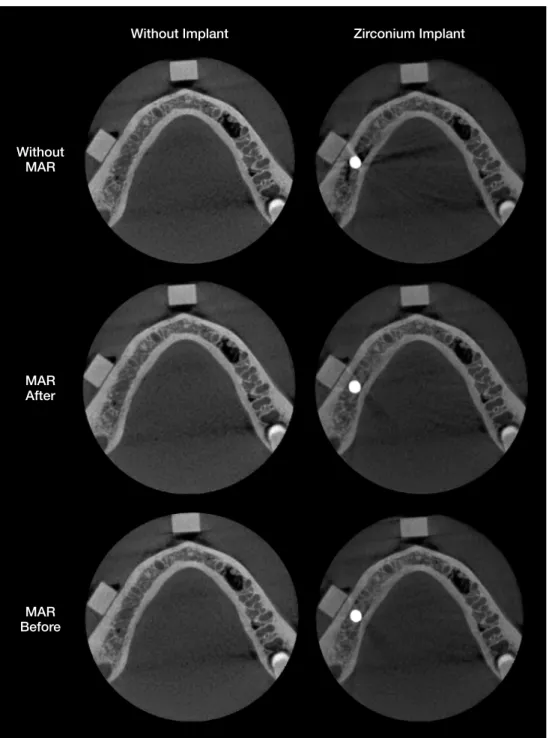
5mA; voxel size, 0.2 mm; and field of view(FOV), 6×8 cm.In this CBCT unit, 3 modes of using the MAR algorithm are available. All options were selected at different mo- ments, resulting in 3 sets of images: no activation of the MAR algorithm, activation of the MAR algorithm imme- diately after the image acquisition, and activation of the MAR algorithm before the scan. Figure 1 presents sets of axial images from the control group(without the implant) and the zirconium implant group with the various MAR options used.
Prior to the CBCT scans, the phantom was inserted into a cylindric plastic container(16 cm in diameter) with the aid of an impression material, and it was filled with water in order to simulate in vivo interactions between the X-ray beam and soft tissues. Subsequently, this phantom was po- sitioned on the platform of the OP300 Maxio unit and cen- tered in the FOV with the aid of light orientation guides.
Images were obtained of the implant group and the control group for the 3 conditions tested. To evaluate the repro- ducibility of the study, 5 acquisitions were obtained for each set of conditions: implant(with or without) and MAR options(without MAR, MAR after and MAR before the scans). This resulted in a total of 30 scans(2 implant condi- tions×3 MAR options×5 repetitions).
Image analysis
Artifacts were objectively evaluated performed using ImageJ software(National Institutes of Health, Bethesda, MD, USA). First, for each CBCT volume, 1 axial image was selected at the level where it was possible to visualize the upper level of the ERB block fixed in the buccal corti- cal plate near the implant area. This objective analysis was conducted by an oral radiologist with experience in image quality analysis under dim light conditions.
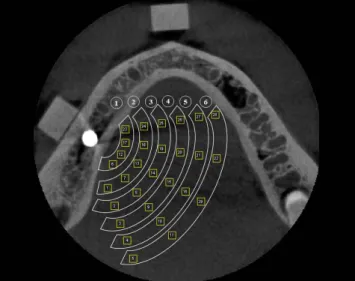
Subsequently, 29 regions of interest(ROIs) with the same size(2mm×2mm) were established on the axial im- age selected, using the ROI manager tool. The use of this tool is indispensable for the standardization of the position of ROIs. To determine the position of the ROIs, lines with different angulations in relation to the dental implant posi-
tion and circles with different radii that were centered on the dental implant were established according to previously described methodologies.9,14 Figure 2 shows the lines and circles distributed around the dental implant according to the angulations and radii used. The 29 ROIs were distrib- uted in 6 regions according to the length of the radius from the implant(region 1, 10mm; region 2, 15 mm; region 3, 20mm; region 4, 25mm; region 5, 30mm; region 6, 35
mm)(Fig. 3). Finally, the standard deviation(SD) values of the mean gray values for each ROI were obtained.
In addition, to calculate the contrast-to-noise ratio(CNR), it was necessary to determine an additional square ROI(Fig.
2C). This ROI was determined in an artifact-free control area located in the ERB block fixed in the most anterior mandibular region. The CNR was calculated according to the following equation:15
Fig. 1. Examples of cropped axial images of the control and zirconium groups in various metal artifact reduction(MAR) conditions: with- out MAR, MAR after acquisition, and MAR before acquisition.
MARAfter Without
MAR
Without Implant Zirconium Implant
BeforeMAR
|MeanImplant-MeanControl| CNR=--- SDImplant2 +SDControl2
The magnitude of the artifacts was evaluated by com- paring the SD and mean CNR of the ROIs located in each region.
Statistical analysis
The analysis was carried out using SPSS version 24.0
(IBM Corp., Armonk, NY, USA) and GraphPad Prism ver- sion 7.0(GraphPad Software, La Jolla, CA, USA), with a significance level of 5%. The SD and CNR values of the different groups were compared using multi-way analysis of variance with the post-hoc Tukey test in order to eval- uate the effectiveness of the MAR algorithm option in reducing the magnitude of the artifacts generated by the implant. The null hypothesis was that the MAR conditions would not influence the magnitude of the artifacts gener- ated by the zirconium dental implant, as measured by SD and the CNR.
Results
Table 1 shows the mean SD values of the ROIs located at different distances within the scanned volume. In the control group, there were no significant differences among the SD values of regions 1 to 6 in any of the 3 MAR con- ditions; furthermore, activation of the MAR algorithm did not influence the SD values in this group(P>0.05). For the implant group, in general, the regions closer to the im- plant(1 to 4) had higher SD values than the farther regions (5 and 6) in the acquisitions without MAR. In contrast, when MAR was activated(before or after), the SD values did not significantly differ among regions 1 to 6(P>0.05).
In addition, the SD values in regions 1 to 4 of the acquisi- tions with MAR(before or after) were significantly lower than the acquisitions obtained without MAR. In region 5,
Fig. 3. The magnitude of artifacts is evaluated by grouping the re- gions of interest located in the same circle. In this way, 6 different regions are established.
Fig. 2. A. A line is drawn through the center of the implant and parallel to the long axis of the mandibular body on the right side, and then a perpendicular line(90º) to that line is drawn. Considering the position of this perpendicular line, 4 additional lines are drawn, differing 20º between each other; 2 posterior(110º and 130º) and 2 anterior(70º and 50º) lines. B. After establishing these lines, circles centered on the dental implant are drawn with different radii(10mm, 15mm, 20mm, 25mm, 30mm, and 35mm). C. In the regions between intersections of the lines and circles, square regions of interest(ROIs)(2mm×2mm) are established. In addition, an ROI of the same size is established in the ERB block located in the anterior region of the mandible, serving as a control ROI.
A B C
a lower SD value was found when MAR was activated be- fore the acquisition than in the other 2 conditions, and in region 6, there were no significant differences among the 3 MAR conditions. A comparison between the control and implant groups in each region showed that for the acquisi- tions without MAR, only region 6 showed a significant dif- ference. For the acquisitions with MAR(activated before
or after acquisition), all regions in the implant group had lower SD values than those in the control group(P<0.05).
Regarding CNR values(Table 2), the control group showed no significant differences among regions 1 to 6 or among the 3 MAR conditions evaluated(P>0.05). In the implant group, there were no significant differences among the regions within each MAR condition. Region
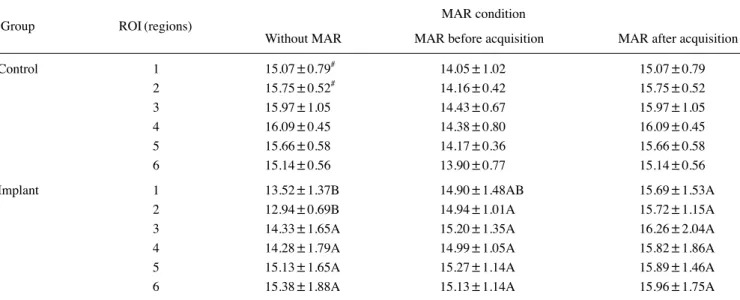
Table 2. Contrast-to-noise ratio(CNR) values of the regions of interest(ROIs) in the control and implant groups according to the metal artifact reduction(MAR) conditions
Group ROI(regions) MAR condition
Without MAR MAR before acquisition MAR after acquisition
Control 1 15.07±0.79# 14.05±1.02 15.07±0.79
2 15.75±0.52# 14.16±0.42 15.75±0.52
3 15.97±1.05 14.43±0.67 15.97±1.05
4 16.09±0.45 14.38±0.80 16.09±0.45
5 15.66±0.58 14.17±0.36 15.66±0.58
6 15.14±0.56 13.90±0.77 15.14±0.56
Implant 1 13.52±1.37B 14.90±1.48AB 15.69±1.53A
2 12.94±0.69B 14.94±1.01A 15.72±1.15A
3 14.33±1.65A 15.20±1.35A 16.26±2.04A
4 14.28±1.79A 14.99±1.05A 15.82±1.86A
5 15.13±1.65A 15.27±1.14A 15.89±1.46A
6 15.38±1.88A 15.13±1.14A 15.96±1.75A
Different uppercase letters indicate statistically significant differences between the acquisitions without MAR, with MAR before the acquisition, and with MAR after the acquisition. Different lowercase letters indicate statistically significant differences between ROIs and within each group (control and implant) according to 2-way analysis of variance. No statistically significant differences are obtained among the ROIs
Table 1. Standard deviation values of the mean gray values in the regions of interest (ROIs) in the control and implant groups according to the metal artifact reduction(MAR) conditions
Group ROI MAR condition
Without MAR MAR before acquisition MAR after acquisition
Control 1 4.05±0.18 3.73±0.32# 4.05±0.18#
2 3.90±0.19 4.01±0.18# 3.90±0.19#
3 3.89±0.38 3.80±0.12# 3.89±0.38#
4 3.64±0.21 3.82±0.32# 3.64±0.21#
5 3.86±0.31 3.81±0.40# 3.86±0.31#
6 3.94±0.32# 3.89±0.25# 3.94±0.32#
Implant 1 3.87±0.55Ab 2.83±0.32Ba 2.95±0.40Ba
2 4.51±0.41Aa 3.03±0.22Ba 3.12±0.28Ba
3 3.88±0.36Ab 2.96±0.24Ba 2.98±0.34Ba
4 3.88±0.49Ab 2.97±0.06Ba 3.14±0.44Ba
5 3.30±0.29Abc 2.78±0.15Ba 3.01±0.17Aa
6 2.98±0.30Ac 2.69±0.09Aa 2.82±0.36Aa
Different uppercase letters indicate statistically significant differences between the acquisitions without MAR, with MAR before acquisition, and with MAR after acquisition. Different lowercase letters indicate statistically significant differences between ROIs and within each group(control and implant) according to 2-way analysis of variance, #: differed significantly from the implant group within each ROI
1 presented a significantly lower CNR in the acquisitions without MAR than in those where MAR was activated after the acquisition(P<0.05), but no statistically signifi- cant differences were observed when MAR was activated before the acquisition(P>0.05). In region 2, the CNR was significantly lower(P<0.05) without MAR than in the ac- quisitions with MAR(before or after, with no significant difference between them, P>0.05). In the other regions(3 to 6), no significant differences were found between the ac- quisitions with or without MAR(P>0.05). The control and implant groups showed statistically significant differences in regions 1 and 2 for the acquisitions without MAR, with higher CNR values observed in the control group(P<0.05).
Discussion
The impact of artifacts in regions adjacent to dental im- plants on CBCT images is well established in the litera- ture.6,10,16-18 Recently, it has been found that the production of these artifacts is not restricted only to circumstances when a high-atomic-number object is adjacent.14 However, alterations in the acquisition protocol, such as increased peak kilovoltage and the activation of the MAR algorithm can improve the image quality by reducing artifact genera- tion.9 Although higher kVp values cause an increase in the radiation dose to which the patient is exposed,19 the same does not occur as a consequence of activating the MAR al- gorithm, since its application is unrelated to the acquisition parameters involving energy.11
The present study is pioneering, since 3 conditions of the MAR algorithm(no activation, activation before image acquisition, and activation after image acquisition) were tested in relation to artifact production in different regions of the scanned volume. This analysis is important because new CBCT units offer these MAR algorithm activation options and many patients undergoing a CBCT scan have implants or other high-density materials within the FOV.
Previous studies have investigated the influence of artifact production on the outcomes of various diagnostic tasks in teeth that were located close to a generator-artifact ob- ject.20,21 The results obtained showed discrepancies regard- ing the MAR algorithm. For the diagnosis of vertical root fractures, MAR activation was effective in improving the diagnosis, resulting in increased sensitivity values.20 How- ever, MAR activation did not influence the diagnosis of external root resorption.21 Although those studies evaluated only 1 MAR activation mode, the discrepancies in their results reinforce the clinical relevance of studying alterna- tives to reduce the expression of artifacts of all magnitudes.
According to our findings, artifacts were more strongly expressed in the regions adjacent to the dental implant(re- gions 1-4), since higher SD values were found. In addition, regardless of whether it was activated before or after image acquisition, the MAR algorithm was effective in reducing artifact generation. To our best knowledge, only a single previous study has evaluated the effectiveness of the MAR algorithm in relation to the magnitude of artifacts generated by a zirconium implant in CBCT images.9 As in our results, activating the MAR algorithm led to a significant reduction in SD values, especially in regions where the artifacts were more pronounced. However, a distinctive feature of the present study is that it evaluated 2 different modes of MAR activation, whereas the previous study only evaluated the mode in which the MAR algorithm was activated before image acquisition.9
The literature contains limited studies on the performance of different activation modes of the MAR tool. A previous study evaluated the different modes of MAR activation in cortical plates close to a dental implant, and obtained re- sults comparable to ours, with no significant differences in SD and CNR values between both modes.13 In the pres- ent study, a single ROI(5) for the implant group presented statistically significant different SD values between both MAR modes, but this can probably be explained as result- ing from normal variations in voxel values between multi- ple acquisitions.22
Regarding the CNR results, the regions closer to the implant(1 and 2) showed stronger expression of artifacts (lower CNR values), and the MAR algorithm was effec- tive. Conversely, no effect of MAR was observed in the other regions(3-6). We believe that this finding reflects the fact that artifacts were present to a lesser degree in the far- ther regions; consequently, the MAR algorithm would be expected not to have any effect, since it would not identify significant changes in gray values.9,10
Despite the limited information provided by the man- ufacturers of CBCT units regarding the operation of the MAR algorithm, it is believed that its activation results in the application of a threshold of gray values in the image, changing the extreme values that correspond to hypodense bands or hyperdense streaks of metal artifacts. However, little is known about what occurs when this algorithm is activated after image acquisition, as it is more commonly selected together with the acquisition parameters, prior to the acquisition. In this sense, an interesting result observed by the present study is that the values of the control group were identical without MAR and when MAR was activated after acquisition. This might imply that the software ana-
lyzes the images to assess whether there are artifacts and whether there is a need to apply any correction.
The CBCT unit tested in the present study was chosen because it allows the MAR algorithm to be activated be- fore and after image acquisition. Since each CBCT unit has unique aspects in relation to the MAR algorithm, we encourage researchers to conduct future studies with other units that allow different modes of activation of the MAR algorithm. Thus, our results can serve as a reference for future studies conducted with different equipment and arti- fact-generating materials.
In conclusion, for the equipment tested, both modes of MAR activation were effective in decreasing CBCT arti- facts of all magnitudes, especially when the effects of the artifacts were more noticeable. Therefore, the practitioner can choose when to activate the MAR algorithm according to his or her clinical preferences.
Acknowledgements
The authors are grateful to Bernardo Barbosa Freire, MS in Oral Radiology, for providing the zirconium dental im- plant used to perform this study.
References
1. Molteni R. Prospects and challenges of rendering tissue den- sity in Hounsfield units for cone beam computed tomography.
Oral Surg Oral Med Oral Pathol Oral Radiol 2013; 116: 105- 2. Schulze R, Heil U, Gross D, Bruellmann DD, Dranischnikow 19.
E, Schwanecke U, et al. Artefacts in CBCT: a review. Dento- maxillofac Radiol 2011; 40: 265-73.
3. Scarfe WC, Farman AG. What is cone-beam CT and how does it work? Dent Clin North Am 2008; 52: 707-30.
4. Spin-Neto R, Matzen LH, Schropp LW, Sørensen TS, Wenzel A.
An ex vivo study of automated motion artefact correction and the impact on cone beam CT image quality and interpretability.
Dentomaxillofac Radiol 2018; 47: 20180013.
5. Bezerra IS, Neves FS, Vasconcelos TV, Ambrosano GM, Freit- as DQ. Influence of the artefact reduction algorithm of Picasso Trio CBCT system on the diagnosis of vertical root fractures in teeth with metal posts. Dentomaxillofac Radiol 2015; 44:
20140428.
6. Steiger-Ronay V, Krcmaric Z, Schmidlin PR, Sahrmann P, Wie- demeier DB, Benic GI. Assessment of peri-implant defects at titanium and zirconium dioxide implants by means of periapical radiographs and cone beam computed tomography: an in-vitro examination. Clin Oral Implants Res 2018; 29: 1195-201.
7. Queiroz PM, Groppo FC, Oliveira ML, Haiter-Neto F, Freitas DQ. Evaluation of the efficacy of a metal artifact reduction al- gorithm in different cone beam computed tomography scanning
parameters. Oral Surg Oral Med Oral Pathol Oral Radiol 2017;
123: 729-34.
8. Vasconcelos KF, Codari M, Queiroz PM, Nicolielo LF, Freitas DQ, Sforza C, et al. The performance of metal artifact reduc- tion algorithms in cone beam computed tomography images considering the effects of materials, metal positions, and fields of view. Oral Surg Oral Med Oral Pathol Oral Radiol 2019;
127: 71-6.
9. Freitas DQ, Fontenele RC, Nascimento EH, Vasconcelos TV, Noujeim M. Influence of acquisition parameters on the mag- nitude of cone beam computed tomography artifacts. Dento- maxillofac Radiol 2018; 47: 20180151.
10. Queiroz PM, Oliveira ML, Groppo FC, Haiter-Neto F, Freitas DQ. Evaluation of metal artefact reduction in cone-beam com- puted tomography images of different dental materials. Clin Oral Investig 2018; 22: 419-23.
11. Vasconcelos TV, Bechara BB, McMahan CA, Freitas DQ, Nou- jeim M. Evaluation of artifacts generated by zirconium implants in cone-beam computed tomography images. Oral Surg Oral Med Oral Pathol Oral Radiol 2017; 123: 265-72.
12. Queiroz PM, Santaella GM, da Paz TD, Freitas DQ. Evalua- tion of a metal artefact reduction tool on different positions of a metal object in the FOV. Dentomaxillofac Radiol 2017; 46:
20160366.
13. Nascimento EH, Fontenele RC, Santaella GM, Freitas DQ.
Difference in the artefacts production and the performance of the metal artefact reduction(MAR) tool between the buccal and lingual cortical plates adjacent to zirconium dental implant.
Dentomaxillofac Radiol 2019; 48: 20190058.
14. Fontenele RC, Nascimento EH, Vasconcelos TV, Noujeim M, Freitas DQ. Magnitude of cone beam CT image artifacts related to zirconium and titanium implants: impact on image quality.
Dentomaxillofac Radiol 2018; 47: 20180021.
15. Bechara B, Mcmahan CA, Moore WS, Noujeim M, Geha H.
Contrast-to-noise ratio with different large volumes in a cone- beam computerized tomography machine: an in vitro study.
Oral Surg Oral Med Oral Pathol Oral Radiol 2012; 114: 658- 16. Demirturk Kocasarac H, Ustaoglu G, Bayrak S, Katkar R, Geha 65.
H, Deahl ST 2nd, et al. Evaluation of artifacts generated by tita- nium, zirconium, and titanium-zirconium alloy dental implants on MRI, CT, and CBCT images: a phantom study. Oral Surg Oral Med Oral Pathol Oral Radiol 2019; 127: 535-44.
17. Machado AH, Fardim KA, de Souza CF, Sotto-Maior BS, Assis NM, Devito KL. Effect of anatomical region on the formation of metal artefacts produced by dental implants in cone beam computed tomographic images. Dentomaxillofac Radiol 2018;
47: 20170281.
18. Sancho-Puchades M, Hämmerle CH, Benic GI. In vitro assess- ment of artifacts induced by titanium, titanium-zirconium and zirconium dioxide implants in cone-beam computed tomogra- phy. Clin Oral Implants Res 2015; 26: 1222-8.
19. Ludlow JB, Timothy R, Walker C, Hunter R, Benavides E, Samuelson DB, et al. Effective dose of dental CBCT - a meta analysis of published data and additional data for nine CBCT units. Dentomaxillofac Radiol 2015; 44: 20140197.
20. Freitas DQ, Vasconcelos TV, Noujeim M. Diagnosis of vertical root fracture in teeth close and distant to implant: an in vitro
study to assess the influence of artifacts produced in cone beam computed tomography. Clin Oral Investig 2019; 23: 1263-70.
21. Freitas DQ, Nascimento EH, Vasconcelos TV, Noujeim M.
Diagnosis of external root resorption in teeth close and distant to zirconium implants: influence of acquisition parameters and
artefacts produced during cone beam computed tomography. Int Endod J 2019; 52: 866-73.
22. Spin-Neto R, Gotfredsen E, Wenzel A. Variation in voxel value distribution and effect of time between exposures in six CBCT units. Dentomaxillofac Radiol 2014; 43: 20130376.