This is an Open Access article distributed under the terms of the Creative Commons Attribution Non-Commercial License (http: //creativecommons.org/licenses/by- nc/4.0/) which permits unrestricted non-commercial use, distribution, and reproduction in any medium, provided the original work is properly cited.
Copyright: © 2018 Korean Journal of Agrcultural Science
https://doi.org/10.7744/kjoas.20180067
ANIMAL
2-DE and MALDI-TOF MS-based identification of bovine whey proteins in milk collected soon after parturition
Jae Eun Lee, Tao Lin, Jung Won Kang, Hyun Young Shin, Joo Bin Lee, Dong Il Jin*
Divison of Animal & Dairy Science, Chungnam National University, Daejeon 34134, Korea
*Corresponding author: [email protected]
Abstract
Bovine milk is widely consumed by humans and is a primary ingredient of dairy foods.
Proteomic approaches have the potential to elucidate complex milk proteins and have been used to study milk of various species. Here, we performed a proteomic analysis using 2 -dimensional electrophoresis (2-DE) and matrix assisted laser desorption ionization–time of flight mass spectrometer (MALDI-TOF MS) to identify whey proteins in bovine milk obtained soon after parturition (bovine early milk). The major casein proteins were removed, and the whey proteins were analyzed with 2–dimensional polyacrylamide gel electrophoresis (2-D PAGE). The whey proteins (2 mg) were separated by pI and molecular weight across pH ranges of 3.0 - 10.0 and 4.0 - 7.0. The 2-DE gels held about 300 to 700 detectable protein spots. We randomly picked 12 and nine spots that were consistently expressed in the pH 3.0 - 10.0 and pH 4.0 - 7.0 ranges, respectively. Following MALDI-TOF MS analysis, the 21 randomly selected proteins included proteins known to be present in bovine milk, such as albumin, lactoferrin, serum albumin precursor, T cell receptor, polymeric immunoglobulin receptor, pancreatic trypsin inhibitor, aldehyde oxidase and microglobulin. These proteins have major functions in immune responses, metabolism and protein binding. In summary, we herein identified both known and novel whey proteins present in bovine early milk, and our sodium dodecyl sulfate- polyacrylamide gel electrophoresis (SDS-PAGE) analysis revealed their expression pattern.
Keywords: 2-DE, bovine early milk, MALDI-TOF, whey proteomics
Introduction
Milk contains almost all of the nutrient types that animals need to survive, including proteins, lipids, calcium, vitamins and minor minerals. Milk is the only source of nourishment for the newborn mammal, and it serves as an important means of transferring pathogenic immunity from the mother to the offspring. Mammalian milk contains various soluble components that provide essential nutrients and immunological proteins to the newborn animal. Milk has been used as a complete food for humans, as it contains the necessary nutrients at an appropriate ratio and provides animal proteins, minerals and vitamins, which can be deficient in rice-or wheat-based meal. The constituents of milk OPEN ACCESS
Accepted: September 17, 2018 Revised: August 27, 2018 Received: April 5, 2018 DOI:
Citation: Lee JE, Lin Tao, Kang JW, Shin HY, Lee JB, Jin DI. 2018. 2-DE and MALDI- TOF MS-based identification of bovine whey proteins in milk collected soon after parturition. Korean Journal of Agricultural Science. https://doi.org/10.7744/
kjoas.20180067
produced by different species may differ in its primary dominant proteins. In bovine milk, the dominant proteins include as1-casein (as1CN), β-casein, k-casein, as2-casein (as2CN), β-lactoglobulin, α-lactalbumin and bovine serum albumin (Fox, 1982). The whey proteins include the major whey proteins, β-lactoglobulin and α-lactalbumin, and various minor whey proteins, such as lactoferrin and lactoperoxidase.
Milk proteins have been studied continuously for over 30 years. With advances in technology, knowledge of the complex milk protein system has evolved incrementally in recent decades (Park et al., 2016; Ranaraja et al., 2016). Proteomics and associated technologies have the potential to facilitate further advances in our knowledge of milk proteins. Proteomics allows for the detection, identification and characterization of milk proteins, and proteomic strategies can simultaneously analyze large numbers of milk proteins (Holt and Sawyer, 1988; Marshall and Williams, 1988; Goldfarb et al., 1989). To date, only a few proteomic studies have succeeded in identifying the minor protein components of milk. The broad removal of major milk proteins (e.g., caseins) from bovine milk can enhance the ability of 2-dimensional electrophoresis (2-DE) gels to resolve more minor proteins. Indeed, precipitation of caseins at pH 4.6 followed by ultracentrifugation is routinely used to separate caseins from the whey fraction. Baeker et al. (2002) used 2-DE of the whey fraction to analyze several isoforms of low- abundance proteins. Proteomic studies have used high-resolution 2-DE to study the milk proteins of a limited number of species. Human and bovine milk have been the main focus of such studies, with some extension to goat, wallaby and mouse milk (Molloy et al., 1997; Wu et al., 2000; Roncada et al., 2002).
Due to the economic significance of cattle in the context of animal production, special attention has been given to this species. Proteomic approaches have been used to investigate proteins from bovine tissues, cells (Nishizawa et al., 1999;
Talamo et al., 2003; Bouley et al., 2004; Jalili et al., 2004), milk (Yamada et al., 2002) and biological fluids (Talamo et al., 2003; Lippolis and Reinhardt, 2005). Several proteomic studies have been performed on the bovine reproductive system (Mortarino et al., 1999; Ali et al., 2004; Jobim et al., 2004). The proteins in bovine serum have been subjected to 2-DE mapping, and the protein patterns obtained under nonstandard conditions were recently investigated. A control map of the proteins in bovine serum was published by Talamo et al. (2003).
Here, we collected bovine early milk at days 7 to 10 after parturition. We used low pH and centrifugation to remove the major casein proteins, and subjected the isolated whey milk to 2-DE and matrix assisted laser desorption ionization–time of flight mass spectrometer (MALDI-TOF MS) for proteomic identification of major and minor proteins.
Materials and Methods Milk samples
The study was performed using five Holstein dairy cattle, which were housed in the Animal Farm Unit of Chungnam National University. All animal care and use procedures were approved by the Institutional Animal Care and Use Committee of Chungnam National University. The bovine milk samples were collected at 7 to 10 days after parturition. The whole milk samples were adjusted to pH 4.6 and centrifuged at 3000 × g at 4℃ for 20 min to remove the precipitated casein proteins.
The whey proteins were concentrated by centrifugation of the supernatant at 10,000 × g for 1 h using a Vivaspin 500
(Sartorius AG, Goettingen, Germany). The obtained proteins were stored at - 70℃.
2-DE
Samples were mixed with modified rehydration buffer (7 M urea, 2 M thiourea, 4% CHAPS, 2.5% dithiothreitol (DTT), 10% isopropanol and 5% glycerol) to a total volume of 350 μL and added to immobilized pH gradient IPG buffer (pH 3.0 - 10.0). Precast 18 cm IPG strips with ranges of pH 3.0 - 10.0 and pH 4.0 - 7.0 were obtained from General Electric (GE) Healthcare Biosciences. Each sample mix was loaded onto pH 3 - 10 and pH 4 - 7 IPG strips (180 mm × 3 mm × 0.5 mm) with loading buffer, allowed to rehydrate overnight in a swelling tray, and subjected to isoelectric focusing (IEF) in a Multiphor II IEF system (Amersham Pharmacia Biotech, Uppsala, Sweden). Automatic IEF was performed at 1.5 × 10
5Vh.
The initial voltage of 100 V was gradually increased to a final voltage of 8,000 V as follows: 100 V for 100 min, 300 V for 100 min, 600 V for 100 min, 1,000 V for 100 min, 3,000 V for 100 min, 5,000 V for 100 min and 8,000 V for 1,000 min.
After the first dimension, the IPG gel strips were placed in an equilibrium solution (6 M urea, 2% sodium dodecyl sulfate (SDS), 50% v/v glycerol, 2.5% acrylamide and 1.5 M Tris-HCl, pH 8.8) containing 5 mM tributylphosphine (TBP).
Equilibration was carried out twice for 10 min each time with gentle shaking. The first equilibrium solution was supplemented with 1% dithiothreitol, while the second was supplemented with 4% iodoacetamide. Following equilibration, the second dimension was performed using sodium dodecyl sulfate-polyacrylamide gel electrophoresis (SDS-PAGE). The strips were loaded onto 8 - 16% linear gradient SDS polyacrylamide gels (200 mm × 250 mm × 1.0 mm), which were placed in an isoelectric dalton (ISO-DALT) system (Hoefer Scientific Instruments, San Francisco, CA, USA) and electrophoresed overnight at 10 - 15 mA until the bromophenol blue marker dye disappeared from the bottom of the gel. Each sample was run in duplicate. After 2-DE, the gels were shaken at 30 rpm for 1 h in fixing buffer (30% methanol and 10% acetic acid) and stained with colloidal Coomassie brilliant blue (CBB) G250 for 24 h. The gels were destained with 1% acetic acid and analyzed using the Image Master 2-D platinum software version 5.0. Calculations were applied to the percent-volume representative of the expression of each protein.
Protein sample preparation for MS analysis
Clearly expressed protein spots were cut from the CBB-stained gel, destained with 120 μL of wash solution (50%
acetonitrile and 25 mM NH
4HCO
3; pH 7.8) and dehydrated using a vacuum centrifuge. Each dried gel piece was rehydrated with 5 μL of trypsin solution (0.0012 μg/μL in 25 mM NH
4HCO
3; pH 7.8) and allowed to digest at 37℃ overnight. Each supernatant was transferred to a new eppendorf tube, and residual peptides were extracted from the original tubes by sonication for 20 min at 30℃ in 50% acetonitrile and 0.5% trifluoroacetic acid (TFA). The peptides extracted from each gel piece were combined and subjected to MALDI-TOF analysis. Mass spectrometry-based peptide mass fingerprinting (PMF) was performed using a Voyager-DETM STR MALDI-TOF-MS (PerSeptive Biosystems, Framingham, MA, USA).
Approximately 1 μL of extracted peptide solution was mixed with an equal volume of matrix solution (10 mg/mL α-cyano- 4-hydroxycinnamic acid, 0.1% TFA and 50% acetonitrile), loaded onto a 96-well MALDI sample plate and crystallized. For each sample, spectral data were collected in the mass range of 900 - 3500 m/z using positive ionization. Spectra were automatically calibrated upon acquisition using an external three-point calibration.
Protein identification
Calibrated peaks were assigned manually using the Data ExploreTM 4.0 program of the Voyager1.5-DE STR MALDI-
TOF-MS software package (PerSeptive Biosystems, USA). ProFound (http://prowl.rockefeller.edu/prowl-cgi/profound.
exe) searches were performed against the mammalian subset of the non-redundant NCBI uniprot (https://www.uniprot.org) protein sequence database; we allowed for an error tolerance of up to 500 ppm and up to one missed trypsin cleavage site.
For search engines, methionine oxidation was selected as a partial modification. Proteins were identified by probability based on the ProFound results (p < 0.1). The molecules, Z scores, sequence coverages, and pIs are presented in tables.
Results and Discussion
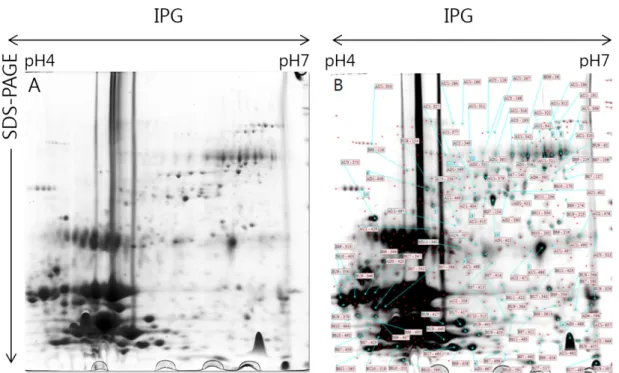
Bovine early milk was collected at 7 to 10 days following parturition, whey proteins were separated and 2-D PAGE was used to perform IEF with non-linear IPG strips of pH 3.0 - 10.0 (Fig. 1) and pH 4.0 - 7.0 (Fig. 2). Image analysis of CBB- stained proteins was performed using the Image Master 2-D platinum software version 5.0 (Swiss Institute for Bioinformatics, Geneva, Switzerland). We detected about 300 - 700 spots in the pH 3.0 - 10.0 and pH 4.0 - 7.0 2-D gels. We searched for protein spots that appeared consistently in the same locations in five gel samples (consistent spots). This analysis yielded about 108 spots in the pH 3.0 - 10.0 range and 128 spots in the pH 4 - 7 range.
We randomly picked 12 and nine consistent spots from the pH 3.0 - 10.0 range and the pH 4.0 - 7.0 range, respectively (Fig. 3), and performed in-gel trypsin digestion and subsequent MALDI-TOF MS analysis. Raw spectra were processed with the Data Explorer software to remove/reduce noise, yielding a list of monoisotopic peaks for each sample. The tryptic peptide mass was used to search for protein candidates using the web-based software, ProFound (http://129.85.19.192/
profound_bin/Web ProFound.exe). The search results were evaluated based on accepted standards that take into account the number of peptides matched to a candidate protein, the coverage of a candidate protein's sequence by matching peptides, and the agreement of experimental and theoretical pIs and molecular weights with our derived values. From among the 21 spots,
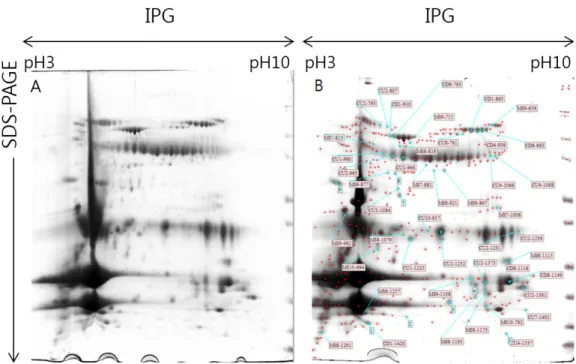
Fig. 1. 2-dimensional polyacrylamide gel electrophoresis (2-D PAGE) gel pattern of bovine whey proteins
in early milk obtained soon after parturition. The proteins were visualized by Coomassie blue staining. The
first dimension was pH 3.0 - 10.0 non-linear immobilized pH gradient (IPG), and the second dimension was
a 6 - 200 kDa separation in an 8 - 16% gradient gel. A: Stained gel. B: Image-analyzed gel. SDS-PAGE, sulfate-
polyacrylamide gel electrophoresis.
we identified various known proteins via SWISS-PROT and NCBI database searching. The identified proteins are presented in Table 1 and Table 2.
The protein composition of milk is dynamic, varying with lactation stage, age, breed, nutrition, energy balance, udder health status, etc. Bovine milk reportedly may contain various serum proteins, including albumin, immunoglobulins, complement proteins, members of the insulin–like growth factor (IGF) family and lactoferrin, which is an iron-binding protein that has antimicrobial properties (Lacy-Hulbert et al., 1999; Korhonen et al., 2000; Ward et al., 2002). In this study
Table 1. Identification of bovine whey proteins selected from the pH 3.0 - 10.0 range.
Spot ID Est Z
zAccession No Protein information Coverage (%) pI kDa 867 1.37 gi|1168949 Potassium voltage-gated channel subfamily A member 4 9 6.5 50.56
921 1.67 IPI00708398.1 Serum albumin precursor 34 6.1 49.98
1006 1.49 IPI00710146.4 36 kDa protein 23 8.0 33.20
1108 1.79 gi|4959708 Cytosolic NADP+-dependent isocitrate dehydrogenase 40 7.2 17.32
657 1.56 gi|1351907| Serum albumin precursor 30 6.5 29.64
1084 2.18 gi|30794280 Albumin 28 5.8 37.50
1232 1.42 gi|3914346 Solute carrier organic anion transporter family, member 1B3 26 7.0 29.98
1373 1.72 gi|30794280 Similar to MAK31-like protein 27 9.5 15.22
938 1.37 gi|504 T cell receptor beta 14 7.8 82.35
1116 1.94 gi|27806675 NMR study of bovine heart fatty acid binding protein 35 9.0 23.04 1149 1.73 gi|34810001 Bovine lactoferrin at 1.9 A resolution 36 9.2 17.53 1120 1.38 gi|32189338 Polymeric immunoglobulin receptor 26 4.8 7.35
Z
The following is a list of Z scores and their corresponding percentiles in an estimated random-match population:
[(Z: percentile) 1.282:90.0, 1.645:95.0, 2.326:99.0, 3.090:99.9].
Fig. 2. 2-dimensional polyacrylamide gel electrophoresis (2-D PAGE) gel pattern of bovine whey proteins of
early milk. The first dimension was pH 4.0 - 7.0 non-linear immobilized pH gradient (IPG), and the second
dimension was a 6 - 200 kDa separation in an 8 - 16% gradient gel. Proteins were stained with Coomassie
blue. A: Stained gel. B: Image-analyzed gel. SDS-PAGE, sulfate-polyacrylamide gel electrophoresis.
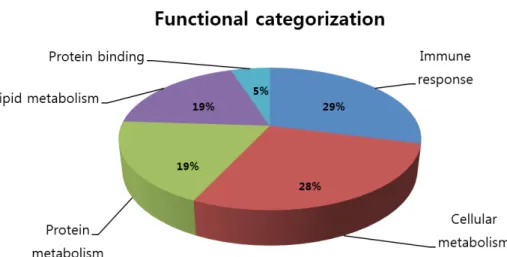
we identified 21 bovine whey proteins in early milk obtained soon after parturition; the identified proteins included albumin, lactoferrin, serum albumin precursor, T cell receptor, polymeric immunoglobulin receptor, pancreatic trypsin inhibitor, aldehyde oxidase and microglobulin. Lactoferrin and globulin are known as major milk proteins. About 80% of the total whey protein is composed of lacto-albumin and lactoglobulin. Lactoferrin (also known as lactotransferrin) is a multifunctional protein of the transferrin family. Consistent with the known immune functions of transferrin family members, lactoferrin has an innate defense-related antimicrobial activity (Séverin and Wenshui, 2005). The identified proteins also included metabolism-related factors, such as precursors and binding proteins, the latter of which may function by binding to other factors (Nissen et al., 2013). Finally, we identified various enzymes, including aldehyde oxidase, which is an aldehyde-
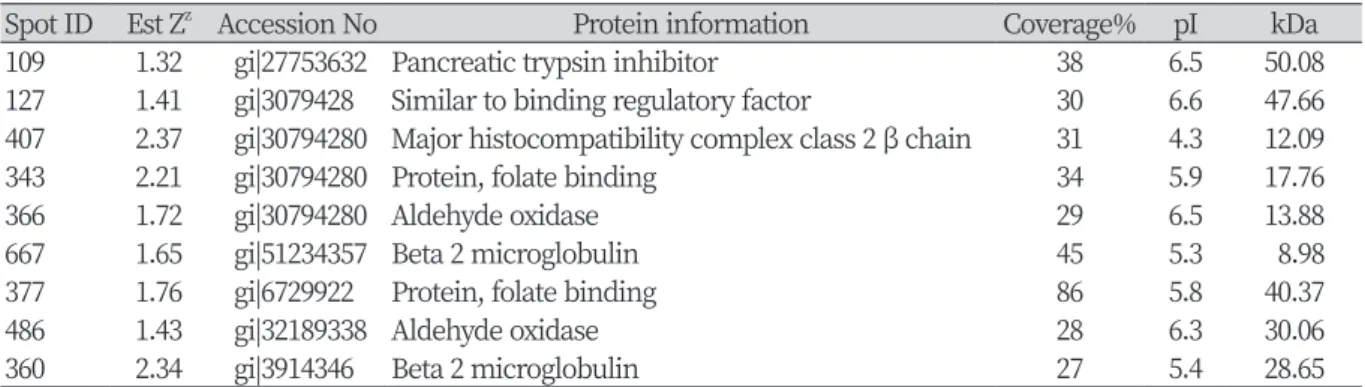
Table 2. Identification of bovine whey proteins in the pH 4.0 - 7.0 range.
Spot ID Est Z
zAccession No Protein information Coverage% pI kDa
109 1.32 gi|27753632 Pancreatic trypsin inhibitor 38 6.5 50.08
127 1.41 gi|3079428 Similar to binding regulatory factor 30 6.6 47.66 407 2.37 gi|30794280 Major histocompatibility complex class 2 β chain 31 4.3 12.09
343 2.21 gi|30794280 Protein, folate binding 34 5.9 17.76
366 1.72 gi|30794280 Aldehyde oxidase 29 6.5 13.88
667 1.65 gi|51234357 Beta 2 microglobulin 45 5.3 8.98
377 1.76 gi|6729922 Protein, folate binding 86 5.8 40.37
486 1.43 gi|32189338 Aldehyde oxidase 28 6.3 30.06
360 2.34 gi|3914346 Beta 2 microglobulin 27 5.4 28.65
Z