†Corresponding author: [email protected]
Influence of Annealing Temperature on Microstructure and Pitting Corrosion Behavior of the 27Cr-7Ni Hyper Duplex Stainless Steel
Soon-Hyeok Jeon, Hye-Jin Kim, Kyeong-Ho Kong, and Yong-Soo Park†
Department of Material Science and Engineering, Yonsei University, 134 Shinchon-dong, Seodaemun-gu, Seoul 120-749, Republic of Korea (Received April 29, 2014; Revised April 29, 2014; Accepted April 29, 2014)
Influence of annealing temperature on the microstructure and resistance to pitting corrosion of the hyper duplex stainless steel was investigated in acid and neutral chloride environments. The pitting corrosion resistance is strongly dependent on the microstructure, especially the presence of chromium nitrides (Cr2N), elemental partitioning behavior and volume fraction of ferrite phase and austenite phase. Precipitation of deleterious chromium nitrides reduces the resistance to pitting corrosion due to the formation of Cr-depleted zone.
The difference of PREN (Pitting Resistance Equivalent Number) values between the ferrite and austenite phases was the smallest when solution heat-treated at 1060 oC. Based on the results of electrochemical tests and critical crevice temperature tests, the optimal annealing temperature is determined as 1060 oC.
Keywords : duplex stainless steel, pitting corrosion, solution heat treatment, chromium nitride
1. Introduction
Super duplex stainless steels (SDSSs) with nearly equal volume fraction of ferrite (α) and austenite (γ) phases have been increasingly used in oil, chemical, petrochemical, nu- clear and marine industries due to the excellent combina- tion of mechanical and corrosion properties and relatively low cost due to the addition of low Ni, as compared with austenite stainless steels (ASSs).1-3)
In industrial heat exchanger application, resistance to corrosion of SDSSs with a PREN (Pitting Resistance Equivalent Number = wt. % Cr + 3.3(wt. % Mo+ 0.5 wt. % W) + 16 wt. % N)4,5) value above 40 is insufficient for higher temperature service and a long service life.
Hence, hyper duplex stainless steel (HDSS) with a PREN value above 45 has been developed to provide high resist- ance to pitting corrosion, combined with improvements in mechanical properties.4)
Recent studies on HDSS are focused on the opti- mization of the alloy design and welding condition for improving corrosion resistance. Jang et al.6) reported that pitting corrosion resistance of the HDSS tube after weld- ing with N2 supplemented Ar shielding gas was increased due to a decrease of α-phase, compare with that of the HDSS tube welding with Ar shielding gas. The addition of Cu in the HDSS enhanced the resistance to general
corrosion due to the protective surface film enriched with the noble metallic Cu.7) The addition of Cu in the HDSS reduced the pitting corrosion resistance due to an increase of interface areas between inclusions and matrix acting as preferential pit initiation sites.8)
However, few studies have been focused on the effect of annealing temperature on the microstructure and the associated pitting corrosion of HDSS. It is very important to find out the optimum annealing temperature condition to control the volume fraction of the α- and γ-phases be- cause corrosion and mechanical properties of DSS are largely influenced by the volume fraction of α- and γ -phases.
The corrosion behavior of DSS is greatly affected by the difference in chemical composition between α- and γ-phases. In general, Cr and Mo contents are higher in the α-phase whereas Ni and N are much higher in the γ-phase. The partitioning of these elements affects the cor- rosion resistance of α and γ phases. In particular, N is strongly enriched in the γ-phase9) and thus improves the corrosion resistance by increasing the PREN of the γ -phase.10) Moreover, it has been reported that N also re- duces the tendency for sigma (σ) phase precipitations by reducing the Cr enrichment in the α-phase.11,12)
With the increased use of nitrogen as an alloying ele- ment in DSS, the precipitation of chromium nitrides in the temperature range 973-1173 K has become more important.11) Precipitation of chromium nitride leads to a
ical properties. Ha and Kwon found from the polar- ization tests using an electrochemical microcell that pit initiated at the Cr and N depleted zone adjacent to the chromium nitrides in stainless steels. Perren et al.18) re- ported that the detrimental effect of chromium nitrides formed in the α phase during quenching on the passivation behavior of SDSSs.
The aim of this study is to examine the influence of annealing temperature on the microstructure of α- and γ -phases and the associated pitting corrosion resistance ac- cording to each annealing temperature and to observe pre- cipitation behavior of chromium nitrides, thus establishing the optimal annealing temperature where the HDSS ex- hibits the best pitting corrosion resistance.
2. Experimental Methods
The experimental alloy were manufactured using a high frequency vacuum induction furnace and then hot rolled to plates of 6 mm thickness. The experimental alloy was cut and solution heat-treated for 2 h at following temper- atures: 1020 oC, 1060 oC, 1100 oC and then quenched in water. Chemical analysis was performed by ARL 3460 optical emission spectrometer (OES). N concentration was analyzed using a LECO N/O (TC-300) analyzer. Chemical composition of the alloy is presented in Table 1.
The Influence of annealing temperature on the micro- structure and resistance to pitting corrosion of the HDSS were investigated using a potentiodynamic anodic polar- ization technique. The corrosion potential (Ecorr), the pit- ting potential (Epit), the passive region (△Ep), the critical current density (Ic) and the corrosion current density (Icorr) were obtained from the potentiodynamic anodic polar- ization curves. The corrosion current density (Icorr) was commonly obtained by the extrapolation of the cathodic and anodic curve between 50 and 100 mV away from the corrosion potential. The pitting potential marked the end of the passive potential region and the transition from passive to transpassive behavior. The potentiodynamic anodic polarization tests were conducted in a deaerated 4 M NaCl at 75 oC and a deaerated 0.5 M HCl+ 1 M NaCl at 70 oC according to the ASTM G 5.19) Test speci- mens were joined with copper wire through soldering (95
resin. One side of the sample was ground to 600 grit using SiC abrasion paper. After defining the exposed area of the test specimen as 0.5×10⁻⁴ m2, the remainder was paint- ed with a transparent lacquer.
The test was conducted at a potential range of -0.65 V to +1.1 V vs. SCE (saturated calomel electrode) and at a scanning rate of 1×10⁻³ V s-1, using a SCE. The current transients through the potentiostatic tests were measured in deaerated 4 M NaCl solution at 75 oC with an applied potential of 0 V vs. SCE in the passive region of the potentiodynamic anodic polarization curves at which meta-stable pitting can occur.20,21) The current transients were recorded for a duration of 3600 s.
A critical crevice temperature (CCT) test was conducted in 6 wt. % FeCl3 + 1 wt. % HCl of pH≑0 per ASTM G 48-Method F.22) The specimens were ground to 100 grit using SiC abrasion paper. The initial temperature of 6 wt.
% FeCl3 + 1 wt. % HCl for the critical crevice temperature test was 25 oC. The solution temperature was increased by 5 oC per 24 hours from the initial temperature of 25
oC according to ASTM G 48-Method F. After the test was completed, corrosion products were removed in acetone.
Pitting corrosion is considered to be present if the local attack is 0.025 mm or greater in depth. The optical micro- structures was used to observe the pitting sites on the specimen after taking the potentiodynamic anodic polar- ization tests in deaerated 4 M NaCl solutions at 75 oC.
To observe the microstructures of the alloys, they were ground to 2000 grit using SiC abrasive papers, polished with diamond paste. The chromium nitrides were analyzed using a scanning electron microscope and energy dis- persive spectroscope (SEM-EDS). The contents of Cr, Mo and W in α and γ phases were analyzed using a SEM-EDS. The nitrogen content was analyzed using a scanning Auger multi-probe (SAM). The values for the PREN were calculated by using the results of the EDS-analysis for Cr, Mo and W, while the values for N were taken from a SAM analyzer.
3. Results and discussion 3.1. Microstructural analysis
Fig. 1 shows back-scattered electron (BSE) images of
(a) (b) (c)
Fig. 1. BSE images of the microstructure of the alloy solution-annealed for 2 h at (a) 1020 oC, (b) 1060 oC and (c) 1100 oC.
Table 2. Chemical compositions and PREN values of the ferriten and austenite phases for the alloy annealed at different solution- annealing temperatures
Annealing temperature
Ferrite
content Phase Chemical compositions (mass %)
PREN △PREN
PREN(γ)-PREN(α)
Cr Mo W N
1020 oC 31 % Ferrite (α) 30.01 4.30 5.32 0.05 54.4 -6.7
PREN(γ) < PREN(α)
Austenite (γ) 25.10 2.01 2.42 0.40 47.7
1060 oC 44 % Ferrite (α) 29.12 3.36 4.42 0.05 49.0 +3.9
PREN(γ) > PREN(α)
Austenite (γ) 25.18 2.02 2.56 0.56 52.9
1100 oC 49 % Ferrite (α) 28.94 3.15 4.22 0.05 47.8 +6.0
PREN(γ) > PREN(α)
Austenite (γ) 25.30 2.04 2.65 0.58 53.8
* PREN (Pitting Resistance Equivalent Number) = wt. % Cr + 3.3(wt. % Mo + 0.5x wt. % W)+30x wt. % N
Table 3. Chemical composition of the chromium nitride for the alloy annealed at 1020 oC (wt.%)
Cr Mo W Ni N Fe
72.9 2.6 2.1 2.1 4.3 16.0
the microstructure of the experimental alloys annealing temperature 1020 oC to 1100 oC. Increasing the annealing temperature from 1293 K to 1373 K gradually resulted in an increase of ferrite content from 31 % to 49 % ob- tained from Table 2. There are the rounded and acicular chromium nitride particles randomly distributed within austenite phase and at phase boundaries after annealing at 1020 oC as shown in Fig. 1 (a). As presented in Table 3, SEM-EDS analysis indicates that the rounded and acic- ular nitride particles are chromium nitride (Cr2N) owing to their much higher Cr content than that of the matrix.
As the annealing temperature at 1060 oC and 1100 oC, The austenite phase can be found as island phase on the background of α-phase which looks relatively dark. No intermetallic compounds such as Cr2N and σ phase were observed. Besides, affected by hot rolling, the specimen has elongated texture parallel to the rolling direction. In presented in Table 2, the chemical composition of α -phase, γ-phase for specimens annealed at different tem-
Fig. 2. Potentiodynamic anodic polarization tests in deaerated 0.5 M HCl + 1 M NaCl solution at 70 ℃ of the alloy annealed at different solution-annealing temperatures.
perature is conducted using SEM-EDS. The N content in the α-phase and γ-phase was calculated using a SAM.
3.2. Influence of annealing temperature on the pitting corrosion resistance
Fig. 2 shows the influence of annealing temperature on the potentiodynamic polarization behavior of the ex- perimental alloys in a deaerated 0.5 M HCl + 1 M NaCl solution at 70 oC according to ASTM G 5. Table 4 shows the influence of annealing temperature on the corrosion
Fig. 3. Potentiodynamic anodic polarization tests in deaerated 4 M NaCl solution at 75 ℃ of the alloy annealed at different solution- annealing temperatures.
potential (Ecorr), corrosion current density (Icorr) and the critical current density (Ic) obtained from Fig. 2. When annealed at 1020 oC, based upon the Icorr and Ic, the speci- mens showed the worst pitting corrosion resistance due to precipitation of deleterious Cr2N. Cr2N is an inter- metallic compound enriched in Cr. Due to its high Cr content, the precipitation of Cr2N deplete the surrounding regions in Cr, which deteriorate the corrosion resistance.15) Pits were observed to initiate in the Cr-depleted zone ad- jacent to Cr2N precipitates in duplex stainless steels (DSSs).23) When annealed at 1333 K, based upon the Icorr
and Ic, the specimens showed the best pitting corrosion resistance.
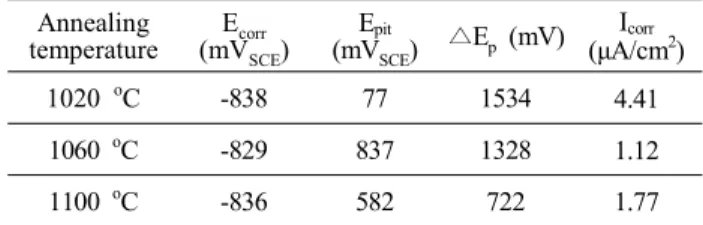
Fig. 3 shows the influence of annealing temperature on the potentiodynamic polarization behavior of the ex- perimental alloys in a deaerated 4 M NaCl solution at 75 oC according to ASTM G 5. The values of the pitting potential (Epit), the corrosion potential (Ecorr), the passive region (△Ep) and the corrosion current density (Icorr) for the experimental alloys are listed in Table 5. In general, the pitting potential (Epit) is defined as the breakdown po- tential destroying a passive film. The highest value of Epit
was 837 mV vs. SCE after annealing at 1060 oC, meaning that the best pitting corrosion resistance of the alloy could
be obtained annealing at 1060 oC. The lowest value of Epit was 77 mV vs. SCE after annealing at 1020 oC, mean- ing that the worst pitting corrosion resistance of the alloy could be obtained annealing at 1020 oC.
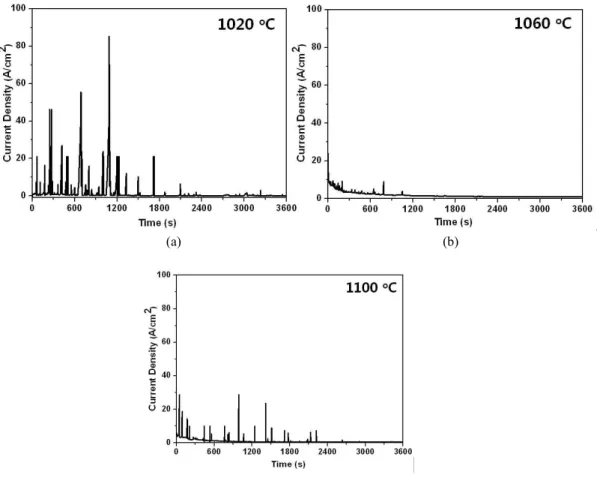
Fig. 4 presents the potentiostatic behavior (the current transient behavior) for the experimental alloys in a dea- erated 4 M NaCl solution at 75 oC with an applied poten- tial of 0 V vs. SCE in the passive region according to ASTM G 5. The potentiostatic test was conducted to ob- serve the formation and the repassivation of meta-stable pits. The current spikes for the formation and the re- passivation of the meta-stable pits of the specimen an- nealed at 1020 oC were more than those of the specimen annealed at 1060 oC and 1100 oC due to the precipitation of deleterious Cr2N. It was assumed that there are two distinct processes before stable pit formation occurs: pit nucleation and growth of the meta-stable pit.18,19) As pre- sented in Fig. 4, the degree of meta-stable pit growth in the specimen annealed at 1020 oC seemed to increase com- pared to those in the specimen annealed at 1060 oC and 1100 oC.
Fig. 5 shows the influence of annealing temperature on the critical crevice temperature (CCT) of the experimental alloys in 6 mass % FeCl3 + 1 mass % HCl per ASTM G 48-method F. The lowest value of CCT was 40 oC after annealing at 1020 oC. The resistance to pitting corrosion of the specimen annealed at 1020 oC was lower than those of the specimen annealed at 1060 oC and 1100 oC due to the precipitation of deleterious Cr2N. The highest value of CCT was 60 oC after annealing at 1060 oC, meaning that the best pitting corrosion resistance of the alloy could be obtained annealing 1060 oC.
3.3. Mechanism of the influence of annealing temperature on the resistance to pitting corrosion
It is well known that the higher the concentrations of the four important alloying elements such as Cr, Mo, W and N to improve pitting corrosion resistance, the better the resistance to pitting corrosion of the stainless steels.
However, there are two phases present with different chemical composition for DSS, with the four key elements
(a) (b)
(c)
Fig. 4. Potentiostatic tests at an applied potential of 0 VSCE in deaerated 4 M NaCl solution at 75 oC of the alloy annealed at different solution-annealing temperatures.
Fig. 5. Critical crevice temperature tests of the alloy annealed at different solution-annealing temperatures.
partitioned between α-phase and γ-phase. Cr, Mo and W are enriched in α-phase and N is enriched in γ-phase, re- sulting in different pitting corrosion resistance between two phases. Besides the chemical composition, the anneal- ing temperature is important factor influencing the pitting
corrosion resistance of DSSs.
The annealing temperature has the strongest effect on the element partitioning. As the annealing temperature de- creased, the volume fraction of α-phase decreased. A smaller volume fraction of α-phase leads to a higher con- centration of Cr and Mo in the α-phase, i.e. PRENα
increases. On the other hand, a larger volume fraction of γ-phase leads to a lower concentration of N and Ni, i.e.
PRENγ decreases. In DSSs, it is important to balance the corrosion resistance of the two phases to reduce galvanic corrosion effect due to the difference in corrosion resist- ance of α-phase and γ-phase.24)
As presented in Table 2, the content of Cr, Mo and W in the γ-phase and the α-phase in the specimens an- nealed at different temperature was quantitatively meas- ured using SEM-EDS. The N content in the α-phase and γ-phase was calculated using a SAM. The values for the PREN were calculated by using the results of the SEM-EDS analysis for Cr, Mo and W, while the values for N were analyzed using a SAM analyzer. The PREN values were calculated using the formula (1) as follows.
(a) (b)
(c)
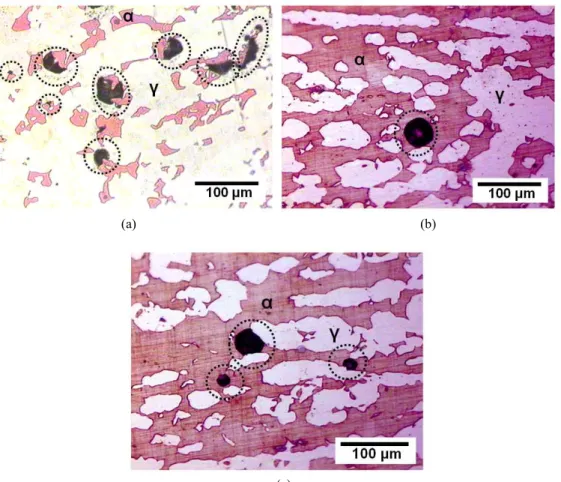
Fig. 6. Optical microstructures after the potentiodynamic anodic polarization tests in deaerated 4 M NaCl solution at 75 oC of the alloy annealed for 2 h at (a) 1020 oC, (b) 1060 oC and (c) 1100 oC.
PREN = [wt. % Cr] + 3.3([wt. % Mo] +
0.5[wt. % W]) + 30[wt. % N] (1) It is shown that alloying elements such as Cr, Mo and W enrich in α-phase, while N are concentrated in γ-phase.
DSSs retain almost all the nitrogen in solid solution within the γ-phase due to high solubility of N in the γ-phase relative to the α-phase. The N is nearly completely sol- utionized in the γ-phase in the DSS, it is rarely sol- utionized in the α-phase; the causes of this are as follows.
The N atoms in the γ-phase with face centered cubic (FCC) lattices occupy the octahedral interstitial sites, lead- ing to a N saturated γ-phase compared with that of the ferrite phase with body centered cubic (BCC) lattices, be- cause the octahedral interstices of the FCC lattice are larg- er than the octahedral interstices and tetragonal interstices of the BCC lattice. The nitrogen solubility in the α-phase has very low of maximum of 0.05 wt.%.25)
Fig. 6 presents optical microstructure after the potentio- dynamic polarization test in a deaerated 4 M NaCl at 75
oC in the alloy annealed for 2 h at 1020 oC, 1060 oC
Fig. 7. The correlation between PREN values for α-phase and γ-phase, CCT and solution-annealing temperature of the alloy.
and 1100 oC. For the specimen annealed at 1020 oC, Cr2N precipitated within γ-phase and at the phase boundaries.
Due to its high Cr content, the precipitation of Cr2N de- pletes the surrounding regions in Cr, which deteriorate the pitting corrosion resistance. Both the Cr2N precip-
Fig. 8. Schematic diagram of the effect of annealing temperature on the microstructure and pitting corrosion in the alloy.
itation and the lower value of PREN for γ-phase (PRENγ
= 47.7; PRENα = 54.4) would make the austenite phase become the preferred sites for pitting attack shown in Fig.
6 (a).
When the specimens were annealed at 1060 oC, the pit firstly initiated at α-phase as shown in Fig. 6 (b), presum- ably due to the lower value of PREN for α-phase (PRENγ
= 52.9; PRENα = 49.0). When the specimens were an- nealed at 1100 oC, the pit firstly initiated at α-phase as shown in Fig. 6 (c), presumably due to the lower value of PREN for α-phase (PRENγ = 53.8; PRENα = 47.8).
Fig. 7 shows the PREN value of each phase and the critical crevice temperatures function of annealing temperature.
As the specimen annealed at 1020 oC, the lowest critical crevice temperature was obtained. For the specimen an- nealed at 1020 oC, Cr2N was found within γ-phase and at the phase boundaries and had a detrimental effect on the pitting corrosion resistance and the value of PREN difference between the γ-phase and the α-phase is the largest. The specimens annealed at 1020 oC showed the worst pitting corrosion resistance due to precipitation of deleterious Cr2N and the value of PREN difference be- tween the γ-phase and the α-phase. The highest critical crevice temperature was obtained when the specimens were annealed at 1060 oC, which meant that the specimens annealed at 1060 oC had the best pitting corrosion resistance. When the specimens were annealed at 1060
oC the value of PREN difference between the γ -phase and the α-phase is the smallest. The specimens annealed at 1060 oC showed the best pitting corrosion resistance due to the value of PREN difference between the γ-phase and the α-phase.
The effect of the annealing temperature on the micro-
structure and pitting corrosion of the alloy is schematically presented in Fig. 8.
In this work, the pitting corrosion resistance of HDSS is strongly dependent on the microstructure, namely the presence of Cr2N, elemental partitioning behavior and vol- ume fraction of γ -phase and the α-phase and the value of PREN difference between the γ-phase and the α-phase.
4. Conclusions
To elucidate the influences of annealing temperature on the microstructure and resistance to pitting corrosion of the HDSS, potentiodynamic anodic polarization test, po- tentiostatic test, a critical crevice temperature test, a scan- ning electron microscope-energy dispersive spectroscope (SEM-EDS) analysis were conducted. These various tests led to the following conclusions.
1) When annealed at 1020 oC, the rounded and acicular Cr2N particles randomly precipitate within γ-phase and at phase boundaries and the value of PREN difference between the γ-phase and the α-phase is the largest.
Based on the results of electrochemical test and critical crevice temperature, the specimens annealed at 1020
oC showed the worst pitting corrosion resistance due to precipitation of deleterious Cr2N and the value of PREN difference between the γ-phase and the α-phase.
2) When annealed at 1060 oC, no intermetallic compounds such as Cr2N and σ phase were observed and the value of PREN difference between the γ-phase and the α -phase is the smallest. The specimens annealed at 1060
oC showed the best pitting corrosion resistance due to the value of PREN difference between the γ-phase and the α-phase.
This work has been supported by Ministry of Knowledge Economy of the Republic of Korea.
References
1. J. Olson and S. Nordin: Proc. Duplex Stainless Steel ’86, p. 219 (1986).
2. E. Perteneder, J. Tosch, P. Reiterer and G. Rabensteiner:
Proc. Duplex Stainless Steel ’86, p. 48 (1986).
3. J.-O. Nilsson: Mater. Sci. Technol., 8, 685 (1992).
4. The International Molybdenum Association (IMOA):
Practical Guidelines for the Fabrication of Duplex Stainless Steel, (Pergamon Press) p. 1 (2009).
5. H. Okamoto: Proc. Applications of Stainless Steels’92, Vol. 1, p. 360 (1992).
6. S. H. Jang, S. T. Kim, I. S. Lee, Y. S. Park: Mater. Trans., 52, 1228 (2011).
7. J. S. Lee, S. T. Kim, I. S. Lee, G. T. Kim, J. S. Kim, Y. S. Park: Mater. Trans., 53, 1048 (2012).
8. S. H. Jeon, S. T. Kim, I. S. Lee, G. T. Kim, J. S. Kim, Y. S. Park: Mater. Trans., 52, 416 (2011).
9. L. Weber, P.J. Uggowitzer, Mater. Sci. Eng. A, 242, 222 (1998).
(1999).
15. Z. Z. Yuan, Q. X. Dai, X. N. Cheng, K. M. Chen, Mater.
Charact., 58, 87 (2007).
16. J. W. Simmons, Mater. Sci. Eng. A, 207, 159 (1996).
17. H. Y. Ha, H. S. Kwon, Electrochim. Acta, 52, 2175 (2007).
18. R. A. Perren, T. Suter, C. Solenthaler, G. Gullo, P. J.
Uggowitzer, H. Bohni,M. O. Speidel, Corros. Sci., 43, 727 (2001).
19. ANNUAL BOOK of ASTM STANDARDS, ASTM G 5.
20. P. C. Pistorius and G. T. Burstein: Corros. Sci., 33, 1885 (1992).
21. G. T. Burstein, P. C. Pistorius and S. P. Mattin, Corros.
Sci., 35, 57 (1993).
22. ANNUAL BOOK of ASTM STANDARDS, ASTM G 48-method A
23. Z. L. Zhang, T. Bell, Surf. Eng., 1, 131 (1985).
24. R. A. Perren, T. A. Suter, P. J. Uggowitzer, L. Weber, R. Magdowski, H. Böhni, M. O. Speidel, Corros. Sci., 43, 707 (2001).
25. Migiakis, K., Papadimitriou, J. Mater. Sci., 44, 6372 (2009).