Effect of Aging Time on the Resistance to Localized Corrosion of the Hyper Duplex Stainless Steel
Soon-Hyeok Jeon, Soon-Tae Kim, In-Sung Lee, Ji-Soo Kim1, Kwang-Tae Kim1, and Yong-Soo Park†
Department of Material Science and Engineering, Yonsei University, 134 Shinchon-dong, Seodaemun-gu, Seoul 120-749, Republic of Korea
1Stainless Steel Research Group, POSCO Technical Research Laboratories Goedong-dong, Nam-Gu, Pohang, Gyeongbuk 790-785, Republic of Korea (Received September 15, 2010; Revised October 19, 2010; Accepted October 21, 2010)
To elucidate the effect of aging time on resistance to localized corrosion of hyper duplex stainless steel, a double-loop electrochemical potentiokinetic reactivation test a potentiodynamic anodic polarization test, a scanning electron microscope-energy dispersive spectroscope analysis, and a thermodynamic calculation were conducted. With an increase in aging time, sigma phases are precipitated much more than chi phases due to the meta-stable chi phase acting as a transition phase. As aging time at 850 ℃ increases, the corrosion resistance decreases owing to an increase in Cr, Mo and W depleted areas adjacent to the intermetallic phases such as sigma phases and chi phases.
Keywords : duplex stainless steels, secondary phase, pitting corrosion, SEM
†Corresponding author: [email protected]
1. Introduction
Super duplex stainless steels with PREN (Pitting Resis- tance Equivalent Number = wt.% Cr + 3.3(wt.% Mo + 0.5xwt.% W) + 30xwt.% N) 46 have been increasingly used for various applications such as power plants, de- salination facilities and chemical plants due to high resist- ance to pitting and crevice corrosion, excellent mechanical properties and a relatively low cost, compared with other higher performance materials such as super austenite stain- less steels.1)-3)
However, in heat exchanger application, corrosion re- sistance of super duplex stainless is insufficient for higher temperature service or for a long service life, and where materials, with even higher corrosion resistance, are needed.
Hence, hyper duplex stainless steels (HDSS) with a PREN above 50 were developed to meet industry demands for higher operating temperatures and longer run times.
The secondary phases such as sigma (σ) phase and chi (χ) phase are the intermetallic phases that forms at high temperature 600-950 ℃.4),5) These intermetallic phases lower the fracture toughness and the corrosion resistance significantly.6),7) The σ-phase preferentially precipitates in-
to the ferrite due to the higher Cr and Mo concentration in the ferrite phase.8) A fundamental reason why the sigma phase preferentially grows into the ferrite phase is that the ferrite phase is thermodynamically meta-stable at tem- perature where the sigma phase precipitates.9)
Park et al.10) reported that the χ-phase precipitates ear- lier than the σ-phase, and χ-phase appears to be meta-sta- ble and act as a transition phase in the ferritic stainless steels. Cao et al.11) also suggested that the χ phase had a lower nucleation barrier than the σ phase, but only stable σ phase survived after long aging.
Recent studies12)-14) showed that a partial substitution of W for Mo in duplex stainless steels not only increased the resistance to pitting corrosion of the alloys by a syner- gic effects of Mo and W but also retarded the formation of σ phase in the alloys.
The effect of the σ phase and χ phase on the resistance to localized corrosion of the super duplex stainless steels has been investigated. However, the effects of intermetallic phases on the resistance to localized corrosion of the hyper duplex stainless steels have not been verified. Therefore, it is necessary to predict the phase diagram, chemical com- positions of intermetallic phases using Thermo-Calc soft- ware and to investigate the behaviors of localized corro- sion and precipitation of intermetallic phases for an aged
Table 1. Chemical compositions of the experimental alloy (wt.%).
Alloy Designation C Cr Ni Mo W Si Mn S N Fe
WBASE 0.020 27.29 7.06 2.58 3.39 0.22 1.46 0.0037 0.33 Bal.
HDSS with PREN 50 developed by the authors.
In this study, to elucidate the effect of aging time on the resistance to localized corrosion of hyper duplex stain- less steel, a double-loop electrochemical potentiokinetic reactivation (DL-EPR) test, potentiodynamic anodic polar- ization test, a scanning electron microscope-energy dis- persive spectroscope (SEM-EDS) analysis, thermody- namic calculation were conducted.
2. Experimental methods
The experimental alloy was manufactured using a high frequency vacuum induction furnace and then hot rolled to plates of 6 mm thickness. The experimental alloy was cut and solution heat-treated for 5 min per 1 mm thickness at 1090 ℃ and then quenched in water. The specimens were then isothermally aged at 850 ℃ for 10 and 30 min.
Chemical compositions of the experimental alloys are pre- sented in Table 1.
To predict the phase diagram and chemical composition of secondary phases of the experimental alloy, thermody- namic calculation using Thermo-Calc software was con- ducted. The steel database TCFE5 available with the Thermo-Calc software was used to perform the calculation and it should be stressed that such calculation give the equilibrium state of system.
The intermetallic phases were observed using scanning electron microscopy (SEM) in backscattered electron (BSE) mode. In addition, the chemical compositions of the secon- dary phases were analyzed by an energy dispersive spec- troscopy (EDS) attached to the SEM.
The double loop electrochemical potentiokinetic tests are conducted following the recommendations of Majidi and Streicher.15) The double loop electrochemical potentio- kinetic reactivation (DL-EPR) test was originally used to evaluate the degree of sensitization of stainless steels.16) DL-EPR test was applied to selectively attack the matrix around fine precipitates formed during aging, without an attack on the precipitates themselves. DL-EPR test was conducted in 2 M H2SO4+ 0.01 M KSCN + 0.5 M NaCl at 30 ℃. The degree of Cr-depletion in the alloys was evaluated by measuring the ratio of reactivation peak cur- rent (ir) to activation peak current (ia) when the potential was applied at a scan rate of 0.06 V/min from -600 to 200 mVSCE, and then reversely to -600 mVSCE, respectively.
To analyze the effects of secondary phases on the resist- ance to pitting corrosion of the experimental alloy, a po- tentiodynamic anodic polarization test was conducted. To measure the pitting potential (Ep) and the passive current density of the alloys, the potentiodynamic anodic polar- ization test was conducted in a deaerated 22 wt.% NaCl solution at 70 ℃ and a deaerated 0.5 N HCl + 1 N NaCl solution at 40 ℃ per the ASTM G 5.15) Test specimens were joined with copper wire through soldering (95 wt.%
Sn-5 wt.% Sb), and then mounted with an epoxy resin.
One side of the sample was ground to 600 grit using SiC abrasion paper. After defining the exposed area of the test specimen as 1 cm2, the remainder was painted with a trans- parent lacquer. The test was conducted at a potential range of -0.65 VSCE ~ + 1.1 VSCE and a scanning rate of 0.06 V/min, using a saturated calomel electrode.
3. Results and discussion
3.1 Thermodynamic calculations
The computer program Thermo-Calc was used to predict the stability of phases and to estimate the phase mole frac- tion of these as a function of temperature. The equilibrium fractions of each phase versus temperature for the WBASE alloy were calculated using a commercial Thermo-Calc software (Fig. 1) package. It can be predicted that the opti- mum temperature of solution heat-treatment to obtain the
Fig. 1. Mole fraction of stable phases in the alloy-WBASE calculated using Thermo-Calc software.
(a) (b)
Fig. 2. Chemical composition (wt. %) of intermetallic phases in WBASE alloy calculated using a Thermo-Calc software : (a) sigma phase and (b) chi phase.
μm 50 mμ 50
χ
σ
σ
χ
30 min at 850℃
10 min at 850℃ 30 min at 850℃
10 min at 850℃
Fig. 3. Back-scattered electron (BSE) images of the alloy-WBASE at 850 ℃ for 10 min and 30 min.
desired microstructure of 50 vol.% austenite (γ) phase and 50 vol.% ferrite (δ) phase is 1100 ℃.
Fig. 2 shows that the chemical composition of the sigma and chi phases in WBASE alloy according to the calcu- lation is plotted. It can therefore be assumed that it is redis- tribution of the alloying elements, Cr, Mo and W in partic- ular, which foregoes formation of secondary phases that causes the degradation of corrosion resistance of the stain- less steels after aging heat treatment. The chemical compo- sition of these phases, such as sigma (σ) and chi (χ), dif- fers from the experimental results. The chromium in the sigma phase is much higher than that obtained experi- mentally and the molybdenum in the chi phases is much lower than that obtained experimentally.
3.2 Precipitation of intermetallic phases
Fig. 3 shows back-scattered electron (BSE) images of
the WBASE alloy aged at 850 ℃ for 10 and 30 min. After aging for 10 min at 850 ℃, a few chi phases were pre- cipitated along grain boundaries and sigma phases were precipitated randomly within grain of ferrite (δ) phases in the WBASE alloy. After aging for 30 min at 850 ℃, the amount of the intermetallic phases precipitated at grain boundaries and within grains increased in the WBASE alloy. Especially, the chi phases were coarsened and the sigma phases were precipitated widely along grain bounda- ries as well as within grains of δ phases.
Fig. 4 shows the high magnification BSE image of the secondary phases of the alloy-WBASE aged at 850 ℃ for 10 and 30 min, respectively. For the alloy-WBASE aged for 10 min, fine precipitates of chi (χ) phases were pre- cipitated along grain boundaries of δ phases and sigma phases were precipitated randomly within grain of δ phases. After aging for 30 min, the χ phases were coars-
(a) (b)
Fig. 4. BSE images of intermetallic phases of the WBASE alloys at 850 ℃ for (a) 10 min and (b) 30 min.
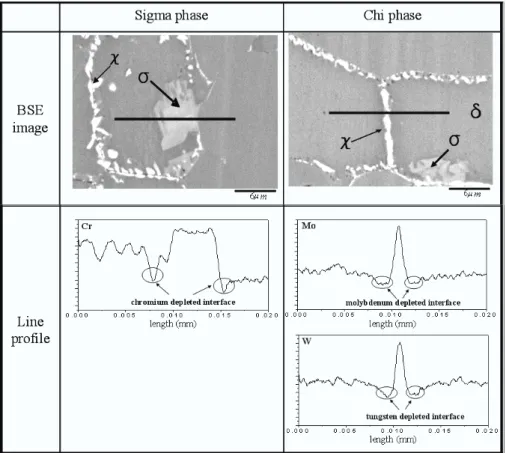
Fig. 5. Electron probe micro analyzer (EPMA) line profile of the intermetallic phases in the alloy-WBASE at 850 ℃ at 10 min.
Table 2. Chemical composition (wt.%) of the sigma and chi phases of the WBASE alloy.
Aging Time Phase Chemical compositions (wt.%)
Cr Mn Fe Ni Mo W
10 min. Sigma-(a) 29.36 1.08 55.18 5.24 4.31 4.83
Chi-(b) 25.87 2.67 42.60 3.10 11.92 13.84
30 min. Sigma-(c) 31.36 1.26 54.30 4.20 3.96 4.92
Chi-(d) 26.94 1.60 44.65 3.69 10.07 13.04
0 5 10 15 20 25 30 0
5 10 15 20 25 30 35 40 45 50 55 60 65
70 σ phase
Area Fraction (%)
Aging Time at 850 oC (minutes)
0 5 10 15 20 25 30
0 5 10 15 20 25 30 35 40 45 50 55 60 65 70
Aging Time at 850 oC (minutes)
Area Fraction (%)
χ phase
(a) (b)
0 5 10 15 20 25 30
0 5 10 15 20 25 30 35 40 45 50 55 60 65
70 intermetallic phases
(
σ + χ)Aging Time at 850 oC (minutes)
Area Fraction (%)
(c)
Fig. 6. Area fraction of secondary phases formed in alloy-WBASE with aging at 850 ℃ : (a) σ phase, (b) χ phase and (c) σ + χ phases.
ened, and some relatively large sigma (σ) phases were pre- cipitated within grains of δ phases. The chemical composi- tions of χ phases and σ phases of the WBASE alloy are presented in Table 2. The χ phases were composed of molybdenum and tungsten much more than those of the sigma phases whereas the χ phases were composed of chromium less than that of the sigma phases.
The electron probe micro analyzer (EPMA) line profile of the intermetallic phases shows that the formation of sigma phases and chi phases lead to Cr, Mo and W de- pleted areas at the interfaces between δphases and inter- metallic phases (Fig. 5).
Fig. 6 shows the area fraction of σ phase, χ phase and total intermetallic phases in the WBASE alloy aged at 850
℃. The area fractions of these intermetallic phases were measured by image analyzer. With an increase in aging time, the area fraction of sigma phase precipitated in the
alloy-WBASE increases (Fig. 6(a)). However, the area fraction of chi phase precipitated in the alloy-WBASE in- creases only up to 10 min. (Fig. 6(b)). Fig. 6(c) shows that the area fraction of formed secondary phases of al- loy-WBASE is increased linearly.
With an increase in aging time, sigma phases (σ) are precipitated much more than chi phases (χ) due to the meta-stable chi phase acting as a transition phase.
Fig. 7 shows the X-ray diffraction patterns of WBASE alloy aged at 850 ℃ for 10 and 30 min. With increasing aging time, the peak of ferrite phase is led to become lower conspicuously, gradually deriving sigma phase. Small amounts of sigma and chi phases are not detected by X-ray diffraction due to overlap between secondary phases with ferrite phase and, mainly, austenite phase reflections.
Nevertheless, one of the sigma phase reflections (212) is led to become higher conspicuously.
40 42 44 46 48 50 52 0
50 100 150 200 250 300
Intensity (cps)
2θ (ο)
10min at 850oC 30min at 850oC (110)δ
γ (111)
(112)σ
(411)σ
γ (200)
(212)σ
Fig. 7. X-ray diffraction patterns of alloy-WBASE aged at 850
℃ for 10 min and 30 min.
3.3 Effects of aging time on the sensitization
The formations of the intermetallic phases result in Cr, Mo and W depletions adjacent to χ-phases and σ-phases.
The degree of Cr, Mo and W depletions around secondary phases formed during aging was examined by double loop electrochemical potentiokinetic tests conducted in 2 M H2SO4+ 0.01 M KSCN + 0.5 M NaCl solution at 30 ℃.
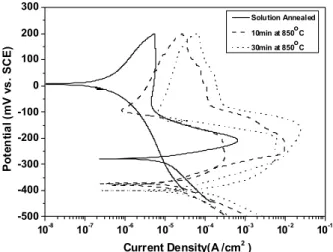
Fig. 8 shows the behaviors of DL-EPR test for the al- loy-WBASE aged at 850 ℃ for 10 and 30 min. A small reactivation current peak (ir) was measured in the al- loy-WBASE aged at 850 ℃ for 10 min, whereas a large reactivation current peak was measured in the al- loy-WBASE aged at 850 ℃ for 30 min. With an increases in aging time at 850 ℃, the reactivation current peak of alloy-WBASE became higher.
10-8 10-7 10-6 10-5 10-4 10-3 10-2 10-1 -500
-400 -300 -200 -100 0 100 200 300
Potential (mV vs. SCE)
Current Density(A /cm2 )
Solution Annealed 10min at 850oC 30min at 850oC
Fig. 8. Effect of aging time on DL-EPR behavior of alloy-WBASE in 2 M H2SO4+ 0.01 M KSCN + 0.5 M NaCl solution at 30
℃.
0 5 10 15 20 25 30
0.00 0.05 0.10 0.15 0.20 0.25 0.30
Aging Time (min.)
I r /
I a
Fig. 9. Effect of aging time on the ratio of reactivation to activation current peak (ir/ ia) of alloy-WBASE.
The degree of Cr, Mo and W depletions with aging for alloy-WBASE is represented by the ratio of reactivation peak current (ir) to activation peak current (ia) that were obtained from the double-loop electrochemical potentioki- netic tests as shown in Fig. 9. The ratio of ir/ ia for WBASE alloy aged at 850 ℃ for 30 min was much higher than that for alloy-WBASE aged at 850 ℃ for 10 min.
This indicates that the degree of Cr, Mo and W-depletions in the alloy-WBASE aged at 850 ℃ for 30 min is greater than that in alloy-WBASE aged at 850 ℃ for 10 min.
3.4 Effect of aging time on the resistance to pitting corro- sion
Fig. 10 shows the effect of aging time on the potentiody- namic anodic polarization behaviors of the WBASE alloy in a deaerated 22 wt.% NaCl solution at 70 ℃ per ASTM G 5. In general, the pitting potential (Ep) is defined as the breakdown potential destroying a passive film. As the
10-7 10-6 10-5 10-4 10-3 10-2 -1000
-800 -600 -400 -200 0 200 400 600 800 1000 1200
Solution Annealed 10min at 850oC 30min at 850oC
Potential (mV vs. SCE)
Current Density(A /cm2 )
Fig. 10. Effect of aging time on potentiodynamic polarization behavior of the WBASE alloy in deaerated 22 wt.% NaCl solution at 40 ℃ according to ASTM G 5.
Ep of an alloy increases, the resistance to pitting corrosion of the alloy increases. With increasing aging time, the re- sistance to pitting corrosion decreased due to a decrease in the Ep.
The reason that the resistance to pitting corrosion with increasing aging time decreased is as follows: The for- mations of the secondary phases result in Mo and W deple- tions adjacent to χ-phases and Cr depletion adjacent to σ-phases, which deteriorate the corrosion resistance. With an increase in aging time at 850 ℃, the total amount of the secondary phases is increased and thus the corrosion resistance decreases.
4. Conclusions
To elucidate the effect of aging time on the resistance to localized corrosion of the hyper duplex stainless steel, a double loop electrochemical potentiokinetic reactivation test, potentiodynamic anodic polarization test, a SEM-EDS analysis, thermodynamic calculation were conducted. The conclusions made in the present research can be summar- ized as follows.
1) With an increase in aging time, sigma phases (σ) are precipitated much more than chi phases (χ) due to the meta-stable chi phase acting as a transition phase.
2) As aging time at 850 ℃ increases, the ratio of re- activation peak current (ir) to activation peak current (ia) increases.
3) With increasing aging time, the resistance to pitting corrosion decreased due to an increase in the passive cur- rent density and the critical passive current density in ac- tive region in a deaerated 0.5 N HCl + 1 N NaCl solution.
4) With increasing aging time, the resistance to pitting corrosion decreased due to a decrease in the Ep in a dea- erated 22 wt.% NaCl solution.
5) As aging time at 850 ℃ increases, the resistance to pitting corrosion decreases owing to an increase in Cr, Mo and W depleted areas adjacent to the intermetallic phases such as σ and χ.
References
1. J. Olson, S. Nordin, Proceedings of Duplex Stainless Steels Symp. Proc., The Hague, p. 219 (1986).
2. E. Perteneder, J. Tosch, P. Reiterer, G. Rabensteiner, ibid, p. 48.
3. J.-O. Nilsson, Mater. Sci. Tech., 8, 685 (1992).
4. R.F. Steigerwald, Corrosion, 45, 510 (1989).
5. H. Kiesheyer, H. Brandis, Z. Metallkd., 67, 258 (1976).
6. N. Lopez, M. Cid, and M. Puiggali, Corros, Sci., 41, 1615 (1999).
7. J. O. Nilson, P. Kangas, T. Karlsson, and A. Wilson, Met. Mat. Trans. A, 31, 35 (2000).
8. A. J. Strutt, G. W. Lorimer, C. V. Roscoe, and K. J.
Gradwell, Proceedings of the Duplex Stainless Steels '86, p. 310 (1986).
9. C. S. Huang and C. C. Shih, Mat. Sci. Eng. A, 402, 66 (2005).
10. C. J. Park, M. K. Ahn, and H. S. Kwon, Mat. Sci. Eng.
A, 418, 211 (2006).
11. H. L. Cao, S. Hertzman, W. B. Hutchision, Stainless steels '87, The Institute of Metals, The University of York, September, p. 454 (1988).
12. J. S. Kim and H. S. Kwon, Corrosion, 55, 512 (1999).
13. C. J. Park and H. S. Kwon, Corros. Sci., 44, 2817 (2002).
14. C. J. Park and H. S. Kwon, Corro. Sci. Tech., 5, 189 (2006).
15. A.P. Majidi and M.A. Streicher, Corrosion, 40, 584 (1984).
16. M. K. Ahn, H. S. Kwon, and J. H. Lee, Corrosion, 51, 441 (1995).
17. Annual Book of ASTM Standards, ASTM G 5.