J Korean Soc Radiol 2016;75(4):285-295 http://dx.doi.org/10.3348/jksr.2016.75.4.285
INTRODUCTION
Recently, reducing radiation dose to all body parts of chil- dren and adults has been a paramount issue in diagnostic radi- ology (1). Among various techniques used to reduce radiation dose, lowering peak tube voltage has been a clear trend because radiation dose changes approximately with the square of tube potential (2-5). Lowering peak tube voltage provides improved contrast enhancement of iodine-containing vascular and paren-
chymal organs because it provides a greater photoelectric effect with decreased Compton scattering (6, 7). Inevitably, lowering peak tube voltage can lead to greater image noise and poor im- age quality, thus resulting in decreased diagnostic accuracy. This prevented clinical implementation of techniques for lowering peak tube voltage in the past, particularly in abdominal CT ap- plication (8). However, a new algorithm for concurrently adjust- ing the high-output tube current known as automatic tube cur- rent modulation (ATCM) can counterbalance greater image
100 kVp Low-Tube Voltage Abdominal CT in Adults: Radiation Dose Reduction and Image Quality Comparison of 120 kVp Abdominal CT
성인에서 100 kVp와 120 kVp 관접압을 이용한 복부 전산화단층촬영의 방사선량 감소와 영상의 질 비교
Hong Il Ha, MD
1, Seong Sook Hong, MD
2*, Min-Jeong Kim, MD
1, Kwanseop Lee, MD
11Department of Radiology, Hallym University Medical Center, Hallym University Sacred Heart Hospital, Anyang, Korea
2Department of Radiology, Soonchunhyang University College of Medicine, Soonchunhyang University Seoul Hospital, Seoul, Korea
Purpose: To compare image quality and the effect of radiation dose reduction after decreasing tube voltage from 120 kVp to 100 kVp for abdominal CT in adults.
Materials and Methods: A total of 200 patients who underwent abdominal CT at 120 kVp (n = 100) or 100 kVp (n = 100) were enrolled. Automatic tube current mod- ulation was applied with other scan parameters being constant. Radiation dose was calculated based on CT dosimetry index. The image quality of abdominal organs and image noise were assessed quantitatively and qualitatively.
Results: A radiation dose reduction of 13.3% was found in the 100 kVp group. On quantitative analysis, image noise was increased up to 47% in the 100 kVp group.
CT numbers of liver, pancreas, renal cortex, aorta, portal vein, and psoas muscle in the 100 kVp group were significantly (p < 0.05) higher than those in the 120 kVp group. Signal-to-noise ratio was significantly higher (p < 0.05) in the 120 kVp group. Contrast-to-noise ratio (CNR) of the liver was higher in the 120 kVp group.
However, no significant (p > 0.05) difference was observed in the CNR of other or- gans between the two groups. On qualitative analysis, noise texture of abdominal organs, artifact, and diagnostic acceptability were not significantly (p > 0.05) differ- ent.
Conclusion: 100 kVp abdominal CT reduced radiation dose by 13.3% without sacri- ficing image quality compared to 120 kVp abdominal CT.
Index terms Abdomen
Tomography, X-ray Computed Adult
Diagnostic Imaging Technology, Radiologic
Received December 22, 2015 Revised January 22, 2016 Accepted March 5, 2016
*Corresponding author: Seong Sook Hong, MD Department of Radiology, Soonchunhyang University College of Medicine, Soonchunhyang University Seoul Hospital, 59 Daesagwan-ro, Yongsan-gu, Seoul 04401, Korea.
Tel. 82-2-709-9396 Fax. 82-2-709-9066 E-mail: [email protected]
This is an Open Access article distributed under the terms of the Creative Commons Attribution Non-Commercial License (http://creativecommons.org/licenses/by-nc/3.0) which permits unrestricted non-commercial use, distri- bution, and reproduction in any medium, provided the original work is properly cited.
noise at low tube voltages (9). With the advances in ATCM, re- cent CT scanner can automatically select tube voltage depending on the patients’ attenuation profile from CT topogram, thus en- abling us to lower tube voltage from 120 kVp to 100 kVp or even 80 kVp (10).
100 kVp chest, pulmonary, or head CT angiographies has been proven to be useful for diagnostic purposes (11-14). Although 100 kVp abdominal CT was effective in older children in a phan- tom study, a few in vivo studies of lowering the tube potential from the standard 120 kVp to 100 kVp or even 80 kVp for ab- dominal CT and liver dynamic CT have been reported (15-17).
However, these studies mainly evaluated hypervascular hepatic lesions, vascular structures, or iodine-filled structures rather than general image quality. In addition, a few in vivo studies of using 100 kVp abdominal CT in adults have been performed with a small number of patients (17-19). Therefore, the purpose of this study was to compare image quality of abdominal organs and the effect of radiation dose reduction after decreasing tube volt- age from 120 kVp to 100 kVp in abdominal CT in adult patients.
MATERIALS AND METHODS
This study was approved by Institutional Review Board. The requirement of written informed consent was waived since the scan protocol introduced herein was routinely used in all pa- tients undergoing clinically indicated CT at our institution. A total of 200 patients with body mass index (BMI, kg/m2) of less than 30 kg/m2 were enrolled. We excluded obese patients (BMI
≥ 30 kg/m2) because image quality in these patients was empiri- cally poor at a tube voltage of 100 kVp. The abdomen-pelvic CT protocol was consisted of a non-enhanced and a contrast-en- hanced series. All patients were scanned from the basal lung to pubic symphysis. We included patients who received only one type of intravenous nonionic contrast medium. In each patient, 100–120 mL of iomeprol (Iomerol®; Bracco, Italy) was injected at a flow rate of 2.5 mL/s without additional saline injection for contrast enhanced series. No oral contrast medium was ingest- ed for gastrointestinal tract opacification. Portal venous phase contrast-enhanced series was obtained at 70–90 seconds after the initiation of contrast material injection. All patients were examined with the same 128-slice MDCT scanner (Somatom Definition Flash; Siemens Healthcare, Forchheim, Germany)
from 1st January 2014 to 31st March 2014. One hundred patients (mean age, 64.3 ± 17.2 years; range, 18–89 years, 66 males, 34 female patients) underwent CT with fixed tube potential at 120 kVp (120 kVp group). The other one hundred patients (mean age, 63.8 ± 16.1 years; range 17–90 years, 52 males, 48 female patients) underwent CT with fixed tube potential at 100 kVp (100 kVp group). The algorithm takes into account that the max- imum tube current at the prefixed tube voltage can maintain adequate image quality level. The image quality level of attenua- tion-based tube current modulation (CAREdose 4D; Siemens Healthcare, Forchheim, Germany) corresponded to 289 ref. mAs at 100 kVp and 210 ref. mAs at 120 kVp, respectively. These refer- ence tube current settings were default settings from the vendor.
Other CT parameters were kept constant: detector collimation 128
× 0.6 mm; slice collimation 64 × 0.6 mm by means of a z-flying fo- cal spot; pitch, 0.9; and rotation time, 0.5 s. Abdominal CT images were reconstructed using a medium-smooth soft tissue convolu- tion kernel (B40f) without using iterative reconstruction (IR).
Measurement of Radiation Dose
Each patient’s effective mAs, volume of the computed tomog- raphy dose index (CTDIvol), and dose length product (DLP) provided by the CT scanner were recorded. Estimated effective radiation doses were calculated by multiplying total DLP with the conversion coefficient factor (k = 0.015 mSvmG-1cm-1) (20).
Quantitative Image Quality Analysis
Quantitative assessment of image quality was performed on a PACS work station (Piview, INFINITT Healthcare, Seoul, Ko- rea). One independent and blinded radiologist calculated the mean Hounsfield unit (HU) value for two regions of interest in the liver, pancreas, renal cortex, abdominal aorta above and be- low the renal artery take off level, main portal vein, and psoas muscle at L4 level. Standard deviation of air outside the patient (HU) was considered as background image noise. Signal-to- noise ratio (SNR) and contrast-to-noise ratio (CNR) of each or- gan were calculated using the following equations:
SNR target organ = HU target organ/background image noise
CNR target organ = (HU target organ - HU psoas muscle)/background image noise
Qualitative Image Quality Analysis
Overall image quality and artifacts were independently and blindly evaluated by two board-certified radiologists with more than 7 years of experience in abdominal radiology. Noise tex- ture, artifacts, and diagnostic acceptability were evaluated using a 4-point scale based on a modified European Quality Criteria scoring system (21). Noise texture were rated with a 4-point scale for the liver, pancreas, renal cortex, and psoas muscles (0, changes affecting serious misdiagnosis or blotchiness; 1, chang- es probably affecting diagnosis; 2, mild change do not affect di- agnosis; 3, average or no change). Artifact and diagnostic ac- ceptability was rated after fully reviewing each CT scan. Artifact was rated with a 4-point scale (0, severe artifact, degraded or affecting diagnosis; 1, moderate artifact affecting the visualiza- tion of normal structures; 2, mild artifact not affecting the visu- alization of any structure; 3, no artifact). Diagnostic acceptabili- ty was assessed with a 4-point scale based on the confidence of the radiologist who assessed abdominal findings (0, unaccept- able; 1, acceptable under limited condition; 2, probably accept- able; 3, fully acceptable for diagnostic interpretation).
Statistical Analysis
Continuous variables were expressed as means and standard deviations. Interobserver agreement was assessed with weight- ed kappa (k) statistic (k > 0.81: excellent agreement; k = 0.61–
0.80: good agreement; k = 0.41–0.60: moderate agreement; k = 0.21–0.40: fair agreement; k < 0.20: poor agreement). Patient’s age, BMI, radiation dose, and quantitative image parameters (attenuation values, image noise, SNR, and CNR), corrected by Welch’s test depending on normality testing were tested with in- dependent t-test. Qualitative analysis of image quality was com- pared using Wilcoxon signed-rank test. Statistical analysis was performed with MedCalc software (MedCalc 13.1.2, Ostend, Belgium). A p < 0.05 was considered as statistically significant.
RESULTS
Demographics and Radiation Dose Analysis
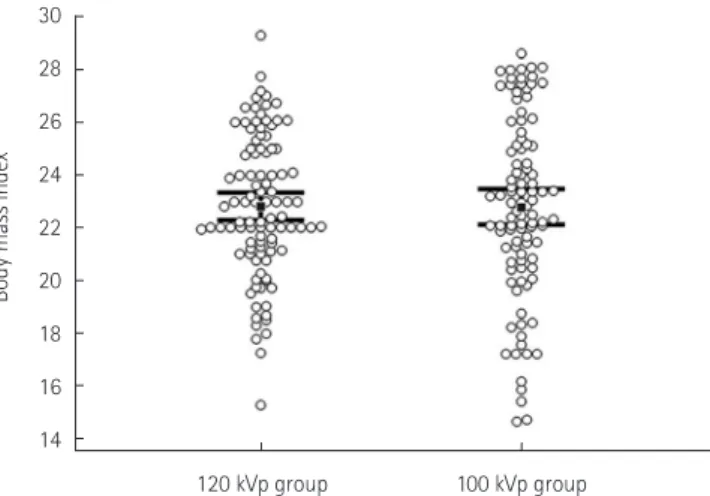
There was no significant (p > 0.05) difference in patient age (64.3 ± 17.2 years vs. 63.8 ± 16.1 years), scan length (54.2 ± 4.6 cm vs. 54.5 ± 6.7 cm), or BMI (23.0 ± 2.9 vs. 23.0 ± 3.6) be- tween the 120 kVp group and the 100 kVp group (Fig. 1). Radi- ation doses for both protocols are summarized in Table 1. CT- DIvol, DLP, and mean effective mAs values in the 120 kVp group and the 100 kVp group were 9.4 ± 3.1 mGy and 8.2 ± 2.2 mGy, 516.2 ± 189.6 and 450.1 ± 148.3, and 139.2 ± 45.8 and 194.9 ± 56.6, respectively (p = 0.0010, 0.0010, 0.0064). A radiation dose reduction of approximately 13.3% was found in the 100 kVp group compared to that in the 120 kVp group.
Quantitative Image Quality Analysis
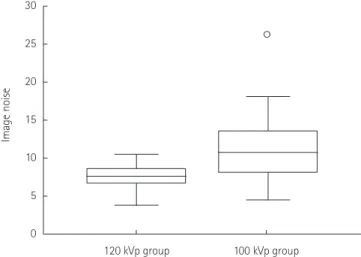
Background image noise (standard deviation of outside air CT number) in the 100 kVp group (10.6 ± 3.8) was significantly (p < 0.0001) higher than that (7.2 ± 1.5) in the 120 kVp group (Fig. 2). CT numbers, SNR, and CNR of each abdominal organ
Fig. 1. Body mass index distribution showing no significant difference between 120 kVp and 100 kVp groups (p = 0.9477).
30 28 26 24 22 20 18 16 14
Body mass index
120 kVp group 100 kVp group
Table 1. Radiation Dose (Mean ± SD)
120 kVp Group 100 kVp Group p-Value
CTDIvol (mGy) 9.4 ± 3.1 8.2 ± 2.2 0.001
DLP (mGy∙cm) 516.2 ± 189.6 450.1 ± 148.3 0.006
Reference mAs 210 286 < 0.001
Effective mAs 139.2 ± 45.8 194.9 ± 56.6 < 0.001
Effective radiation dose (mSv) 7.7 6.8 0.001
p-value was obtained from an independent sample t-test.
CTDIvol = volume of the computed tomography dose index, DLP = dose length product, SD = standard deviation
are summarized in Table 2. SNR of all abdominal organs except portal vein in the 120 kVp group was significantly (p < 0.05) high- er than that in the 100 kVp group. However, CNR of all abdom- inal organs except the liver showed no significant (p > 0.05) dif- ference between the two groups. CNR of the liver in the 120 kVp group (8.1 ± 3.8) was significantly (p < 0.05) higher than that (6.7 ±
3.7) in the 100 kVp group. CNR of the aorta and portal vein showed no significant (p = 0.17 and 0.63, respectively) difference between the two groups.
Qualitative Image Quality Analysis
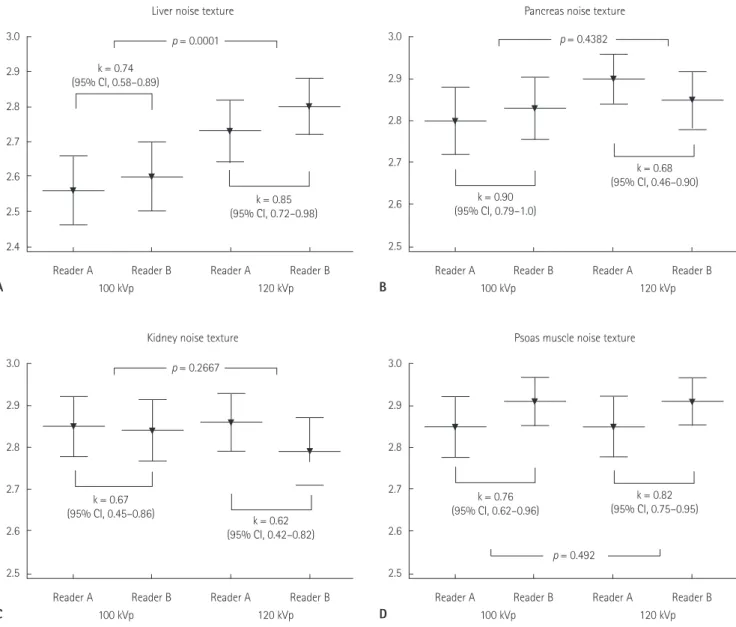
Hepatic noise texture was scored at 2.56 ± 0.50 and 2.60 ± 0.49 on the 100 kVp scan by two readers compared to 2.73 ± 0.45 and 2.80 ± 0.40 on the 120 kVp scan (Fig. 3A). Pancreatic noise texture was scored at 2.80 ± 0.40 and 2.83 ± 0.38 on the 100 kVp scan compared to 2.90 ± 0.30 and 2.85 ± 0.36 on the 120 kVp scan (Fig. 3B). Renal cortex noise texture was scored at 2.85 ± 0.36 and 2.84 ± 0.37 on 100 kVp scan compared to 2.86 ± 0.35 and 2.79 ± 0.41 on 120 kVp scan (Fig. 3C). Psoas muscle noise texture was scored at 2.84 ± 0.37 and 2.91 ± 0.29 on 100 kVp scan compared to 2.85 ± 0.36 and 2.91 ± 0.29 on 120 kVp scan (Fig.
3D). Only hepatic noise texture was significantly (p = 0.0001) dif- ferent between the two groups. Other noise texture of pancreas, renal cortex, and psoas muscle were insignificant (p > 0.05) be- tween the 100 kVp and 120 kVp scans.
The mean and standard deviation of artifact was scored at 2.91 ± 0.29 and 2.87 ± 0.34 on 100 kVp scan by two readers. It Fig. 2. Quantitative analysis of image noise (mean ± SD). Image noise in
the 100 kVp group (10.6 ± 3.8) was higher (p < 0.0001) that that (7.2 ± 1.5) in the 120 kVp group.
SD = standard deviation 30
25
20
15
10
5
0
Image noise
120 kVp group 100 kVp group
Table 2. Quantitative Analysis of Image Quality of Abdominal Solid Organs
120 kVp Group 100 kVp Group p-Value
CT number (mean ± SD)
Liver 114.1 ± 20.3 126.9 ± 21.6 < 0.001
Pancreas 97.6 ± 21.9 107.7 ± 19.9 < 0.001
Renal cortex 174.9 ± 27.2 204.8 ± 33.3 < 0.001
Aorta 160.3 ± 28.3 189.9 ± 31.5 < 0.001
Portal vein 163.2 ± 29.9 201.1 ± 37.5 < 0.001
Psoas muscle 58.8 ± 5.8 65.1 ± 9.5 < 0.001
SNR (mean ± SD)
Liver 16.7 ± 5.4 13.6 ± 5.7 0.0001
Pancreas 14.3 ± 5.4 11.7 ± 5.3 0.0007
Renal cortex 25.5 ± 8.2 22.2 ± 9.5 0.0085
Aorta 23.6 ± 9.7 20.6 ± 9.0 0.0230
Portal vein 23.9 ± 8.4 21.9 ± 9.9 0.1155
Psoas muscle 8.5 ± 2.1 7.0 ± 2.8 < 0.001
CNR (mean ± SD)
Liver 8.1 ± 3.8 6.7 ± 3.7 0.0055
Pancreas 5.8 ± 4.0 4.7 ± 3.5 0.0476
Renal cortex 17.0 ± 6.6 15.2 ± 7.5 0.0731
Aorta 15.1 ± 8.1 13.6 ± 7.0 0.1716
Portal vein 15.4 ± 6.8 14.9 ± 8.0 0.6328
p-value is obtained from an independent sample t-test.
CNR = contrast-to-noise ratio, SD = standard deviation, SNR = signal-to-noise ratio
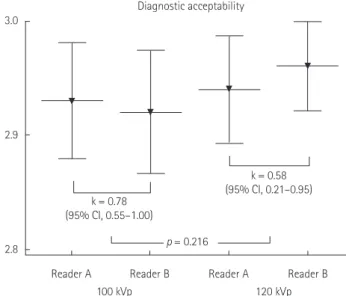
was scored at 2.96 ± 0.20 and 2.97 ± 0.17 by the two readers on 120 kVp scan (Fig. 4). The mean and standard deviation of di- agnostic acceptability was rated at 2.93 ± 0.26 and 2.92 ± 0.27 on 100 kVp scan by the two readers compared to 2.94 ± 0.24 and 2.96 ± 0.20 on 120 kVp scan (Fig. 5). The readers had full confidence in 92.5% of the 100 kVp scans and 95% of the 120 kVp scans. There was no significant (p > 0.05) difference in arti- fact or diagnostic acceptability of both scan protocols according to each reader. Representative case of qualitative analysis is shown in Fig. 6.
DISCUSSION
Automated tube voltage selection and current modulation is an automated attenuation-based, kilovoltage selection software algorithm that simultaneously optimizes the tube potential and tube current selection for each patient. This calculation is based on the patient’s attenuation profile measured from CT topo- gram and the diagnostic task to be performed so that desired image quality and low radiation dose can be achieved. Tube voltage settings include 80, 100, 120, and 140 kVp. Tube voltage
Fig. 3. Qualitative analysis of noise texture (mean ± SD).
A. Hepatic noise texture is significantly (p = 0.0001) different between the two groups.
B-D. Mean noise texture of pancreas, renal cortex, and psoas muscle is more than 2.8. There is no significant (p > 0.05) difference between the groups.
CI = confidence interval, SD = standard deviation, k =interrater agreement 3.0
2.9
2.8
2.7
2.6
2.5
2.4
Reader A 100 kVp
Liver noise texture p = 0.0001 k = 0.74
(95% CI, 0.58–0.89)
k = 0.85 (95% CI, 0.72–0.98)
120 kVp Reader A
Reader B Reader B
A
3.0
2.9
2.8
2.7
2.6
2.5
Reader A 100 kVp
Kidney noise texture p = 0.2667
k = 0.67
(95% CI, 0.45–0.86) k = 0.62
(95% CI, 0.42–0.82)
120 kVp Reader A
Reader B Reader B
C
3.0
2.9
2.8
2.7
2.6
2.5
Reader A 100 kVp
Pancreas noise texture p = 0.4382
k = 0.90 (95% CI, 0.79–1.0)
k = 0.68 (95% CI, 0.46–0.90)
120 kVp Reader A
Reader B Reader B
B
3.0
2.9
2.8
2.7
2.6
2.5
Reader A 100 kVp
Psoas muscle noise texture
p = 0.492 k = 0.76
(95% CI, 0.62–0.96)
k = 0.82 (95% CI, 0.75–0.95)
120 kVp Reader A
Reader B Reader B
D
matches CNR, a parameter for image quality optimization, at each tube voltage relative to that of a user-defined image quality reference (9).
With this advanced technique, a clear trend towards the use of lower tube voltage CT scans for the brain, heart, chest, and body has been observed in recent years (11-14). In accordance with reduced streaming radiation dose, a low tube voltage of 100 kVp is routinely selected for abdominal CT application of recent state-of-the-art multidetector row CT scanners (10, 18, 22, 23).
The primary objective of this study was to assess the image qual- ity of portal phase abdominal CT of abdominal organs by low- ering tube voltage from 120 kVp to 100 kVp.
Our results indicated that the 100 kVp abdominal CT protocol significantly reduced radiation dose compared to the 120 kVp standard protocol. In this study, the mean CTDIvol at 100 kVp was 8.2 mGy and the mean CTDIvol at 120 kVp was 9.4 mGy. A radiation dose reduction of 13.3% was found with the 100 kVp abdominal CT protocol. This finding was similar to the results of previous reports (16, 18, 19, 24). However, the radiation dose used in this study was the lowest among recently published articles.
The mean CT number of each organ and background image noise were higher at 100 kVp, in agreement with reports of oth- er studies (10, 11, 19). According to the SNR equation, SNR is inversely related to background noise. Thus, low SNR of each
organ in the 100 kVp group compared to the 120 kVp group was due to increase in background noise. As the CT number of the psoas muscle became higher with the 100 kVp protocol, it might have caused low CNR of the liver with the 100 kVp pro- tocol than that of the 120 kVp protocol. Even though SNR and CNR between both scan protocols showed significant differ- ences in quantitative analysis, the difference value was equal or less than 4. Such minimal differences are probably not discern- ible by visual inspection. Therefore, it is difficult to know wheth- er CNR and SNR obtained with the 100 kVp protocol have great effect on diagnosis.
Low tube voltage CT not only can increase image contrast because low-energy X-rays are more strongly attenuated by io- dine than by surrounding tissues, but also can increase image noise because low-energy X-rays are captured or absorbed more in the soft tissue, thus decreasing photons that reach the detectors. Greater image noise in low tube voltage CT angiog- raphy does not necessarily result in diminished subjective im- age quality as shown in various clinical investigations because improved iodinated contrast enhancement at lower kilovoltage enable a higher noise to be tolerated while achieving a great ra- diation dose reduction (12, 14, 25-27). However, in portal phase abdominal CT, iodine concentration is lower than that in CT angiography. Because detection and characterization of paren-
3.1
3.0
2.9
2.8
2.7
Reader A 100 kVp
Artifact p = 0.192
k = 0.49 (95% CI, 0.22–0.76)
k = 0.56 (95% CI, 0.11–1.00)
120 kVp Reader A
Reader B Reader B
Fig. 4. Qualitative analysis of the artifact (mean ± SD). There is no sig- nificant (p = 0.192) difference in artifact rated by two readers between 120 kVp and 100 kVp groups.
CI = confidence interval, SD = standard deviation, k = interrater agree- ment
3.0
2.9
2.8
Reader A 100 kVp
Diagnostic acceptability
p = 0.216 k = 0.78
(95% CI, 0.55–1.00)
k = 0.58 (95% CI, 0.21–0.95)
120 kVp Reader A
Reader B Reader B
Fig. 5. Qualitative analysis of diagnostic acceptability (mean ± SD).
There is no significant (p = 0.216) difference in diagnostic acceptability scored by two readers between 120 kVp and 100 kVp groups.
CI = confidence interval, SD = standard deviation, k = interrater agree- ment
chymal lesions require lower noise levels, this necessitates the use of higher tube voltage and radiation dose (8). The disadvan- tage of lower tube voltage can be compensated by using con- current high-output tube current (28, 29). In our study, al- though the tube current was concurrently increased from 210 mAs to 289 mAs by using the ATCM technique, it was subopti- mal to nullify image noise, resulting in an increase in image noise of up to 47% compared to that in other stuides. On quali- tative image quality analysis, diagnostic acceptability showed no statistically significant difference between the two groups.
However, noise texture of the liver was frequently scored 2 points
more by both readers. To reduce image noise, IR could be a ten- able option. IR is not applied during abdominal CT application in daily clinical practice at our institution because of concerns of its graphic and pixelated effects. Husarik et al. (16) have demon- strated an approximately 35% of image noise reduction with the 100 kVp protocol in a phantom study using IR compared to the 120 kVp protocol. In addition, Kalra et al. (30) have demonstrat- ed that attenuation by various tissues is not changed when us- ing IR. However, Baker et al. (31) reported that lower dose acqui- sitions with any reconstructed algorithm had limitation in eva- luating the conspicuity of lesions depending on radiation dose
A
B 120 kVp
120 kVp
100 kVp
100 kVp
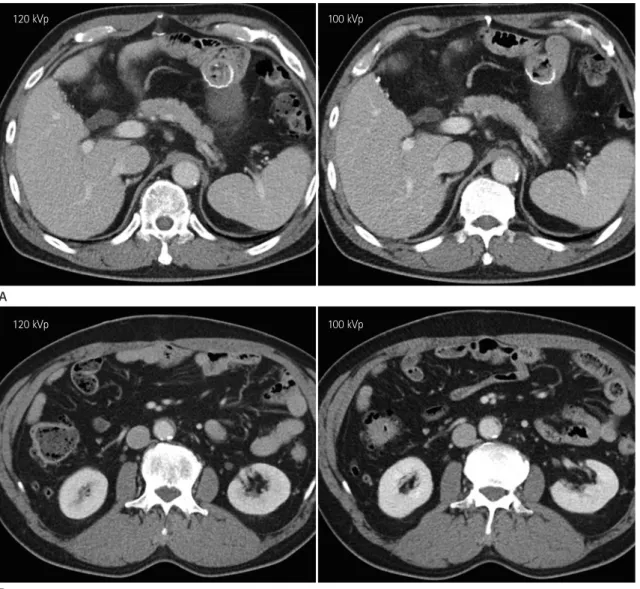
Fig. 6. A 59-year-old male patient underwent gastrectomy of the gastric cancer with post-operative follow-up CT scans using 120 kVp (DLP, 631 mGy·cm) and 100 kVp (DLP, 567 mGy·cm) (window width/level, 45/400) tube voltage at 6-month intervals.
A. Hepatic and pancreatic noise texture is rated at 3 points by both readers. SNR and CNR of liver are 19.9 and 8.6 on 120 kVp, respectively, ver- sus 14.5 and 6.8 on 100 kVp. SNR and CNR of pancreas are 17.4 and 6.9 on 120 kVp, respectively, versus 13.2 and 6.0 on 100 kVp.
B. SNR and CNR of renal cortex are 30.1 and 19.8 on 120 kVp, respectively, versus 25.9 and 17.8 on 100 kVp.
CNR = contrast-to-noise ratio, DLP = dose length product, SNR = signal-to-noise ratio
similar values using both protocols. Therefore, detection of hy- pervascular lesions should not be an issue. However, as men- tioned above, detection of low-contrast lesions may be affected using the 100 kVp scan protocol.
In conclusion, abdominal CT with a low tube voltage of 100 kVp reduced radiation dose by 13.3% without significantly sac- rificing image quality. However, low-contrast hepatic lesions such as small cysts or hypovascular metastases should be evaluated more carefully because of the inherent limitations of low tube voltage CT.
REFERENCES
1. Amis ES Jr, Butler PF, Applegate KE, Birnbaum SB, Brate- man LF, Hevezi JM, et al. American College of Radiology white paper on radiation dose in medicine. J Am Coll Ra- diol 2007;4:272-284
2. Huda W, Scalzetti EM, Levin G. Technique factors and im- age quality as functions of patient weight at abdominal CT.
Radiology 2000;217:430-435
3. McCollough CH, Primak AN, Braun N, Kofler J, Yu L, Christ- level that low-contrast lesions could not be detected with ade-
quate accuracy. SNR and CNR of abdominal organs were simi- lar between both scan protocols because the difference of SNR and CNR was very small (equal or less than 4). In addition, there was no significant difference in diagnostic acceptability.
However, these results do not guarantee similar accuracy in de- tecting low-contrast lesions such as small hepatic cysts or metas- tasis. Therefore, further investigation is needed to determine whether low tube voltage abdominal CT with or without IR will accurately detect these low-contrast lesions in abdominal or- gans.
Our study has some inherent limitations. First, the patient population was heterogeneous with various patient sizes. Radi- ation dose closely depends on patient size (15, 32). We excluded obese patients with BMI equal or more than 30 kg/m2. The two protocol groups showed no difference in BMI distribution. How- ever, some minor factors such as uneven distribution of high and low BMI patients or difference in patient’s anteroposterior and transverse diameters were not evaluated. Second, we did not evaluate the accuracy of the 100 kVp scan protocol in detecting focal lesions. The SNR and CNR of each target organ showed
C
120 kVp 100 kVp
Fig. 6. A 59-year-old male patient underwent gastrectomy of the gastric cancer with post-operative follow-up CT scans using 120 kVp (DLP, 631 mGy·cm) and 100 kVp (DLP, 567 mGy·cm) (window width/level, 45/400) tube voltage at 6-month intervals.
C. On magnification images, hepatic noise texture on 100 kVp shows more pixelated texture (dot-line circle) compared to that of 120 kVp. How- ever, this difference can be hardly detected on normal scale image. The diagnostic acceptability is scored at 3 points by both readers. Estimated DLP reduction is 10.2%.
DLP = dose length product
ner J. Strategies for reducing radiation dose in CT. Radiol Clin North Am 2009;47:27-40
4. Costello JE, Cecava ND, Tucker JE, Bau JL. CT radiation dose: current controversies and dose reduction strategies.
AJR Am J Roentgenol 2013;201:1283-1290
5. Lee CH, Goo JM, Ye HJ, Ye SJ, Park CM, Chun EJ, et al. Ra- diation dose modulation techniques in the multidetector CT era: from basics to practice. Radiographics 2008;28:
1451-1459
6. Schindera ST, Graca P, Patak MA, Abderhalden S, von All- men G, Vock P, et al. Thoracoabdominal-aortoiliac multi- detector-row CT angiography at 80 and 100 kVp: assess- ment of image quality and radiation dose. Invest Radiol 2009;44:650-655
7. Marin D, Nelson RC, Schindera ST, Richard S, Youngblood RS, Yoshizumi TT, et al. Low-tube-voltage, high-tube-cur- rent multidetector abdominal CT: improved image quality and decreased radiation dose with adaptive statistical it- erative reconstruction algorithm--initial clinical experi- ence. Radiology 2010;254:145-153
8. Nakayama Y, Awai K, Funama Y, Hatemura M, Imuta M, Nakaura T, et al. Abdominal CT with low tube voltage: pre- liminary observations about radiation dose, contrast en- hancement, image quality, and noise. Radiology 2005;237:
945-951
9. Yu L, Li H, Fletcher JG, McCollough CH. Automatic selec- tion of tube potential for radiation dose reduction in CT: a general strategy. Med Phys 2010;37:234-243
10. Yu L, Fletcher JG, Grant KL, Carter RE, Hough DM, Barlow JM, et al. Automatic selection of tube potential for radia- tion dose reduction in vascular and contrast-enhanced ab- dominopelvic CT. AJR Am J Roentgenol 2013;201:W297- W306
11. Eller A, Wuest W, Scharf M, Brand M, Achenbach S, Uder M, et al. Attenuation-based automatic kilovolt (kV)-selec- tion in computed tomography of the chest: effects on ra- diation exposure and image quality. Eur J Radiol 2013;
82:2386-2391
12. Heyer CM, Mohr PS, Lemburg SP, Peters SA, Nicolas V. Im- age quality and radiation exposure at pulmonary CT angi- ography with 100- or 120-kVp protocol: prospective ran- domized study. Radiology 2007;245:577-583
13. Leschka S, Stolzmann P, Schmid FT, Scheffel H, Stinn B, Marincek B, et al. Low kilovoltage cardiac dual-source CT:
attenuation, noise, and radiation dose. Eur Radiol 2008;18:
1809-1817
14. Waaijer A, Prokop M, Velthuis BK, Bakker CJ, de Kort GA, van Leeuwen MS. Circle of willis at CT angiography: dose reduction and image quality--reducing tube voltage and increasing tube current settings. Radiology 2007;242:832- 839
15. Siegel MJ, Ramirez-Giraldo JC, Hildebolt C, Bradley D, Schmidt B. Automated low-kilovoltage selection in pedi- atric computed tomography angiography: phantom study evaluating effects on radiation dose and image quality.
Invest Radiol 2013;48:584-589
16. Husarik DB, Schindera ST, Morsbach F, Chuck N, Seifert B, Szucs-Farkas Z, et al. Combining automated attenuation- based tube voltage selection and iterative reconstruction:
a liver phantom study. Eur Radiol 2014;24:657-667 17. Nakaura T, Kidoh M, Nakamura S, Doi Y, Shiraishi S, Awai K,
et al. Low-dose abdominal CT protocols with a tube volt- age setting of 100 kVp or 80 kVp: performance of radia- tion dose reduction and influence on visual contrast. Clin Radiol 2014;69:804-811
18. Hough DM, Fletcher JG, Grant KL, Fidler JL, Yu L, Geske JR, et al. Lowering kilovoltage to reduce radiation dose in contrast-enhanced abdominal CT: initial assessment of a prototype automated kilovoltage selection tool. AJR Am J Roentgenol 2012;199:1070-1077
19. Gnannt R, Winklehner A, Eberli D, Knuth A, Frauenfelder T, Alkadhi H. Automated tube potential selection for stan- dard chest and abdominal CT in follow-up patients with testicular cancer: comparison with fixed tube potential.
Eur Radiol 2012;22:1937-1945
20. American Association of Physicists in Medicine (AAPM).
The measurement, reporting, and management of radia- tion dose in CT. Report No. 96. College Park, MD: AAPM, 2008. Available at: http://www.aapm.org/pubs/reports/
rpt_96.pdf. Accessed July 31, 2014
21. EUR 16262. European Study Group Website. European guidelines on quality criteria for computed tomography.
Available at: http://www.drs.dk/guidelines/ct/quality/htm- lindex.htm. Accessed January 20, 2016
22. Mayer C, Meyer M, Fink C, Schmidt B, Sedlmair M, Schoenberg SO, et al. Potential for radiation dose savings in abdominal and chest CT using automatic tube voltage se- lection in combination with automatic tube current modu- lation. AJR Am J Roentgenol 2014;203:292-299
23. Laqmani A, Veldhoen S, Dulz S, Derlin T, Behzadi C, Schmidt-Holtz J, et al. Reduced-dose abdominopelvic CT using hybrid iterative reconstruction in suspected left-sid- ed colonic diverticulitis. Eur Radiol 2016;26:216-224 24. Eller A, May MS, Scharf M, Schmid A, Kuefner M, Uder M,
et al. Attenuation-based automatic kilovolt selection in abdominal computed tomography: effects on radiation ex- posure and image quality. Invest Radiol 2012;47:559-565 25. Schindera ST, Nelson RC, Yoshizumi T, Toncheva G, Nguyen
G, DeLong DM, et al. Effect of automatic tube current modulation on radiation dose and image quality for low tube voltage multidetector row CT angiography: phantom study. Acad Radiol 2009;16:997-1002
26. Wintersperger B, Jakobs T, Herzog P, Schaller S, Nikolaou K, Suess C, et al. Aorto-iliac multidetector-row CT angiogra- phy with low kV settings: improved vessel enhancement and simultaneous reduction of radiation dose. Eur Radiol 2005;15:334-341
27. Schueller-Weidekamm C, Schaefer-Prokop CM, Weber M,
Herold CJ, Prokop M. CT angiography of pulmonary arter- ies to detect pulmonary embolism: improvement of vas- cular enhancement with low kilovoltage settings. Radiol- ogy 2006;241:899-907
28. Li X, Yu Y, Liu B, Qian Y, Zhao R. Radiation dose reduction at multidetector CT. Radiology 2013;268:925-926
29. Raman SP, Johnson PT, Deshmukh S, Mahesh M, Grant KL, Fishman EK. CT dose reduction applications: available tools on the latest generation of CT scanners. J Am Coll Radiol 2013;10:37-41
30. Kalra MK, Woisetschläger M, Dahlström N, Singh S, Lindb- lom M, Choy G, et al. Radiation dose reduction with sino- gram affirmed iterative reconstruction technique for ab- dominal computed tomography. J Comput Assist Tomogr 2012;36:339-346
31. Baker ME, Dong F, Primak A, Obuchowski NA, Einstein D, Gandhi N, et al. Contrast-to-noise ratio and low-contrast object resolution on full- and low-dose MDCT: SAFIRE ver- sus filtered back projection in a low-contrast object phan- tom and in the liver. AJR Am J Roentgenol 2012;199:8-18 32. Ginsburg M, Obara P, Wise L, Wroblewski K, Vannier MW,
Dachman AH. BMI-based radiation dose reduction in CT colonography. Acad Radiol 2013;20:486-492
성인에서 100 kVp와 120 kVp 관접압을 이용한 복부 전산화단층촬영의 방사선량 감소와 영상의 질 비교
하홍일
1· 홍성숙
2* · 김민정
1· 이관섭
1목적: 성인에서 100 kVp와 120 kVp 관전압을 이용한 복부 전산화단층촬영의 방사선량 감소와 영상의 화질을 비교 평가 하고자 하였다.
대상과 방법: 120 kVp와 100 kVp 관전압을 이용하여 복부 전산화단층촬영을 시행받은 각각 100명의 환자를 대상으로 하였다. 자동관전류변동제어를 적용하였고, 그 외 다른 복부 전산화단층촬영 검사 조건은 모두 동일하였다. 방사선 피폭 량은 전산화단층촬영 장치의 선량 측정지표를 이용하여 분석하였으며, 복부 장기들의 영상의 화질과 영상 잡음을 객관적, 주관적 방법으로 분석하였다.
결과: 100 kVp 검사군의 평균 방사선 피폭량은 120 kVp 검사군의 평균 방사선 피폭량과 비교하여 13.3%만큼의 유의한 감소를 보였다. 간, 췌장, 신장 피질, 대동맥, 간문맥, 대요근의 Hounsfield unit 값은 100 kVp 검사군에서 유의하게 높았 다. 각 장기의 신호대잡음비는 120 kVp 검사군에서 유의하게 높았다. 간의 대조도대잡음비만이 120 kVp 검사군에서 약 간 높았고 다른 장기의 대조도대잡음비는 두 검사군에서 차이가 없었다. 주관적 분석에서 간을 제외한 복부 장기의 영상 잡음질감, 인공물, 진단적 용인성은 두 검사군에서 유의한 차이가 없었다.
결론: 100 kVp 관전압을 이용한 복부 전산화단층촬영은 영상의 질적 훼손 없이 120 kVp 관전압을 이용한 복부 전산화단 층촬영과 비교하여 13.3%의 방사선 피폭량 감소를 기대할 수 있다.
1한림대학교 의료원, 한림대학교 성심병원 영상의학과, 2순천향대학교 의과대학 순천향대학교 서울병원 영상의학과