ISSN 2234-3806 • eISSN 2234-3814
http://dx.doi.org/10.3343/alm.2014.34.2.104
Assessment of the Trueness and Inter-Laboratory
Precision of Routine Uric Acid Assays Using 4 Frozen Pooled Serum Samples Measured by the Japan Society of Clinical Chemistry’s HPLC Method
Yaping Jiang, Ph.D.1, Ou Liu, M.S.2, and Guobing Xu, M.S.1
Department of Clinical Laboratory1, Peking University First Hospital; Department of Clinical Laboratory2, Tsinghua University First Hospital, Beijng, China
Background: Reference procedures are required for evaluating the accuracy of routine analytical systems for uric acid (UA). External quality assessment (EQA) for UA has only been conducted with quality controls in China, and the results have not been published.
This study was designed to investigate both the trueness and inter-laboratory precision of UA measurements among routine analytical systems using a candidate reference method.
Methods: We performed the HPLC method recommended by the Japan Society of Clinical Chemistry (JSCC). Next, we evaluated its analytical performance and validated its true- ness. The performance of 4 routine analytical systems (5 instruments per system, n=20) for UA was assessed by using 4 frozen pooled serum samples measured by the HPLC method according to biologically relevant quality goals.
Results: Within-run, between-run, inter-day, and total CV of the method were less than 0.3%, 0.4%, 1.8%, and 2.6%, respectively. The UA measurements were consistent with the target values of standard reference material (SRM) 909b, the sixth ring trial for Refer- ence Laboratories (RELA-2008) specimen, and national primary reference materials. The 4 frozen pooled serum samples were homogeneous, stable, and commutable. All routine systems achieved the desirable performance goal (total error <11.9%).
Conclusions: We successfully reproduced the JSCC’s HPLC method, which was simple, specific, precise, and accurate. We recommend this method as a reference method for UA measurement in human serum. Four routine analytical systems for UA measurement had acceptable traceability, and their UA results showed good concordance.
Key Words: Uric acid, HPLC, Standardization
Received: July 29, 2013
Revision received: December 19, 2013 Accepted: January 22, 2014
Corresponding author: Guobing Xu Department of Clinical Laboratory, Peking University First Hospital, No.8 Xishiku Street, Xicheng District, Beijing 100034, China
Tel: +86-10-88196859 Fax: +86-10-66551785 E-mail:[email protected]
© The Korean Society for Laboratory Medicine This is an Open Access article distributed under the terms of the Creative Commons Attribution Non-Commercial License (http://creativecom- mons.org/licenses/by-nc/3.0) which permits unrestricted non-commercial use, distribution, and reproduction in any medium, provided the original work is properly cited.
INTRODUCTION
Uric acid (UA) is the major end product of purine metabolism.
Serum levels of UA are elevated in gout, lead poisoning [1], Down syndrome [2], and hypothyroidism [3]. Moreover, many epidemiological studies have suggested that hyperuricemia, which may be an independent risk factor for metabolic syn- drome [4], is associated with kidney disease, cardiovascular dis-
ease [5], cerebrovascular disease [6], obesity, diabetes, hyper- triglyceridemia, and hypertension. On the other hand, hypouri- cemia can be seen in Wilson’s disease [7], xanthinuria, and the syndrome of inappropriate antidiuretic hormone secretion (SI- ADH) [8]. Therefore, the accurate measurement of UA in hu- man serum plays an important role in the diagnosis, treatment, and prognosis of diseases associated with disorders of purine metabolism.
Numerous methods have been reported for the measurement of UA in human serum. The uricase method is widely used in auto- analyzers; the direct method quantifies the decrease in ultraviolet (UV) absorbance at 293 nm (the absorbance maximum of UA), and the indirect method quantifies hydrogen peroxide formed by uricase activity. However, enzymatic methods can be affected by the presence of interfering compounds, and many clinical labo- ratories use calibrators that are not matched with appropriate re- agents and analyzers. Therefore, reference procedures are nec- essary in order to evaluate the accuracy of routine analytical sys- tems for UA. External quality assessment (EQA) for UA has only been conducted by the use of quality controls in China, and the EQA results have not been published so far. Therefore, this study was designed to investigate both the trueness and inter-labora- tory precision of UA results among routine analytical systems through a candidate reference method.
Different reference methods have been established in order to provide a reliable standard and to improve the accuracy of UA measurement in serum (Table 1) [9-15]. In the present work, we searched for a simple, rapid, and economical reference method that also had good analytical performance. Duncan et al. [9] opti- mized and evaluated a manual UV uricase method for measuring UA. This method exhibited satisfactory analytical recoveries (98- 105%) and precision (day-to-day precision, 1.5% [590 μmol/L]
to 2.7% [180 μmol/L]) and was resistant to endogenous interfer- ence, including ascorbate and glutathione levels. As such, this method was once recommended as a reference method for UA.
However, the disadvantages of this manual ultraviolet uricase method were the interference from xanthine and poor precision at low UA concentrations [16]. All isotope dilution mass spec- trometry (ID-MS) methods for measuring UA in serum have very high accuracy and precision. Nevertheless, HPLC methods are superior to ID-MS methods with regard to their speed, simplicity,
economy, and compact size. These features are particularly im- portant in developing countries and regions where ID-MS meth- ods are difficult to perform.
Several HPLC methods for measuring UA have been estab- lished as candidate reference methods; however, most employed complex operational procedures [17]. In 1993, the Japan Soci- ety of Clinical Chemistry (JSCC) recommended a reversed-phase HPLC with UV detection as a national standard for UA detection [13]. Although this method is not on the Joint Committee for Traceability in Laboratory Medicine’s (JCTLM) list, the HPLC as- say is simple, rapid, economical, and precise. To date, the ana- lytical performance and trueness of the JSCC’s HPLC method have not been evaluated (Table 1). Thus, we performed the JSCC’s HPLC method using the same or similar chemicals and apparatus in China to observe whether it is reproducible and re- valuated its analytical performance and trueness using several approaches. Next, we applied this HPLC method to investigate the both trueness and inter-laboratory precision of UA results among 4 routine analytical systems with 4 frozen pooled serum that were standardized by this method.
METHODS
1. Chemical and apparatus preparation
The HPLC apparatus (Shimadzu Co. Ltd., Tokyo, Japan) con- sisted of a model LC-20AT pump, an SIL-20A autosampler, a CTO-10AS column oven, and a model SPD-20A spectropho- tometer with a UV variable wavelength detector connected to a model LC-solution chromatoprocessor. Glass autosampler vials (1.5-mL capacity) were purchased from Agilent (Agilent Tech- nologies Inc., Santa Clara, CA, USA). Samples were centrifuged in a Beckman coulter Allegra X-22 refrigerated benchtop centri- fuge (Beckman Coulter Inc., Brea, CA, USA). Solutions were Table 1. Reference methods established by different laboratories for uric acid
Organization or author Reference method Reference material(s) for calibration Reference material(s) for trueness
Duncan et al. [9] (1982) Spectrophotometry NIST SRM 913a None*
DGKC [10] (1985) ID-GC/MS NIST SRM 913a NIST SRM 909b, DGKC-reference sera
NIST [11] (1990) ID-GC/MS NIST SRM 913a NIST SRM 909b
Ghent university [12] (1993) ID-GC/MS NIST SRM 913a NIST SRM 909b, DGKC-reference sera
JSCC [13] (1993) HPLC-UV NIST SRM 913a None*
National Institute of Metrology, China [14] (2007) ID-LC/MS GBW09202 NIST SRM 909b
National Center for Clinical Laboratories, China [15] (2009) ID-LC/MS/MS NIST SRM 913a NIST SRM 909b
*None means that the trueness of the methods had not been evaluated.
Abbreviations: DGKC, German Cognitive linguistics Association; NIST, National Institute of Standards and Technology; JSCC, Japan Society of Clinical Chem- istry; ID-GC/MS, isotope dilution gas chromatography-mass spectrometry; ID-LC/MS, isotope dilution liquid chromatography-mass spectrometry; ID-LC/MS/
MS, isotope dilution liquid chromatography-tandem mass spectrometry; SRM, standard reference material.
prepared with Milli-Q (18.2 MΩ cm) water and filtered through 0.2-μm filters from Sartorius AG (Goettingen, Germany).
Standard reference material (SRM) 913a (certified chemical purity ±uncertainty, 99.6% ±0.1%) and SRM 909b were ob- tained from National Institute of Standards and Technology (NIST). National primary reference materials (GBW09174, GBW09175, and GBW09176) were donated by the National Center for Clinical Laboratories (NCCL) (Beijing, China). Perchlo- ric acid (purity 70%), methanol (purity >99.9%), phosphoric acid (purity >85%), and lithium carbonate (purity >99%) were provided by Sigma (St. Louis, MO, USA). Sodium phosphate di- basic dodecahydrate (Na2HPO4 ∙ 12H2O) (purity >99%) was purchased from Sinopharm Chemical Reagent Company (Beijing, China). Uricase (50 U/mg) was supplied by Roche (Mannheim, Germany).
2. Calibrator preparation for the HPLC method
SRM 913a used for HPLC calibration was dissolved in 0.01 mol/L lithium carbonate so that the concentration of UA in the stock solution was approximately 1 g/L (5,950 μmol/L). Five standard solutions were prepared from the stock solution by dilution with Milli-Q water and were used to construct a calibration curve us- ing their peak areas.
3. Sample treatment
Each serum sample or standard solution (0.2 mL of each) was mixed with 2 mL of 0.3 mol/L perchloric acid [18]. The mixed solutions were cooled in an ice-bath for 30 min, and then vor- tex-mixed for 10 sec and centrifuged at approximately 4,270 g at 4°C for 10 min. The supernatants were collected and centri- fuged for a second time. Then, 0.3 mL of the supernatants was diluted with an equal volume of 0.2 mol/L Na2HPO4 ∙ 12H2O in glass vials. During the deproteinizing procedure, a precipitated product can be seen in the supernatant after the first centrifu- gation. Therefore, the JSCC method suggested two centrifuga- tion steps [13].
4. HPLC assay
The HPLC method was performed using a Shimadzu LC-20A series apparatus (Shimadzu Co. Ltd.). The spectrophotometer was set at 284 nm. All separations were performed at 20°C on a Shimadzu Inertsil ODS-SP column (150 mm×4.6 mm, particle diameter 5 μm). The mobile phase was 0.2 mL/L of methanol in 74 mmol/L of phosphate-buffered saline (pH 2.2, 25.0°C). The flow rate was 1.0 mL/min. The injection volume was 50 μL.
5. Method validation
For method validation, we assessed specificity, linearity, preci- sion, recovery, accuracy, and system suitability. The UA chro- matogram from human serum samples treated with uricase was observed to evaluate the specificity [19]. The linear range was evaluated by generating a standard curve based on the UA con- centrations of a series of standard solutions. The precision was investigated according to NCCLS EP5-A2 [20] by analyzing RANDOX quality controls (Randox Laboratories Ltd., Crumlin Co., Antrim, UK) at normal and pathological levels. Each level was run in duplicate with 2 runs per day for 20 days, and the interval between each successive run was at least 2 hr.
Serum pools were prepared by dividing a homogeneous pool of human serum into 5 portions. One was retained as a refer- ence pool. The other 4 serum pools were adjusted to the de- sired concentration with the SRM 913a aqueous standard solu- tion. Each of the 5 pools was analyzed 3 times, and the means of the UA results were calculated to assess the recovery.
The trueness of the HPLC method was controlled and vali- dated by analyzing SRM 909b, the RELA-2008 specimen, and national primary reference materials (GBW09174, GBW09175, and GBW09176). The values of national primary reference ma- terials were determined by isotope dilution liquid chromatogra- phy-tandem mass spectrometry (ID-LC/MS/MS), which was es- tablished by the NCCL of China.
System suitability tests were used to verify whether the sys- tem’s resolution and reproducibility were adequate. The param- eters used in this test were retention time, theoretical plate, ca- pacity factor, and tailing factor.
6. Preparation, biological characterization, and UA measurement of four frozen pooled serum samples
Four pooled human serum samples with different UA concentra- tions were prepared and assessed by the HPLC method in order to evaluate the various routine analytical systems. Four UA con- centrations in fresh fasting sera without hemolysis, lipemia, or choloplania were collected based on the suggested distribution of data for comparison of the methods recommended in NCCLS EP9-A2 [21]. All sera were negative for hepatitis B surface anti- gen (HBsAg), HIV, and hepatitis C virus (HCV). Four pooled hu- man serum were mixed and centrifuged. Then, the supernatants were filtered with 0.2-μm filters and divided into 300-μL aliquots per tube, which were sealed and stored at -70°C.The homogeneity and stability of the 4 frozen pooled serum samples were evaluated with a Beckman Coulter Synchron DXC800 homogeneous system (Beckman Coulter Inc.) accord-
ing to ISO Guide 35 [22]. Ten vials of each concentration of the 4 frozen pooled serum samples were analyzed 3 times to deter- mine their homogeneity. In order to assess the stability, randomly chosen samples were stored for different time periods at room temperature, 4°C, -20°C, and -70°C. The homogeneity and sta- bility of the 4 frozen pooled serum samples were analyzed using 1-way ANOVA and linear regression analysis. Then, between- bottle uncertainty (ubb) and long-term storage uncertainty (ults) were calculated. Commutability of the 4 frozen pooled serum samples was assessed according to CLSI EP14-A2 [23]. Thirty- nine single donor samples spanning the relevant UA concentra- tion range (85-856 μmol/L) were selected. The 4 pooled samples and the 39 donor samples were analyzed by pairs of methods (HPLC and 5 routine analytical systems: Roche Modular P800 (Roche Diagnostics GmbH, Branchburg, NJ, USA), Beckman DXC800 (Beckman Coulter Inc.), Vitros 250 (Ortho-Clinical Di- agnostics Inc., Rochester, NY, USA), Hitachi 7600/Wako (Kabu- shiki-gaisha Hitachi Seisakusho, Tokyo, Japan), and Dade RXL- MAX (Dade Behring Inc., Newark, DE, USA). Each routine ana- lytical system was performed with only one instrument. We used regression analysis to determine whether the 4 prepared frozen pooled serum samples fell within the 95% predicted interval de- fined by the 39 donor samples.
The 4 frozen pooled sera were measured by the HPLC me- thod. Each pool was tested twice daily for 5 successive days, and target values of the 4 frozen pooled sera are reported as mean±expanded uncertainty (U). According to ISO Guide 35, the combined uncertainty (uc) of the 4 frozen pooled serum samples consisted of the uncertainty in the certified value of SRM 913a (ucal), the uncertainty due to characterization (uchar), ubb, ults, and bias compared with the national primary reference materials of the HPLC. The uchar is mainly derived from SD of the measured values. The coverage factor (k)=2. Therefore, U=k×
uc=2×[ucal2+SD2+ubb2+ults2+bias2]1/2.
7. Performance assessment of 4 routine analytical systems
The precision, bias, and total error (TE) of 4 routine analytical systems, including Roche (instruments: Modular P800=4, co- bas 8000=1), Beckman (instruments: DXC800=5), Vitros (in-struments: 5.1 FS =2, Vitros 5600 =1, Vitros 350 =1, Vitros 950=1), and Hitachi/Wako (instruments: Hitachi 7600=4, Hit- achi 7180=1) homogeneous systems, were investigated using the 4 frozen pooled serum samples. Each routine analytical sys- tem consisted of 5 instruments. Each machine was matched with its respective calibrators and reagents. The 4 frozen pooled serum samples were analyzed in duplicate after confirmation that each instrument was calibrated and quality-controlled. The means of the results (2 replicates×5 instruments=10 results) from each routine analytical system were used to calculate the precision and bias compared with the target values for the 4 routine analytical systems.
8. Statistical methods
All results were entered into SPSS 13.0 statistical software (SPSS Inc., Chicago, IL, USA). The performance of each routine ana- lytical system was assessed by quality goals based on biological variability suggested by Fraser [24]. The minimum, desirable, and optimum analytical goals for precision, bias, and TE for UA derived from biological variation data are shown in Table 2 [25].
RESULTS
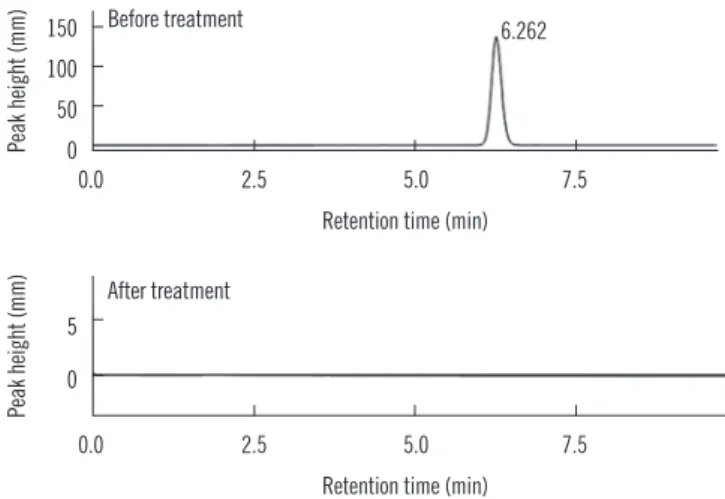
1. Specificity of the HPLC method
The UA chromatogram from the human serum sample disap- peared after treatment with uricase (Fig. 1).
2. Linearity of the HPLC method
The linearity of the HPLC method ranged from 2.08 μmol/L to 1,785 μmol/L with aqueous standard solutions (r2=0.999992).
Table 2. Analytical goals for uric acid measurement derived from data on biological variation
Quality level Imprecision (%) Bias (%) Total error (%)
Optimal 2.2 2.4 5.9
Desirable 4.3 4.8 11.9
Minimal 6.5 7.2 17.8
0.0 2.5 5.0 7.5 150
100 50 0
Retention time (min)
Before treatment 6.262
Peak height (mm)
0.0 2.5 5.0 7.5 5
0
Retention time (min) After treatment
Peak height (mm)
Fig. 1. Uric acid chromatograms of human serum samples before and after treatment with uricase.
3. Precision of the HPLC method
The within-run, between-run, inter-day, and total CV of the HPLC method were less than 0.3%, 0.4%, 1.8%, and 2.6%, re- spectively, both at normal and pathological levels when calcu- lated from the peak area (Table 3). The within-run precision in both previously reported JSCC methods [13] (0.7-0.9%) and the present HPLC method (0.1-0.22%) were less than 1% when evaluated by peak area. However, it was 1.5-1.7% in the previ- ous method and 1.25-1.27% in the present HPLC method when evaluated by peak height.
4. Recovery of the HPLC method
The 5 serum pools had approximate UA concentrations of 120 μmol/L, 246 μmol/L, 380 μmol/L, 466 μmol/L, and 547 μmol/L.
The average relative recovery rate was 99.6-100.6%. In the pre- viously reported JSCC method, the analytical recoveries were measured by adding [2-14C] UA to 10 mL of a serum pool and to a standard solution; the recoveries were 98.5% and 99.9%, respectively [13].
5. Trueness of the HPLC
The concentrations (mean±SD) of UA in SRM 909b were 270±
1.54 μmol/L (n=15) for level 1 and 716±3.36 μmol/L (n=15) for level 2. The results were within the concentration range cer- tified by NIST for UA in SRM 909b level 1 (277 ±12 μmol/L) and level 2 (733±23 μmol/L) [26]. The proportional biases of UA in RELA (2008) specimen level 1 and level 2 were 0.35%
and -0.69%, when compared with the mean results obtained from participating laboratories. The UA levels measured by the HPLC method had biases of 0.29%, -0.74%, and 0.06% re- spectively, compared with the target values of national primary reference materials (273.4 μmol/L, 335.7 μmol/L, and 494.9 μmol/L) [27].
6. System suitability test
The CV of system-suitability test parameters was satisfactory (Table 4).
7. Biological characteristics of the 4 frozen pooled serum samples
No stabilizing agent or preservative was added to the 4 frozen
pooled serum samples in this study, so the matrix effect was negligible. The four frozen pooled serum samples were homoge- neous (P >0.05) and stable for at least 115 days when stored at -20°C and 15 months when stored at -70°C (P >0.05 for both).
The 4 frozen pooled serum samples had good commutability between HPLC and 5 the routine analytical systems. Specifically, the UA results of the 4 frozen pooled serum samples all fell within the 95% predicted interval defined by the 39 donor sam- ples. The mean±U of the 4 frozen pooled serum samples of UA were 282 ±5 μmol/L, 383 ±7 μmol/L, 431 ±10 μmol/L, and 520±12 μmol/L.
8. Precision, bias, and TE of 4 routine analytical systems
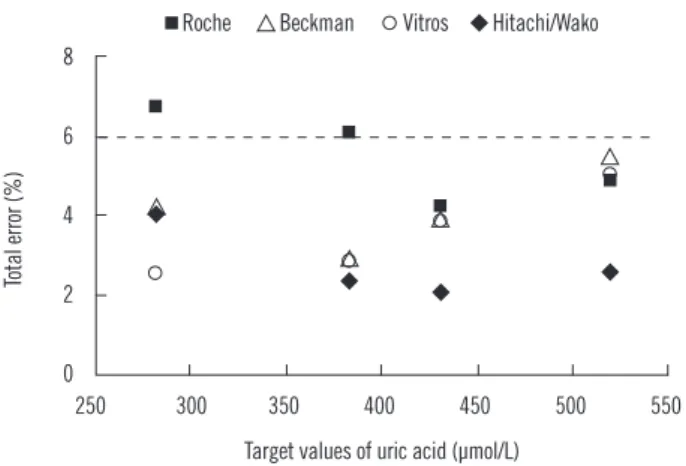
The 4 routine analytical systems (5 instruments per system, n=20) all achieved the desired performance goal with measure- ment of the 4 frozen pooled serum samples (CV <4.3%, bias
<4.8%, and TE <11.9%) (Table 5 and Fig. 2).
DISCUSSION
In this study, we successfully replicated the JSCC’s HPLC me- thod for UA measurement in human serum, evaluated its analyt- ical performance, and validated its trueness for the first time in China. Both the JSCC’s previously reported HPLC method and the present HPLC method had high levels of precision and re- covery. Although the accuracy of the JSCC’s HPLC method was only confirmed through evaluating the recovery, we verified its trueness by analysis of SRM 909b, the RELA (2008) specimen, and national primary reference materials. The CV calculated by the peak height was approximately 2 times higher than that cal- culated by the peak area. This could be because changes in pH, concentrations of the mobile phase and methanol, and retention Table 3. Precision of the HPLC method for uric acid measurement
RANDOX quality controls Mean concentration (μmol/L) Within-run CV (%) Between-run CV (%) Inter-day CV (%) Total CV (%)
Normal level 331 0.10 0.24 1.80 1.82
Pathological level 521 0.22 0.35 1.79 2.60
Table 4. System suitability test parameters
Parameters UA (150 μmol/L, n=5) UA (250 μmol/L, n=5) Mean±SD CV (%) Mean±SD CV (%) Retention time (min) 6.251±0.0013 0.021 6.253±0.0009 0.014 Theoretical plates 3,680.553±21.65 0.588 3,678.211±20.43 0.555 Capacity factor 3.392±0.009 0.265 4.015±0.010 0.249 Tailing factor 0.99±0.001 0.101 1.02±0.003 0.294 Abbreviation: UA, uric acid.
time affected the results calculated by peak height but not those calculated by peak area.
Initially, we tried to use the same sample treatment procedure and chromatographic conditions with the same (or similar) chemicals and apparatuses to assess the performance of the JSCC’s HPLC method. We determined that the method was sim- ple, rapid, and specific and had high recovery, precision, and accuracy, so we did not make any modifications. We identified the following differences between the previously reported HPLC method and that in the present study: 1) The HPLC apparatus was different. The previous study used a Toyosoda HPLC appa- ratus (Toyosoda Co. Ltd., Tokyo, Japan) and a Toyosoda ODS- 120A reversed-phase column (25 cm×4.6 mm, particle diame- ter 5 μm). Our study used a Shimadzu HPLC apparatus (Shi- madzu Co. Ltd.) and a Shimadzu Inertsil ODS-SP column (150 mm ×4.6 mm; particle diameter, 5 μm). 2) The purity of per- chloric acid was 60% in the previous study and 70% in the present study.
In addition, no peaks aside from the UA peak was observed in the standard (SRM913a) or serum samples, and no peak was observed in the blank samples (Milli-Q water and mobile phase). Thus, the matrix effects were negligible. On the basis of these findings, we concluded that the JSCC’s HPLC method is reproducible. Therefore, we recommend it as a candidate refer- ence method for UA measurement in human serum in develop- ing countries and poor regions.
We used this method to evaluate the analytical performance of 4 routine systems for UA measurement of 4 frozen pooled se- rum samples. Four routine analytical systems for UA measure- ment all achieved the desired performance goals (CV <4.3%, bias <4.8%, and TE <11.9%) [25]. The results were similar to those of an earlier study [28], where UA instruments displayed good performance; all participating laboratories met the mini- mum bias performance goal (bias <7.2%), and greater than 87.5% of the participating laboratories met the desired bias goal (bias <4.8%) based on biological variability versus a target value (UA 320 μmol/L) assigned by ID-MS and uricase methods. The routine analytical systems for UA measurement displayed good analytical performance and consistency, likely because nearly all of the instruments used the same enzymatic methodology. The lower threshold of the reference interval for UA was less than 282 μmol/L, and hypouricemia is a clinical concern. One limita- tion of this study was that frozen pooled sera with low UA con- centrations were not prepared, and the number of participating laboratories was small. Further investigation is needed to confirm our results.
In summary, this study was the first preliminary evaluation of routine analytical systems for UA measurement by the JSCC’s Table 5. Performance evaluation of 4 homogeneous routine analyti-
cal systems for uric acid measurement with 4 frozen pooled serum samples
Target value (μmol/L) Roche
(n=5) Beckman (n=5) Vitros
(n=5) Hitachi (n=5)
Mean 282 272.45 284.67 282.32 277.97
SD 5.68 5.51 4.05 4.54
CV (%) 2.09 1.94 1.43 1.63
Relative bias (%) -3.29 1.04 0.21 -1.33
TE (%) 6.74 4.24 2.57 4.02
Mean 383 375.14 381.87 379.87 377.95
SD 8.98 6.02 4.63 2.28
CV (%) 2.39 1.58 1.22 0.60
Relative bias (%) -2.10 -0.34 -0.86 -1.37
TE (%) 6.04 2.95 2.87 2.36
Mean 431 423.16 425.87 424.71 425.20
SD 6.32 7.09 6.42 2.07
CV (%) 1.49 1.66 1.51 0.49
Relative bias (%) -1.76 -1.13 -1.40 -1.28
TE (%) 4.22 3.87 3.89 2.09
Mean 520 513.03 507.00 510.78 512.66
SD 11.07 9.28 10.09 3.66
CV (%) 2.16 1.83 1.98 0.71
Relative bias (%) -1.34 -2.50 -1.77 -1.41
TE (%) 4.90 5.52 5.04 2.58
Desired performance goals (CV <4.3%, bias <4.8%, and TE <11.9%).
Abbreviation: TE, total error.
250 300 350 400 450 500 550 8
6
4
2
0
Total error (%)
Target values of uric acid (µmol/L) Roche Beckman Vitros Hitachi/Wako
Fig. 2. Total error of 4 routine analytical systems for uric acid versus target values of the 4 frozen pooled serum samples measured by the HPLC method. The dotted line represents the optimum (5.9%) performance goal based on biologic variability.
HPLC method in China.
Authors’ Disclosures of Potential Conflicts of Interest
No potential conflicts of interest relevant to this article were re- ported.
Acknowledgments
Our research was supported by the Capital Medical Develop- ment Fund Projects of China (No. 2009-1012). We appreciate the assistance of Beckman, Vitros, Roche, and Hitachi organi- zations.
REFERENCES
1. Alasia DD, Emem-Chioma PC, Wokoma FS. Association of lead expo- sure, serum uric acid and parameters of renal function in Nigerian lead- exposed workers. Int J Occup Environ Med 2010;1:182-90.
2. Pant SS, Moser HW, Krane SM. Hyperuricemia in Down’s syndrome. J Clin Endocrinol Metab 1968;28:472-8.
3. Giordano N, Santacroce C, Mattii G, Geraci S, Amendola A, Gennari C.
Hyperuricemia and gout in thyroid endocrine disorders. Clin Exp Rheu- matol 2001;19:661-5.
4. Miguel AL, Yuri YS, Ahsan Ejaz A, Magdalena M, MyPhuong L, Jacek M, et al. Uric acid and metabolic syndrome: what is the relationship? Curr Rheumatol Rev 2011;7:162-9.
5. Mankovsky B, Kurashvili R, Sadikot S. Is serum uric acid a risk factor for atherosclerotic cardiovascular disease? A review of the clinical evi- dence. Part 1. Diabetes Metab Syndr 2010;4:176-84.
6. Parvin S, Hoque MM, Sultana N, Chowdhury NS, Chowdhury SS, Akhter S, et al. Study of serum uric acid in cerebrovascular disease. J Dhaka Med Coll 2009;18:15-9.
7. Wilson DM and Goldstein NP. Renal urate excretion in patients with Wil- son’s disease. Kidney Int 1973;4:331-6.
8. Passeron A, Blanchard A, Capron L. Hypo-uricemia in the syndrome of inappropriate secretion of antidiuretic hormone: a prospective study.
Rev Med Interne 2010;31:665-9 (in French).
9. Duncan PH, Gochman N, Cooper T, Smith E, Bayse D. A candidate ref- erence method for uric acid in serum. I. Optimization and evaluation.
Clin Chem 1982;28:284-90.
10. Siekmann L. Determination of uric acid in human serum by isotope di- lution-mass spectrometry. Definitive methods in clinical chemistry, III. J Clin Chem Clin Biochem 1985;23:129-35.
11. Ellerbe P, Cohen A, Welch MJ, White E 5th. Determination of serum uric acid by isotope dilution mass spectrometry as a new candidate de- finitive method. Anal Chem 1990;62:2173-7.
12. Stöckl D and Reinauer H. Candidate reference methods for determining target values for cholesterol, creatinine, uric acid, and glucose in exter-
nal quality assessment and internal accuracy control. I. Method setup.
Clin Chem 1993;39:993-1000.
13. Japan Society of Clinical Chemistry. Recommended method for deter- mination of uric acid in serum by HPLC. Jpn J Clin Chem 1993;22:300- 07 (in Japanese).
14. Dai X, Fang X, Zhang CM, Xu R, Xu B. Determination of serum uric acid using high-performance liquid chromatography (HPLC)/isotope dilution mass spectrometry (ID-MS) as a candidate reference method. J Chro- matogr B Analyt Technol Biomed Life Sci 2007;857:287-95.
15. Zhang C, Zhang J, Zhang T, Zhou W, Chen W, Shen Z, et al. Determina- tion of serum uric acid by isotope dilution liquid chromatography tan- dem mass spectrometry. Lab Med 2009;24:878-82 (in Chinese). http://
www.shjyyx.com/EN/abstract/abstract1639.shtml.
16. Duncan P, Gochman N,Bayse D, Burnett R, Carey N, Carter R, et al. A candidate reference method for uric acid in serum. II. Interlaboratory testing. Clin Chem 1982;28:291-3.
17. Kock R, Delvoux B, Tillmanns U, Greiling H. A candidate reference method for the determination of uric acid in serum based on high per- formance liquid chromatography, compared with an isotope dilution- gas chromatography-mass spectrometer method. J Clin Chem Clin Bio- chem 1989;27:157-62.
18. Sakuma R, Nishina T, Kitamura M. Deproteinizing methods evaluated for determination of uric acid in serum by reversed-phase liquid chro- matography with ultraviolet detection. Clin Chem 1987;33:1427-30.
19. Yasushi C, Kazuko K, Naomi N. Comparative study on a high perfor- mance liquid chromatographic method and an enzymatic (uricase-UV) method for determination of serum uric acid. Bull Ginkyo Coll Med Sci 1993;17:21-8 (in Japanese). http://ci.nii.ac.jp/naid/110004299689.
20. Clinical and Laboratory Standards Institute. Evaluation of precision per- formance of quantitative measurement methods; approved guideline- second edition. EP5-A2. Wayne, PA: CLSI, 2004.
21. Clinical and Laboratory Standards Institute. Method comparison and bias estimation using patient samples; approved guideline-second edi- tion. EP9-A2. Wayne, PA: CLSI, 2002.
22. International Organization for Standardization. ISO Guide 35: Reference materials-General and statistical principles for certification, 3rd ed. ISO, Geneva, 2006.
23. Clinical and Laboratory Standards Institute. Evaluation of matrix effects;
approved guideline-second edition. EP14-A2. Wayne, PA: CLSI, 2005.
24. Fraser CG, Hyltoft Petersen P, Libeer JC, Ricos C. Proposals for setting generally applicable quality goals solely based on biology. Ann Clin Bio- chem 1997;34:8-12.
25. Ricós C, Alvarez V, Cava F, García-Lario JV, Hernández A, Jiménez CV, et al. Current databases on biological variation: pros, cons and prog- ress. Scand J Clin Lab Invest 1999;59:491-500.
26. National Institute of Standards and Technology. https://www-s.nist.gov/
srmors/view_cert.cfm?srm=909B (Updated on Aug 2011).
27. National information center for Certified Reference Materials. http://
www.gbw-china.com (updated on Jan 2012).
28. Miller WG, Myers GL, Ashwood ER, Killeen AA, Wang E, Ehlers GW, et al. State of the art in trueness and interlaboratory harmonization for 10 analytes in general clinical chemistry. Arch Pathol Lab Med 2008;132:
838-46.