IEG 환경지질연구정보센터
11
0
0
전체 글
(2) 328. Xiaolong Sun and Yaowei Liu. groundwater in the Tayuan Well. 2. CHARACTERISTICS OF THE TAYUAN WELL 2.1. Hydrogeological Conditions The Tayuan Well is located in Courtyard No. 34, Huayuan East Road, Haidian District, Beijing (116.4°E, 40°N). The height of the wellhead is 47 m. Geologically, the well is situated in a wedge-shaped body of rock between the Babaoshan Fault and the Huangzhuang–Gaoliying Fault. The ground surface around the well is covered by unconsolidated Quaternary sediment. The main aquifers in the well are: 1) porous aquifers of Quaternary grit or gravel, usually composed of 3–6 layers of gravel and sand with the top of the aquifer being located at a depth of less than 20 m; 2) the water-bearing Wali gravel aquifer, which consists of gray-white, dark gray, khaki, and mauve mixed gravels comprising clasts of dolomite and flint of the Jixian System, shallowly buried beneath Quaternary sediments at depths of 70–80 m; and 3) a fissured and porous waterbearing aquifer within Jurassic volcanic rock, characterized by poorly developed fissures and poor permeability (Yang et al., 2007). The aquifer of the Tayuan Well that was examined in the present study is a confined and fissured aquifer of Jurassic andesite tuff. Isotope analyses indicate that the water in the well is largely infiltration water from rainfall (Gu et al., 2003). The water in the aquifer layer is recharged by lateral flow from the mountains west of Beijing. The hydraulic gradient of the aquifer is small (0.5‰) and the flow velocity is low (Gu et al., 2003). The well is 361.62 m deep. The upper 179 m consists of unconsolidated Quaternary sediment, sealed with a casing of 168 mm in diameter. The water-resisting Middle Jurassic argillite, at depths of 179– 252 m, is protected by a casing of 146 mm in diameter. The aquifer we analyzed is a confined, fissured aquifer of Middle Jurassic andesite tuff, which occurs at depths below 252 m. The diameter of the well in the water-bearing section is 130 mm. The primary water level during the analysis period was at a depth of 3.29 m. This aquifer shows a weak discharge of 10–20 m3/m·d and a low hydraulic conductivity of 0.1044 m/d. The water temperature in the well is around 22 °C, and the thermometer is located 178 m underground (Fig. 1). The hydrochemistry of the water is characterized by HCO3-CaMg, and it contains minerals at concentrations of less than 1 g/L (Yang et al., 2007). 2.2. Observation Instruments The water level measurement system installed in Tayuan Well is constitutes of a pressure probe and a data collector, and the main element of the pressure probe is a proliferation silicon pressure sensor with piezoresistive effect and inte-. Fig. 1. Stratigraphic column of the Tayuan Well.. grated circuits. The pressure sensor has a stainless steel shell with length 280 mm and diameter 40 mm, the signal produced by sensor element is sent to data collector by a cable linked at the top of the shell. The water temperature measurement system installed in Tayuan Well is constitutes of a pressure probe and a data collector, too. The main element of the temperature probe is a quartz temperature sensor with its vibration frequency changing with temperature, and the frequency signal could be transformed to temperature value by a transform circuit. The temperature sensor encapsulates a temperature resonator and a transform circuit with length 300 mm and diameter 30 mm. The signal produced by temperature sensor is sent to data collector by a cable linked at the top of the copper shell..
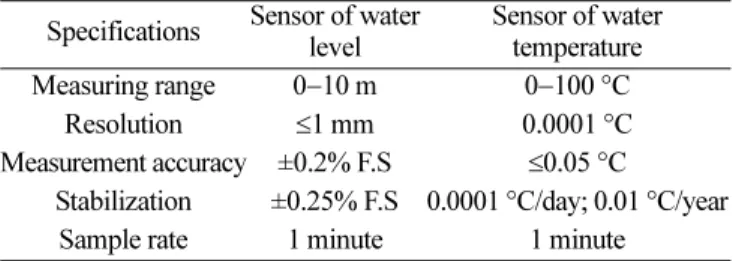
(3) Co-seismic responses of groundwater level and temperature. Table 1. Sensor specifications of water level and temperature Sensor of water Sensor of water level temperature Measuring range 0−10 m 0−100 °C Resolution ≤1 mm 0.0001 °C Measurement accuracy ±0.2% F.S ≤0.05 °C Stabilization ±0.25% F.S 0.0001 °C/day; 0.01 °C/year Sample rate 1 minute 1 minute Specifications. The sensors specifications of water level and temperature instrumentation are listed in Table 1, and the measured water level and temperature are showed in Figure 2, May 1120, 2007, both sensors of water level and temperature can record the earth tide effect clearly. The curve of water level is smoother than the curve of temperature, because of the different information mechanism of each other. Changes in water level are associated with the changes in water pressure head, and the changes in water temperature are asso-. 329. ciated with heat exchange induced by water flow, oscillation, mixing and so on. 3. CO-SEISMIC CHARACTERISTICS OF GROUNDWATER IN THE TAYUAN WELL From February 2004 to July 2009, 85 earthquakes with magnitude > 7 occurred worldwide. We analyzed the groundwater change induced by those earthquakes, yielding the following results. (1) Sixty-four of the earthquakes induced water-level changes, and all the changes occurred in the form of oscillations, ranging in amplitude from 1.5 to 256 mm. Figure 3 shows the amplitude of water-level oscillations relative to earthquake magnitude and distance to the epicenter. Earthquakes with larger magnitudes tend to induce oscillations with a greater amplitude, and greater distances to the epicenter tend to induce oscillations with a smaller amplitude. (2) Sixty of the earthquakes induced changes in water. Fig. 2. The measured water level and temperature in Tayuan Well, May 11− 20, 2007.. Fig. 3. Relation between change in groundwater level, and earthquake magnitude and distance to the epicenter, where h is the amplitude of oscillations in water level and lgh is the denarylogarithm of h..
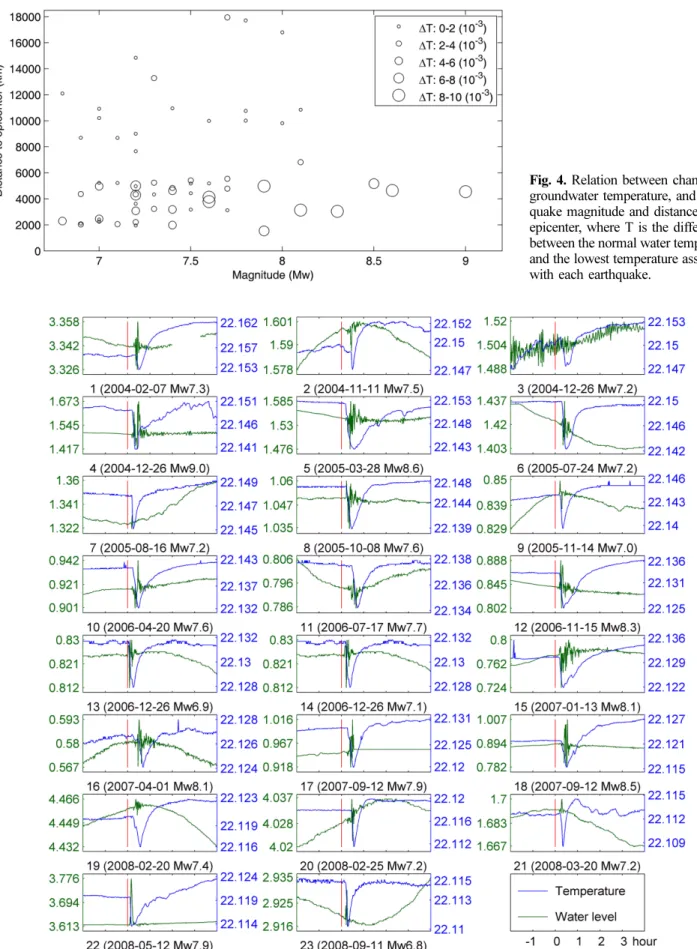
(4) 330. Xiaolong Sun and Yaowei Liu. Fig. 4. Relation between change in groundwater temperature, and earthquake magnitude and distance to the epicenter, where T is the difference between the normal water temperature and the lowest temperature associated with each earthquake.. Fig. 5. Co-seismic changes in water level and temperature in the Tayuan Well. Vertical red lines mark out the time of every earthquake happened..
(5) Table 2. Data on 23 earthquakes that induced a significant co-seismic response in the Tayuan Well, from 1 January 2004 to 31 December 2008 Date (a-m-d). Time (h:m:s). Long. (°E). Lat. (°N). 1 2 3 4 5 6 7 8 9 10 11 12 13 14 15 16 17 18 19 20 21 22 23. 2004-02-07 2004-11-11 2004-12-26 2004-12-26 2005-03-28 2005-07-24 2005-08-16 2005-10-08 2005-11-14 2006-04-20 2006-07-17 2006-11-15 2006-12-26 2006-12-26 2007-01-13 2007-04-01 2007-09-12 2007-09-12 2008-02-20 2008-02-25 2008-03-20 2008-05-12 2008-09-11. 02:42:35 21:26:41 04:21:30 00:58:53 16:09:37 15:42:06 02:46:28 03:50:41 21:38:51 23:25:02 08:19:27 11:14:13 12:34:14 12:26:21 04:23:21 20:39:59 23:49:04 11:10:27 08:08:30 08:36:33 22:32:58 06:28:01 00:20:51. 135.023 124.868 92.958 95.982 97.108 92.19 142.039 73.588 144.896 167.089 107.419 153.266 120.493 120.547 154.524 157.043 100.841 101.367 95.964 99.972 81.467 103.322 143.754. −4.003 −8.152 6.91 3.295 2.085 7.92 38.276 34.539 38.107 60.949 −9.284 46.592 21.974 21.799 46.243 −8.466 −2.625 −4.438 2.768 −2.486 35.49 31.002 41.892. Distance To epicenter (km) 5250 5420 4350 4560 4640 4290 2220 3790 2460 4130 5550 3050 2040 2060 3140 6820 4990 5170 4620 5010 3090 1540 2300. Magnitude (Mw) 7.3 7.5 7.2 9.0 8.6 7.2 7.2 7.6 7.0 7.6 7.7 8.3 6.9 7.1 8.1 8.1 7.9 8.5 7.4 7.2 7.2 7.9 6.8. Amplitude of water level (mm) 32.0 14.0 25.0 256.0 108.0 31.0 10.6 25.6 12.0 41.6 12.6 86.0 10.0 18.0 76.0 25.6 98.6 226.0 11.4 14.4 10.0 162.0 14.0. Amplitude of temperature (×10–3 °C) 2.9 2.7 3.7 8.5 9.8 7.6 2.8 8.4 4.3 9.0 3.3 8.2 3.8 3.8 8.9 2.7 8.9 6.4 4.4 6.4 4.2 6.1 4.8. Epicenter Irian Jaya Region, Indonesia Timor Region Nicobar Islands, India Region Off W Coast of Northern Sumatra Northern Sumatra, Indonesia Nicobar Islands, India Region Near East Coast of Honshu, Japan Pakistan Off East Coast of Honshu, Japan Eastern Siberia, Russia South of Java, Indonesia Kuril Islands Taiwan Region Taiwan Region East Of Kuril Islands Solomon Islands Southern Sumatra, Indonesia Southern Sumatra, Indonesia Off W Coast of Northern Sumatra Southern Sumatra, Indonesia Southern Xinjiang, China Sichuan, China Hokkaido, Japan Region. Co-seismic responses of groundwater level and temperature. Sequence. 331.
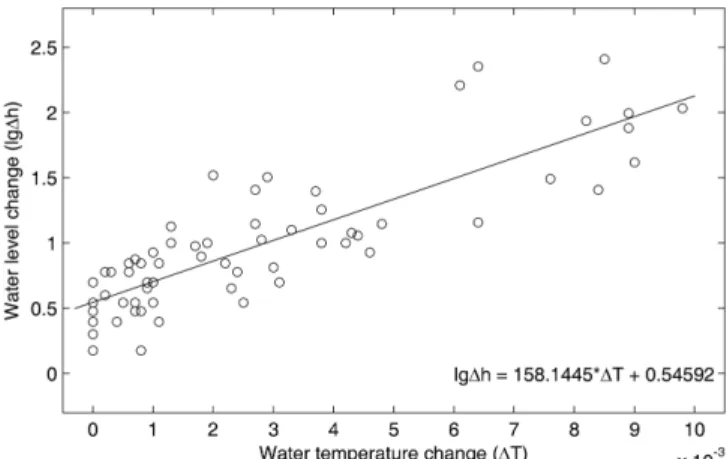
(6) 332. Xiaolong Sun and Yaowei Liu. temperature, with all the changes being a decrease of between 0.0002 °C and 0.0098 °C. Figure 4 shows the relation between the magnitude of water-temperature decrease, and earthquake magnitude and distance to the epicenter. Earthquakes with larger magnitudes and closer earthquakes induce a greater temperature decrease. (3) Fifty-five of the earthquakes synchronously induced co-seismic changes in groundwater level and temperature (i.e., oscillations in water level and a temperature decrease). Figure 5 shows 23 records of co-seismic changes in the amplitude of water-level oscillations (>10 mm) and in temperature (>0.002 °C). Detailed information on these earthquakes is listed in Table 2. From Figure 5 and Table 2, we can see that the lag time between onsets of changes in water level or temperature and origin time of event happened (vertical red lines) are related with the distance to epicenter. So, we think that the onset of changes in water level is corresponding to the arrival times of Rayleigh waves, and the onsets of changes in temperature is corresponding to the water level oscillation or flow induced by Rayleigh waves. The magnitude of the temperature decrease is directly related to the amplitude of water-level oscillations, both of which in turn are related to earthquake magnitude and distance to the epicenter. Following Roeloffs (1998), we performed a regression analysis to obtain the following relationship between the amplitude of water-level oscillations (∆h) and the magnitude of temperature decrease (∆T) induced by distant earthquakes: lg(∆h) = 158.1445×∆T + 0.5459. (1). Figure 6 shows the relationship between groundwaterlevel change and temperature change, as described by Equation (1), revealing that the denary logarithm of h has a linear relation with ∆T. Given that the data were measured every minute, the measured amplitude of water-level oscillations and the magnitude of temperature decrease induced by distant earthquakes may be underestimated. Despite the. Fig. 6. Relationships between coseismic water-level change and temperature change.. inaccuracy in Equation (1), it still enables a discussion on the relationship among earthquake magnitude, distance to the epicenter, and the magnitude of the co-seismic response. Copper et al. (1965) reported that the co-seismic response of a well-aquifer system is related to its hydrogeological parameters, such as transmissibility, storage coefficient, and porosity. 4. MECHANISM OF WATER-LEVEL OSCILLATIONS AND TEMPERATURE DECREASE We refer to the water-level oscillation caused by seismic waves as a “co-seismic water-level oscillation”. Such oscillations were first studied in the 1960s, and Cooper et al. (1965) reported that the degree to which the water level in an open well fluctuates in response to a seismic wave is determined by the dimensions of the well, the transmissibility, storage coefficient, and porosity of the aquifer, and the type, period, and amplitude of the wave. Liu (1986) showed that a well-aquifer system could magnify the effect of seismic waves. Generally, the earthquake-reflecting ability of a well-aquifer system is related to its inherent frequency, and to the current-regulation ability and capability of the monitoring device, whereas the oscillation-amplitude of water level is related to the magnitude of the earthquake and distance to the epicenter. Che et al. (1989) studied the amplitude of water-level oscillations in response to the Akita MS7.8 earthquake of 26 May 1983, based on data from the China Earthquake Groundwater Observation Network, and found that 88% of wells in carbonate rocks with relatively high permeability were able to record earthquakes, while the amplitude of oscillations in 50% of the wells was greater than 10 cm. Of the wells in a porous sandstone aquifer, 75% recorded earthquakes and 10% recorded an amplitude of oscillations greater than 10 cm. Of the wells in a fissured magmatic rock aquifer, 43% recorded earthquakes and 15% recorded an amplitude of oscillations greater than 10 cm. These results indicate that the earthquake-reflecting ability of a well is controlled mainly by the transmissibility of the wellaquifer system. Recent studies have examined co-seismic changes in water temperature, although the mechanisms that underlie such changes have received little attention. Fu (1988) was the first to observe a co-seismic response of water temperature, and Che et al. (1996) and Yu et al. (1997) examined co-seismic changes in water temperature within wells in the Beijing area. Liu et al. (2005) analyzed the characteristics of the main responses in co-seismic response data of the China Groundwater Observation Network, related to the 26 December 2004 Sumatra earthquake. Yang et al. (2007) studied the co-seismic response of water temperature in the Tayuan Well. Chen et al. (2007) and Shi et al. (2007) considered the mechanisms of co-seismic responses induced by.
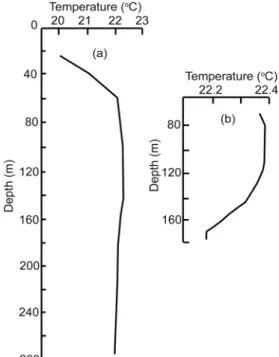
(7) Co-seismic responses of groundwater level and temperature. various earthquakes in the Tangshan mine well. These previous studies have proposed three main mechanisms of water-temperature decrease induced by distant earthquakes, as summarized in the following sections. 4.1. Gas Escape Yu et al. (1997) observed air bubbles emerging from well water at the time of a decrease in water temperature, indicating that gas release from the well may explain the temperature drop. As water level oscillates, the gas released from the well would draw heat from the water, causing a drop in temperature. Similarly, Chen et al. (2007) proposed that changes in water level and temperature were caused by gas heat dissipation. As gas rises from the well bottom, it expands as the pressure decreases, meaning that the gas absorbs heat from the water around it. Both of these mechanisms would induce a decrease in water temperature. These studies showed that gas escape is the dominant mechanism in the case of greater elastic deformation of the solid framework in an aquifer under the action of seismic waves. Though the mechanism of gas escape is reasonable, it can be argued that the temperature decrease is induced by gas escape. The ideal gas equation is as follows (Beak et al., 2002): PV = nRT. (2). where P is absolute pressure, V is volume, T is absolute temperature, R is a universal constant, and n is a gas molar constant. This equation indicates that the volume of a gas bubble will increase and the pressure will decrease while it is rising, even if the temperature of the water remains constant. In addition, if the water temperature is higher at the bottom of the well than at the top, the temperature of the gas will decrease because of heat exchange between the gas and water. This point raises doubt concerning the effectiveness of the gas escape mechanism. A water-temperature decrease can also be explained in terms of the decalescence of a phase change. As is well known, matter absorbs heat during the phase change from liquid to gas. The gas dissolved in well water changes from liquid to gas, and escapes as the water shakes, absorbing heat from the water and resulting in a decrease in water temperature. Well water contains a large amount of dissolved gas, which is a precondition for the gas-escape mechanism. 4.2. Heat Diffusion Shi et al. (2007) proposed a mechanism of heat diffusion to explain decreases in water temperature, based on an analysis of co-seismic data from the Tangshan mine well. The main mechanism was the domino effect of the diffusion of water molecules, which occurs at a higher rate during peri-. 333. ods of oscillating water level. The diffusion coefficient is related to stream flow, which is very small in static water, and shows a marked increase at times of oscillating water level. Water molecules with high kinetic energy diffuse into water with low kinetic energy, and relatively warm water diffuses into relatively cold water. These processes result in a change in the water temperature. Similarly, Yang et al. (2007) proposed that convection in a well would accelerate with the arrival of seismic waves at the aquifer, resulting in the ascent of warmer water at the bottom of the well, and descent of cooler water at the top. This mixing of water bodies with different temperatures would result in a co-seismic change in temperature. A precondition for water diffusion is a gradient in water temperature within the well. Generally, the water in a well is warmer at the bottom and cooler at the top. The co-seismic response and amplitude depend on the position of the detector within the well; however, this does not ideally explain the co-seismic temperature drop recorded in the Tayuan Well. Gu et al. (2003) reported that water temperature in the Tayuan Well shows a gradual rise with increasing depth at depths of 0–80 m, but shows a slight decrease with increasing depth at depths below 80 m (Fig. 7), with a difference in temperature (between depths of 80 and 180 m) of 0.3 °C at an average gradient of 0.0015 °C/m (detector depth, 178 m). The maximum change in temperature induced by seismic waves is up to 0.01 °C, which would be insufficient to explain the co-seismic response by the temperature gradient if we only consider the heat diffusion induced by water-level oscillations in different layers. 4.3. Cool-Water Seepage Liu et al. (2005) explained the co-seismic response of water level and temperature in terms of cool-water seepage. Along with the oscillation effect, the flow rate of water in a shallow aquifer accelerates downwards vertically, and cool water is mixed into the aquifer where the detector is placed, so that temperature changes are detected. Cooler water accumulates in the porous medium or in fissures, and is generally not transported over long distances. Such water seepage can lead to the short-term and short-distance transportation of groundwater, without a distinct rise in water level within the well. In terms of water seepage, when seismic waves arrive at the aquifer, the relatively cool perched water is stirred by the repeated effects of tension and compression (Brodsky et al., 2003; Iassonov and Beresnev, 2003; Montgomery and Manga, 2003; Sun and Cheng, 2004; Wang et al., 2004), and seeps into the main aquifer, resulting in a decrease in water temperature. Because of the orientation of flow in the aquifer, heat exchange occurs between well water and aquifer flow. The magnitude of the temperature decrease is greater if the temperature detector is located in the area of water.
(8) 334. Xiaolong Sun and Yaowei Liu. exchange. If the detector is insulated by a cannula, heat exchange occurs even though there is no direct contact with the water. As in the case of water flow around a horizontal tube, the temperature drops because of heat exchange induced by the convection of water in the well and in the aquifer. Generally, the water head in a confined aquifer is greater than that in the upper aquifer, meaning that the upper water does not readily seep downwards. Water seepage always occurs in a semiconfined aquifer or a phreatic aquifer. A precondition for water seepage is the existence of water in the detected layer, and the phenomenon of temperature decrease is more pronounced in the case of faster stream flow. In addition, the magnitude of the temperature decrease Fig. 8. Cross-section of a sensor in a well-hole. is related to the perched water content of the upper aquifer. Taken together, the results of previous studies indicate that a comprehensive analysis of well-aquifer systems is higher than that before the initial drop. In terms of identifying the mechanism of temperature needed to explain the co-seismic response of groundwater, and it is difficult to explain the changes in terms of a single decrease during water-level oscillations, the nature of the mechanism. A co-seismic response of groundwater may be recovery in temperature after the cessation of oscillations is induced by any of the mechanisms outlined above, or by of interest. Shi et al. (2007) explained the recovery in terms of heat exchange, and simulated a recovery by an axially other, unknown mechanisms. symmetric plane mode. As shown in Figure 8, it is assumed in the model that the recovery of well-water temperature is 5. MECHANISM OF TEMPERATURE RECOVERY governed by heat exchange between well water and the wall AFTER THE CESSATION OF WATER-LEVEL rock. Because of the symmetry of the area of the water OSCILLATIONS well, we simplified the model to one-dimensional cylindriFigure 5 shows that the water level has largely stopped cal geometry with radial transient heat conduction, and simoscillating by the time of the recovery in water temperature. ulated the heat exchange in the process of temperature The time taken for temperature recovery (30–150 minutes) recovery, using the finite difference method. The model is is greater than the time taken for the temperature drop (10– formulated as follows (Yang and Tao, 2006): 20 minutes), and the recovered temperature is sometimes 2 ∂ t 1 ∂t ∂t ρc ----- = λ ⎛ -------2 + --- -----⎞ ( 0 < r < R ) ⎝ ∂r r ∂r⎠ ∂τ ∂t = 0, t ( R, τ ) = t∞ ----∂r r = 0 t ( r, 0 ) = t0. Fig. 7. Relationship between water temperature and depth in the Tayuan Well.. (0 ≤ r < R). (3). where ρ, c, and λ are the water specific heat, consistency, and heat conductivity, respectively. R is the well radius, r is the distance from the well center to an arbitrary point of interest, τ is time, t is water temperature, t∞ is the temperature of the wall of the well, and t0 is the initial water temperature. In a unit volume of aquifer, the volume of wall rock is generally much greater than that of water, and the heat conductivity in the wall rock is much higher than that in well water. For example, the heat exchange coefficient of sandstone is 3 W/m·K, compared with 0.6 W/m·K for water. A seismic wave has little effect on the temperature of wall rock, as any temperature change is quickly corrected. Here, we only consider heat exchange during the period of recovery of water temperature, and the temperature of wall rock is assumed to be invariable. Other parameters are the ther-.
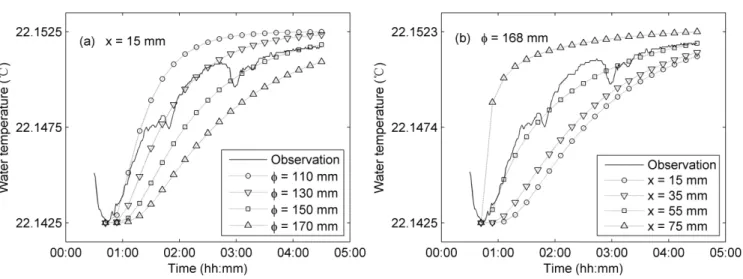
(9) Co-seismic responses of groundwater level and temperature. 335. Fig. 9. Simulated temperature recovery of well water in the case of various well diameters and sites.. mal and physical properties of water at 20 °C (i.e., density of 1000 kg/m3, specific heat of 4185 J/kg·K, and heat conductivity of 0.6 W/m·K). To compare the modeled results with observed data, we set the initial temperature of well water t0, the temperature of wall rock t, and the radius of the temperature probe r to be 22.1425 °C, 22.1525 °C, and 30 mm, respectively, which are observed values. Figure 9 shows the simulation results, along with observed data for the changes induced by the Sumatra earthquake of 29 March 2005. Figure 9a shows the simulated recovery curves of water temperature with difference well diameters, revealing that the temperature recovery is quicker in the case of a smaller diameter. Figure 9b shows the recovery curves of temperature at difference sites. with a constant probe diameter, revealing that the temperature recovery is quicker in the case of a closer sidewall. The temperature probe in the Tayuan Well is located at a depth of 178 m, where the well-hole diameter R is 168 mm (Fig. 1). Figure 9 shows that the simulated temperature recovery with a well-hole diameter of 168 mm is slower than that observed; the recovery with a diameter of 130 mm is closest to that observed. Using a diameter of 130 mm, we simulated recovery curves for four other earthquakes, with different t0 and t∞, and the parameters of water are the same as Figure 9 (i.e., density of 1000 kg/m3, specific heat of 4185 J/kg·K, and heat conductivity of 0.6 W/m·K). Figure 10 shows a good agreement between the simulated and observed curves for these events. Why is it that the simu-. Fig. 10. Simulated temperature recoveryof well water in the case of various earthquakes with the same well diameter of 130 mm, and the other parameters as ρ = 1000 kg/m3, c = 4185 J/kg·K, and λ = 0.6 W/m·K..
(10) 336. Xiaolong Sun and Yaowei Liu. lated values obtained using the actual diameter of the wellhole are smaller than those observed? If we were to consider the effect of wall-rock temperature change induced by water-level oscillations, the simulated values would be even smaller. This result is explained in the following points. (1) Figure 9a shows that the well radius has a direct effect on the recovery of water temperature. The temperature probe is assumed to be in the center of the well. If the probe is tilted or displaced, this would affect the measurements of temperature recovery. The greater the distance from a given point to the well center, the faster the recovery. (2) In addition to heat exchange, convection plays a role in the recovery of water temperature. Recovery to a value higher than the original temperature indicates an exchange of water between the well and the aquifer under the influence of seismic wave excitation, induced by the mixture of water bodies with different temperatures. (3) If there is sufficient dissolved gas in the well, gas bubbles will continue to move upward after the oscillations have ceased. Heat exchange occurs between water bodies of different temperatures while the gas bubbles move upwards into cool water in shallow layers. The gas bubbles release heat that is absorbed by well water, meaning the recovered water temperature is higher than that before the temperature drop. (4) Shi et al. (2007) proposed that the difference between the simulation results and observations is due to the use of a two-dimensional rather than three-dimensional model, arguing that a three-dimension model would provide a more accurate result. This may explain why the simple model used in the present simulations yielded lower values than those observed. Taken together, the above findings indicate that watertemperature recovery is not only related to static heat exchange, but also to the characteristics of the well-aquifer system and the form of the seismic wave. 6. DISCUSSION AND CONCLUSION Changes in water level and temperature induced by distant earthquakes have been studied by many researchers, and the mechanism of co-seismic water level oscillation is very clear, as corresponding to the Rayleigh waves. However, the mechanisms of co-seismic changes in water temperature reported in previous researches were not clear. Shi et al. (2007) explained the drop-recovery phenomenon of co-seismic change in temperature as the mixing of well water with different temperature in different depth, by analyzing the water temperature changes in Tangshan Well induced by distant earthquakes, but we thought the mechanism proposed by Shi was not suitable for Tayuan Well because of its negative and small temperature gradient. Yang el al. (2007) has discussed the mechanism of co-seismic changes in Tayuan Well, but only with simple qualitative description, no quantitative results. We analyzed the co-. seismic groundwater response of the Tayuan Well to various earthquakes, and discussed the mechanisms of droprecovery phenomenon in water temperature and simulated the temperature recovery by a cylindrical mode in terms of heat conduction. By considering the controlling mechanisms of the response, we yielded the following results and conclusions. (1) The co-seismic response of the Tayuan Well generally involves the following sequence: water-level oscillation → temperature decrease → oscillations stop → temperature recovery. The amplitude of the water level and temperature responses is related to the distance to the epicenter and to the earthquake magnitude. (2) The mechanism of the response induced by seismic waves is complex. The decrease in water temperature that follows water-level oscillations may be explained by gas escape, heat diffusion, or cool-water seepage. Each of these mechanisms is plausible, but no single mechanism is able to fully explain the co-seismic responses to multiple earthquakes recorded in the Tayuan Well. Subsequent studies should seek to identify additional mechanisms. (3) The mechanism of temperature recovery after the period of water-level oscillation involves heat conduction between water and the wall rock; however, there are discrepancies between simulated and observed temperature recoveries, reflecting the choice of model. More accurate and robust models are needed to better explain the observations. (4) The sampling rate of water-level detectors is currently 1 minute. A higher rate would provide the data required to identify the mechanism that underlies the co-seismic response. Detectors should be placed within different geological layers in the well in order to identify the dominant mechanism. ACKNOWLEDGMENTS: We are grateful to the reviewers and to the Editor for their comments and painstaking work. We also thank Yongtai Che for critical and constructive suggestions that helped to improve the manuscript. This study was supported by a Research Grant from The Institute of Crustal Dynamics, CEA, under Contract NO. ZDJ2011-11.. REFERENCES Asteriadis, G. and Livieratos, E., 1989, Pre-seismic responses of underground water level and temperature concerning a 4.8 magnitude earthquake in Greece on October 20, 1988. Tectonophysics, 170, 165−169. Beak, F.J., Hector, E., and Xuan, Z., 2002, Fundamentals of Physics. Science Press, Beijing, 125 p. (in Chinese) Brodsky, E.E., Roeloffs, E.A., Woodcock, D., Gall, I., and Manga, M., 2003, A mechanism for sustained groundwater pressure changes induced by distant earthquakes. Journal of Geophysical Research, 108, doi:10.1029/2002JB002321. Che, Y.T., Wang, T.C., and Yu, J.Z., 1989, The status and direction of hydrosonic in China. Earthquake, 9, 70−72. (in Chinese with English abstract).
(11) Co-seismic responses of groundwater level and temperature. Che, Y.T., Yu, J.Z., and Liu, C.G., 1996, Researches and dynamic observation of groundwater temperature in China. Hydrogeology and Engineering Geology, 4, 34−37. (in Chinese with English abstract) Chen, D.Q., Liu, Y.W., Yang, X.H., and Liu, Y.M., 2007, Co-seismic water level, temperature responses of some wells to far-field strong earthquakes and their mechanisms. Seismology and Geology, 29, 122−132. (in Chinese with English abstract) Cooper, H.H., Bredehoeft, J.D., Papadopulos, I.S., and Bennett, R.R., 1965, The response of well-aquifer systems to seismic waves. Journal of Geophysical Research, 70, 3915−3926. Fu, Z.Z., 1988, Premonition and dynamic observation of terrestrial heat. Corpus of Crust Structure and Stress, 1, 1−7. (in Chinese with English abstract) Furuya, I. and Shimamura, H., 1988, Groundwater microtemperature and strain. Geophysical Journal International, 94, 345−353. Gu, Y.Z., Che, Y.T., Yu, J.Z., and Zhang, P.Z., 2003, The study of the micro dynamic state of water temperature of the Tayuan Well. Earthquake, 23, 102−108. (in Chinese with English abstract) Hamza, V.M., 2001, Tectonic leakage of fault bounded aquifers subject to non-isothermal recharge: a mechanism generating thermal precursors to seismic events. Physics of the Earth and Planetary Interiors, 126, 163−177. Iassonov, P.P. and Beresnev, I.A., 2003, A model for enhanced fluid percolation in porous media by application of low-frequency elastic waves. Journal of Geophysical Research, 108, doi: 10.1029/2001JB000683. Liu, L.B., Zhen, X.Y., and Peng, G.R., 1986, Primary analyze of water surging induced seismic wave in Wali well. Earthquake, 5, 12−19. (in Chinese with English abstract) Liu, Y.W., Yang, X.H., and Liu, Y.M., 2005, The characters of groundwater responses induced by Sumatra Ms 8.7 earthquake. In: Survey and Forecast Department of CEA (ed.), Effect in Chinese Mainland Induced by Sumatra 8.7 Earthquake in Indonesia, 2004. Earthquake Press, Beijing, p. 131−258. (in Chinese) Montgomery, D.R. and Manga, M., 2003, Streamflow and water well responses to earthquakes. Science, 300, 2047−2049. Iassonov, P.P. and Beresnev, I.A., 2003, A model for enhanced fluid. 337. percolation in porous media by application of low-frequency elastic waves. Journal of Geophysical Research, 108, 21−38, doi10.1029/2001JB000683. Palciauskas, V.V. and Domenico, P.A., 1982, Characterization of drained and undrained response of thermally loaded repository rocks. Water Resources Research, 18, 281−290. Roeloffs, E.A., 1998, Persistent water level changes in a well near Parkfield California, due to local and distant earthquakes. Journal of Geophysical Research, 103, 869−889. Shi, Y.L., Cao, J.L., Ma, L., and Yin, B.J., 2007, Tele-seismic coseismic well temperature changes and their interpretation. Acta Seismologica Sinica, 29, 265−273. (in Chinese with English abstract) Shimamura, H., Ino, M., Hikawa, H., and Iwasaki, T., 1984, Groundwater microtemperature in earthquake regions. Pure and Applied Geophysics, 122, 298−314. Sun, R.Y. and Cheng, G.X., 2004, Effect of artificial vibration on liquids flow through porous media. Journal of Hydrodynamics, 19, 552−557. (in Chinese with English abstract) Wang, C., Wang, C.H., and Manga, M., 2004, Coseismic release of water from mountains: Evidence from the 1999 (MW=7.5) ChiChi, Taiwan, earthquake. Geology, 32, 769−772. Yang, S.M. and Tao, W.Q., 2006, Heat Transmission. In: Song, X. (ed.), Unsteady Heat Conduction. Higher Education Press, Beijing, p. 112−138. (in Chinese) Yang, Z.Z., Deng, Z.H., Zhao, Y.X., and Zhu, P.Y., 2005, Preliminary study on coseismic steps of water-level in Dazhai well, Simao city, Yunnan province. Acta Seismologica Sinica, 27, 569−574. (in Chinese with English abstract) Yang, Z.Z., Deng, Z.H., Tao, J.L., Gu, Y.Z., Wang, Z.M., and Liu, C.L., 2007, Coseismic effects of water temperature based on digital observation from Tayuan well, Beijing. Acta Seismologica Sinica, 29, 203−213. (in Chinese with English abstract) Yu, J.Z., Che, Y.T., and Liu, W.Z., 1997, Preliminary study on hydrodynamic mechanism of microbehavior of water temperature in well. Earthquake, 17, 389−396. (in Chinese with English abstract) Manuscript received May 9, 2011 Manuscript accepted May 22, 2012.
(12)
수치

+3
관련 문서
The aim of this study was to characterize 281 geothermal waters in South Korea based on the relationship among geology, geological structure, specific capacity, water temperature,
A three-dimensional numerical model for groundwater flow and heat transport is used to determine the annual variation of recovery temperature from the borehole ther- mal
In addition, the temperature distribution by the pumping and the injection of groundwater, and water level fluctuations are simulated by numerical modeling.. The
This study focused on detailed examination of ground and groundwater temperature characteristics including spa- tial and temporal distribution, vertical variation with well depth
δ 13 C DIC and geochemical parameters including water temperature, pH, Eh, EC, DO and TDS of soil, surface and stream waters in the sandstone terrain, and spring and stream waters
The trend of ionic strength magnitude in sampled ground- water was corresponded with the trends of recovery rates in Tween series surfactant solutions (Fig.. Many significant factors
The influx of river water into ocean is identified by a thermal infrared image and the SGD can be similarly identified at anoma- lous areas of temperature because the temperature
We have established geographical remote sensing information modeling (RSIM) for different erosion that was using remote sensing digital images with geographical ground truth water
