Search of submarine discharge locations with multi-temporal thermal infrared images and ground radar surveys
K. Onishi, M. Sairaiji, S. Rokugawa, T. Tokunaga The University of Tokyo
7-3-1 Hongo, Bunkyo-ku, Tokyo 113-8656, Japan Y. Sakuno
Hiroshima University Higashihiroshima, Hiroshima, Japan Abstract: Fresh water discharge from the sea floor strongly
affects a coastal ecology and the diffusion of contaminants.
Much fresh water discharge has been found in the edge of Ku- robe alluvial fan, in which annual rainfall is over 4000mm and there is abundant groundwater. However, it is difficult to find the groundwater discharge, thus the search of possible areas with some remote sensing tools is required. Because the tem- perature of the discharge point is relatively low compared with the surrounding sea water surfaces, there is a possibility to detect the area as an irregular zone of thermal infrared images.
Two anomalous temperature zones, which have no surface streams from rivers, are detected by ASTER thermal-infrared images. One of them was verified as the groundwater discharge point by dives. In addition, the distribution of water table under the land side of the two areas is also detected as irregular zones by a ground-penetrating radar
Keywords: Submarine groundwater discharge, Thermal infra- red, ASTER, Ground-penetrating radar.
1. Introduction
On some sea floors, fresh groundwater is being dis- charged. This is called submarine groundwater discharge (SGD). It is one of a hydrological interface between land and sea, therefore it is important to understand the be- havior or locations of SGD. However, even now, the distribution of the discharged locations and the correct total volume of discharge points are not clearly under- stood. The research of SGD has recently gotten a lot of attention for groundwater hydrology (Taniguchi et al.
2002).
It is considered that the SGD supplies much more nu- trient salts than surface layer currents like rivers for coastal marine environment and has a significant impact on it. The spreading of the contamination in land is mainly influenced by groundwater flow and the identifi- cation of the spreading route into the sea, which is the SGD, is the major issue of a contamination control. In addition, it is important for the indicator of the boundary between fresh and sea water. The boundary between fresh and sea water is a important observing target for the prevention of the spread of the industrial contamina- tion or the procession of high-energy nuclear waste and becomes the recent controversial research topic.
However, it is very difficult to search the locations of
the SGD. The only reliable method is a direct check with eyes of divers. Therefore, the result of the water balance of the Kurobe alluvial fan indicates a great volume of the SGD near seashore, but it has been discovered at only few points yet. The new methods searching the SGD from sensing electric conductivity or temperature, or using acoustic wave are being studied now. In these situations, Banks et al. tried to find the SGD area by us- ing remote sensing technology in 1996. The influx of river water into ocean is identified by a thermal infrared image and the SGD can be similarly identified at anoma- lous areas of temperature because the temperature of the SGD is different from that of sea water.
2. Research field - Kurobe alluvial fan
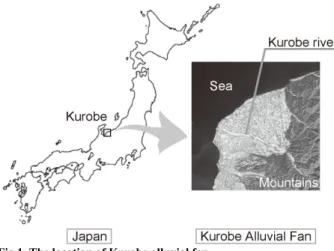
The Kurobe alluvial fan is an unusual alluvial fan which directly faces the sea (Fig.1). The distance from the top of the fan to the edge of the fan is about 12km and the angle of dip is constantly between 10 and 11 per mill. Annual rainfall runs up 4000mm and the fluctua- tion is small through the year and this land has con- stantly rich groundwater. The temperature of the groundwater gently fluctuates from 10 to 17 degree. The Kurobe alluvial fan is a central area of Japanese groundwater research and many measurements are continued over the past 30 years. The SGD is estimated to be about 6.5x10⁸m3/year, which is about 23% of a total river discharge from the Kurobe river and the other smaller channels. The past studies explain that the groundwater levels are high under the top and edge of the fan and low under the central of the fan. There are some points of fresh discharge from unconfined groundwater in the edge of the fan. Some fresh water discharge areas are found under the coast, and resolved components and discharge volume were measured. The SGD mouth is very small but an area is constituted with many SGD mouths and spread over the region of about 100m. Tokunaga et al. succeeded to take pure discharged water in the sea and the electrical conductivity was 0.0175mS/m, which is similar value of river water in the Kurobe alluvial fan.
Fig.1. The location of Kurobe alluvial fan.
3. Searching SGD areas from multi- temporal ASTER thermal infrared images
3-1 The possibility of the identification of discharged areas by surface temperatures on the sea
It is well known that the influx of river water into the sea is identified by a thermal infrared image. Even if it is small stream, the influx can be identified. The total vol- ume of the SGD near the Kurobe alluvial fan is esti- mated much larger than small rivers and the SGD of Ku- robe has a potential to change the temperature of the sea.
However, the SGD, which mixes with seawater from a seafloor, is different of river water, and it is not known exactly that the SGD has a potential to change the tem- perature of the sea surface. But, the SGD, which is fresh water, is usually righter than the seawater and moves upwards in the sea. Fig.2 shows the average distributions of the temperature of seawater, river water, groundwater and air in or near the Kurobe alluvial fan. No scientist has succeeded to measure the temperature of SGD but it is considered to be similar to the groundwater tempera- ture. Fig.2 indicates that the difference of temperatures between SGD and seawater is large in summer and small in winter. On the contrary, the difference of temperatures between river water and seawater do not fluctuate vio- lently through the year. The SGD has a possibility to be identified as an anomalous low temperature area when any river flows do not influence on that area. Also, if the area has a strong influence by river flows, the gradient of multi-temporal images has a possibility to identify the SGD area as a small gradient area. If we can estimate the high possibility areas of SGD by using a rough survey of satellites or airplanes, it is easy to discover unknown discharged points.
Fig.2. Average distributions of temperatures of seawater, river water, groundwater and air.
3-2 ASTER images of the Kurobe alluvial fan
The ASTER sensor has been snapped more than ten fine images of Kurobe alluvial fan. However, the analyzable images for a thermal infrared band, which requests no cloudy scene, decrease less than five images. This study investigated four images before 2004. Banks et al. in- sisted that a night image is better for the observation of the SGD, but unfortunately, only clouds were taken in all night images of the Kurobe alluvial fan.
Table 1 ASTER images in the Kurobe alluvial fan Date of observation Day/Night 14/March/2001 Day 15/March/2001 Day 5/October/2000 Day 30/October/2003 Day
Table 1 shows that the analyzable images are only in spring and autumn.
3-3 The process of temperature
At the examination of absolute temperatures and the calculation of the temperature gradients of multi- temporal images, the digital numbers of images were converted to temperatures under the consideration of the corrections of air and a sensor. The sensor response of all bands has been degrading since the launch, and periodi- cal updating of the gain coefficient does not fully follow the degradation.
Tonooka et al. insists the necessity of a user-based re- calibration for using ASTER thermal infrared images and proposed easy methods of the recalibration (Tonooka et al., 2004). That method is expected to a big corrective effect, thus first it was processed in this study.
K LTC
scene K
org
recal R
D F
D R F
R
R 270 270
) (
) ) (
( − +
= (1)
where Rrecal is the recalibrated radiance, Rorg is the origi- nal radiance of L1B, R270K is the radiance at 270K, Dscene
is the day number when the scene was observed, and DLTC is the day number of the long term calibration giv-
ing radiometric calibration coefficients applied to the scene. Rorg is calculated from L1B DN by the following formula.
) 1 ( −
=UCC N
Rorg (2)
where UCC is the unit conversion coefficient.
Next, sea surface temperatures (SST) can be estimated from thermal infrared radiances using a following Planck's inverse function assuming seawater as a black body.
× +
= × −−
10 1 740 . log 3
10 43848 . 1
5 16
2
i bi
R T
λ λ
(3)
Furthermore, the multi-channel SST (MCSST) equa- tion was also applied for the reduction of the influence by air. In this study, the following coefficients of MCSST equation proposed by Matsunaga was applied (Matsunaga, 1996), because many ocean thesis used these coefficients (Sakuno et al. 2002).
14 13
12
11 10
32 . 0 78
. 0 13
. 1
49 . 0 07
. 1 16 . 1
T T
T
T T
MCSST
×
−
× +
× +
× +
×
−
= (4)
where T10, T11, T12, T13 and T14 are the brightness tem- peratures of the band 10, 11, 12, 13 and 14 of ASTER, respectively. The results of temperature processions are shown in Fig.3.
Fig.3 Temperature images around the west shore of the Kurobe alluvial fan in four terms.
There are no variations in the images in March and
April, so that these two images cannot be useful scenes to be analyzed for sea surface temperature. Two anoma- lous low temperature areas are found in the images taken in 5, October, which was estimated to have the largest difference from seawater to groundwater in these four images. In this image, A area is 21, B area is 20.5, river mouths are 19-20 and the sea is 23 degree Celsius. Many SGD mouths have been still found to spread over wide area under the B area of the two anomalies. Otherwise, it is very difficult to interpret the image of in 30, October.
This image has no anomaly around the B area. The A area has a possibility to be influence by a river flow. We concluded that satellites can identify the areas of SGD, when the flow rate of ocean stream is slow. Therefore, the surface temperature around SGD areas does not keep low, so that using airborne remote sensing is not a prac- tical way.
Finally, the gradient of two images taken in October is calculated for considering the potential of a time-lapse analysis for identifying the variation of temperatures.
Seawater and river water fluctuate at the almost same gradients and only groundwater fluctuates more slowly, so that there are possibility to identify the origins of low temperature areas.
gradient of temperature = (T1-T2)/(T1+T2) (5) Fig.4 is a southern zone of Fig.3, and the left figure is original image and the right is a calculated result of tem- perature gradient. The shape of a river is disappeared in the gradient image and it shows the possibility to negate the zone of river flow. However, because mixture zones may change in terms in the sea, the influence of the river flow in the sea has been still found clearly.
Fig.4. Original temperature image (left) and the image of the gra- dient of temperature (right).
4 Comparison of a ground-penetrating ra- dar records
4-1 Summary of ground-penetrating radar
Many hydrogeologists use the water levels of wells for estimating hydraulic gradients. However, there are not enough wells in a normal field, so the local hydraulic gradient cannot be estimated. Electric exploration is sometimes applied for a groundwater survey but the
method does not have enough accuracy to insist the variation of local groundwater levels because the meas- urement cannot clearly explore the shape of a boundary.
Thus, we have applied the ground-penetrating radar (GPR) for the groundwater survey. The GPR is an in- strument imaging underground objects or structures. It radiates electromagnetic waves from 10MHz to several GHz into the underground and receives reflected or dif- fracted waves on the ground. It is usually used for the survey of buried pipes or holes under roads. Electromag- netic waves within these bands are strongly reflected from the interface of dielectric constants. Because the dielectric constant changes with the variations of water content ratios in soil, the GPR can observe the distribu- tion of groundwater levels.
4-2 Measurement and result of the GPR survey
A vehicle pulled GPR antennas and instruments for the GPR survey as shown in Fig.5. The survey positions were observed by GPS. The survey line is shown in Fig.6 and the section of the result is shown in Fig.7.
Groundwater levels slowly fluctuate and two specific high-level areas, where are not influenced on rivers, are found in this survey region. It is considered that dynamic water pressures in these areas are higher than the other areas. Tracking straight down from these two areas into the seashore, the locations correspond to the low tem- perature areas of the previous satellite image. It is as- sumed that the collaboration of remote sensing and geo- physical prospecting is an effective technique.
Fig.5. The schematic view of our GPR survey.
Fig.6. The GPR survey line.
Fig.7. The long distance (about 2500m) section of GPR.
5 Conclusions
Two anomalous low temperature areas, which are not influenced by any river flows, were found in the east edge of the Kurobe alluvial fan. The places of these areas correspond to the varied zones of the hydraulic gradient estimated from the results of radar surveys in the upper land field. The SGD is found under the one point of the two areas. When the flow rate of ocean stream is slow, satellites can identify the area of SGD. It can only iden- tify the anomaly in summer season considering the fluc- tuation of the temperatures of groundwater and seawater.
There is no summer image now and the new observation of ASTER in summer is hoped in the future. Moreover, for searching the SGD, the development of higher spatial resolution is desired.
References
[1] Banks, W.S.L., R.L. Paylor, and W.B. Hughes, 1996, Using thermal-infrared imagery to delineate ground-w ater discharge, Ground Water, 34, 3, 434-443.
[2] Matunaga, T., 1996, Water surface temperature estima- tion using linear equations of brightness temperature ob- served by Advanced Spaceborne Thermal Emission and Reflection Radiometer/Thermal Infrared Radiometer (ASTER TIR)-Preliminary evaluation of estimation error with atmospheric temperature and humidity data around Japan, J. of the remote sensing soc. of Japan, 16, 5, 2-13.
[3] Sakuno, Y., T. Matsunaga, T. Kozu, and K. Takayasu, 2002, Preliminary study of the monitoring for turbid coastal waters using a new satellite sensor, "ASTER", Proc. of the 12th Inter. Offshore and Polar Engineering Conf. (ISOPE-2002), 341-347.
[4] Taniguchi, M., W.C. Burnett, J.E. Cable, and J.V. Turner, 2002, Investigation of submarine groundwater discharge, Hydrological Progresses, 16, 2115-2129.
[5] Tonooka, H., F. Sakuma, M. Kudoh, and K. Iwafune, 2004, ASTER/TIR onboard calibration status and use r-based recalibration, Proc. of SPIE 5234, 191-201.