Characteristics of ground and groundwater temperatures in a metropolitan city, Korea: considerations for geothermal heat pumps
ABSTRACT: As a basic feasibility study for geothermal heat pumps, characteristics of ground and groundwater temperatures in a metropolitan city, Seoul, were examined. For the purpose, ground- water data obtained from the subsidiary groundwater monitoring wells of the city and data of ground temperatures at depths of 0.05- 5.0 m were analyzed. The annual ground temperature variations decreased exponentially with ground depths and the correspond- ing phase differences compared with the ambient air temperatures increased linearly with them. The ground temperatures were very stable below 3.0-5.0 m depth with minimal annual variation and they were averagely 15
°C. The annual mean groundwater tem- peratures were 15
°C and the groundwaters of most monitoring wells showed the annual variation within 3
°C. All these temper- ature conditions are very promising for the application of the geo- thermal heat pumps. But the limitation of available space for the buried pipes and the thin unconsolidated soil layer in the metro- politan area would restrict the practical wide application of the closed loop systems. So open systems can be beneficial. A large number of the existing groundwater wells and the shallow water levels may enhance efficiency of the open system maintenance.
Some relevant engineering considerations for the groundwater heat pumps were suggested for the metropolitan city.
Key words: ground and groundwater temperature, subsidiary ground- water monitoring wells, open-loop, Seoul, Korea
1. INTRODUCTION
There are numerous methodologies to use abundant nat- ural resource as a renewable energy source in an efficient and environmentally friendly manner for heating and air conditioning industrial, commercial, institutional and resi- dential structures (Boyce and Fitzsimmons, 2003). Ground and groundwater temperatures are ones of the alternative sources for the space heating and cooling (Lund, 1996; Zeng et al., 2003; Hahn et al., 2004; Lee et al., 2006). In some advanced countries, commercial and industrial use of this type energy can be traced up to early 1970s (Bloomquist, 1999). In January 2000, U.S. EPA (Environmental Protection Agency) announced that the geothermal heat pump (GHP or GSHP) is the most efficient and comfortable facility among all devices developed for spacing heating and cool- ing of residential houses and buildings (Hahn et al., 2004).
However, earnest interest, research, commercial application
of the geothermal energy including groundwater heat, and financial incentive scheme have been initiated most recently in Korea (Hahn et al., 2004; Lee et al., 2006).
The ground and groundwater temperatures are substan- tially dependent on solar radiation (Rybach and Sanner, 2000). The radiated solar energy warms the near surface ground and this in turn warms the atmosphere and the underground (BSDUD, 1999). The surface temperatures penetrate into the ground with decreasing intensity and the penetration depth depends on thermal diffusivity of the ground (Koo et al., 2003). There is another form of surface heating origi- nated from interior of the earth (decay of radioactive iso- topes) but this form of heating is much weaker than the sun (BSDUD, 1999). Therefore, the near surface ground and shallow groundwater temperatures are dominantly affected by the exchange of heat between the sun, the earth’s surface and the atmosphere, with a much smaller extent from the earth heat flow directed at the surface (BSDUD, 1999; Lee and Hahn, 2006). But below 15-20 m ground depth, atmo- spheric influences (solar radiation) are clearly negligible (Rybach and Sanner, 2000).
Lee and Hahn (2006) and Hahn et al. (2004) intensively analyzed the groundwater temperature data obtained from the Korean national groundwater monitoring stations (NGMSs).
They analyzed distribution of groundwater temperature throughout the country, classified patterns of groundwater temperature variation and clarified months of highest and lowest temperature occurrence. They also asserted that sta- ble groundwater temperatures, substantial phase difference compared with the air temperatures, and the shallow water tables are very attractive for application of the groundwater heat pumps (GWHPs) in the country. In addition, Lee et al.
(2006) extensively examined other very important param- eters of the NGMSs such as water levels, hydraulic con- ductivity, well yield, hardness, electrical conductivity, and other general water qualities influencing efficiency and maintenance of the groundwater heat pumps. From the study, they concluded that chemistries of most groundwaters in the country are suitable for water quality conditions for GWHPs although some proportions of the shallow and deep groundwaters exhibited scaling and corrosion poten- tials.
Jin-Yong Lee*
GeoGreen21 Co., Ltd., 4th Floor, SEK Building, 1687-22, Bongchon6-dong, Gwanak-gu, Seoul 151-812, Korea*Corresponding author: [email protected]
This study focused on detailed examination of ground and groundwater temperature characteristics including spa- tial and temporal distribution, vertical variation with well depth and relationship between air and groundwater tem- peratures in the metropolitan city, Seoul, Korea. Based on this examination, some implications for practical applica- tion of the geothermal heat pumps in the urban area were drawn. For this study, groundwater data were obtained from 119 subsidiary groundwater monitoring stations (wells), installed and managed by the metropolitan government since 1997.
In addition, ground and air temperatures data from KMA (Korea Meteorological Administration) for the city were examined. In the country, except for some mountainous areas, mean annual air temperatures ranged between 10 and 16°C for past 30 years (1971
−2000) and it was the hottest (23
−27°C) in August while it was the coldest (-6
−-7°C) in January (KMA, 2006). Therefore, space cooling is needed in the months of July
−August and space heating is required for December
−February (Song, 2004).
2. METHODS AND MATERIALS
The Seoul metropolitan government installed a subsidiary groundwater monitoring network composed of 119 moni- toring wells in 1997, to monitor changes in quantity and quality of groundwater resources throughout the metropol- itan city (Fig. 1). The locations of the monitoring wells were initially determined mainly considering groundwater use, recharge/discharge areas, reported water level declines and potential groundwater contamination sources (SMG, 1996;
Lee et al., 2005). The subsidiary groundwater monitoring network supplements the national groundwater monitoring network managed by MOCT (Ministry of Construction and Transportation) and KOWACO (Korea Water Resources Corporation) since 1995 (Lee et al., 2005). Some of the moni- toring wells (6.7%) were newly constructed but most of the wells (93.3%) is existing wells developed for emergency (SDI, 2000).
From each monitoring well, water level, water tempera- ture and electrical conductivity are measured every hour
Fig. 1.
Locations of groundwater monitoring wells in the Seoul metropolitan city. Numeric near the symbol indicates well identification
number.
using an automatic measuring device. The collected data are automatically transferred to a host computer in the city hall by a modem. For accurate data acquisition and opti- mum maintenance, the monitoring station is regularly vis- ited. The depths of the wells are much varying from 13 m to 150 m. The measurement depths (points) are also much varying between 12 m and 116.5 m below ground surface.
For this study, groundwater data (especially groundwater temperatures and groundwater levels) for a period of 1 Jan- uary to 31 December, 2001 were used. In addition, for the same period, data of air temperature and ground tempera- ture (see measuring location, SGTO in Figure 1) at depths of 0.05, 0.1, 0.2, 0.3, 0.5, 1.0, 1.5, 3.0 and 5.0 m obtained from KMA were analyzed. To identify relationship between the air temperature and ground/groundwater tem- perature, a cross-correlation analysis was used (Lee and Lee, 2000).
3. RESULTS AND DISCUSSION 3.1. Ground Temperatures
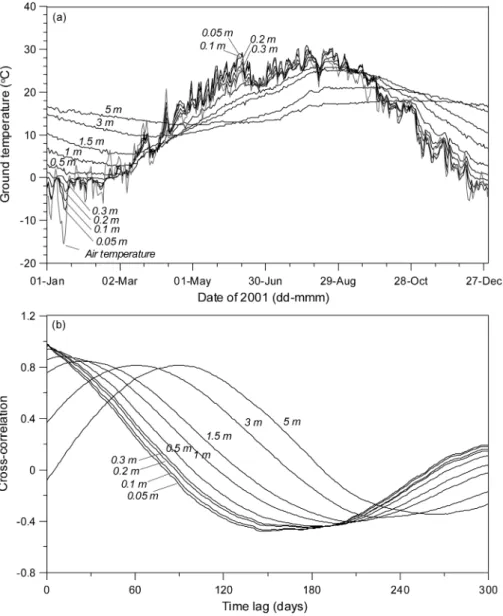
Ground temperatures in the shallow subsurface are dom- inantly affected by the solar radiation (Lee et al., 2000). The solar energy entered into the unit area is large in the sum- mer while it is small in the winter. Daily and seasonal vari- ation of the ground temperatures generally occurs during the transport of the ground surface heat energy into the deeper subsurface (Kim et al., 2005). Because a basic mechanism of the heat transport in the subsurface is the conduction and its rate is much slow, phase difference (time shift) compared with the daily and seasonal variation of the air temperature will occur (Lachenbruch and Marshall, 1986; Beltrami, 2001; Smerdon et al., 2003; Kim et al., 2005).
Figure 2a shows daily ambient air temperatures and ground temperatures measured at depths of 0.05, 0.1, 0.2,
Fig. 2.
Variation of ground tempera-
tures with depth (a) and cross-correla-
tion between air temperature and
ground temperature (b).
0.3, 0.5, 1.0, 1.5, 3.0 and 5.0 m in the Seoul ground tem- perature observatory (see the measurement location, SGTO in Fig. 1). The very shallow ground (0.05
−0.3 m) and air tem- peratures showed fluctuations with a high frequency and a large amplitude. The amplitude (maximum-minimum) of the annual temperature variation ranged between 29.3°C (0.3 m) and 45.5°C (air) (Table 1). Like the air temperature, the ground temperatures at these depths were the highest in August and they were the lowest in January. Mean annual ground temperatures (13.7
−13.8°C) were slighter greater than the mean air temperature (12.9°C). Below the depth of 0.5 m, the ground temperature fluctuation and its amplitude were largely decreased. As the ground depth increases, the ground temperatures in the cold seasons (October-March) increase while those decrease in the hot seasons (May-Sep- tember). At the depth of 5 m, the ground temperature is higher than the air temperature by 19.8°C in January while the former is lower than the latter by 9.5°C in August. Fur- thermore, dates when the lowest temperatures occurring are shifted from February to April. As the ground depth increases, the mean annual ground temperatures gradually increase and the annual variations are greatly reduced (see Table 1). The phase difference between the ambient air tem- perature and the ground temperatures can be identified using a cross-correlation analysis between them (Fig. 2b).
As the ground depth increases, the cross-correlations were not largely reduced but the phase difference significantly increased. To the depth of 0.3 m, no substantial phase dif- ference (lag time) was observed and it indicated nearly simultaneous synchronization of the ground temperatures in association with the variation of the air temperature. Below the depth of 0.5 m, noticeable time lags were found and they ranges between 11 days (1.0 m) and 89 days (5 m).
Auto-correlation and spectral density can give informa- tion on degrees of inter-dependency of successive values and duration of a preceding signal (Angelini, 1997; Larocque et al., 1998). The quantitative values used in this study are the time lag (time at zero auto-correlation is attained) and the regulation time (see Lee and Lee, 2000). The regulation
time, obtained from the spectral density function defines the duration of the influence of the input signal and gives an indication of the length of the impulse response of the con- cerned system (Larocque et al., 1998). Table 2 shows the time lags and the regulation times of the air and the ground temperatures signals. As expected, the temperatures showed excellent inter-dependency among the successive values, which resulted in substantial lag times ranging from 81 to 104 days. Compared with data of precipitation generally regarded as random variable, the air and ground tempera- tures showed much longer memory effects.
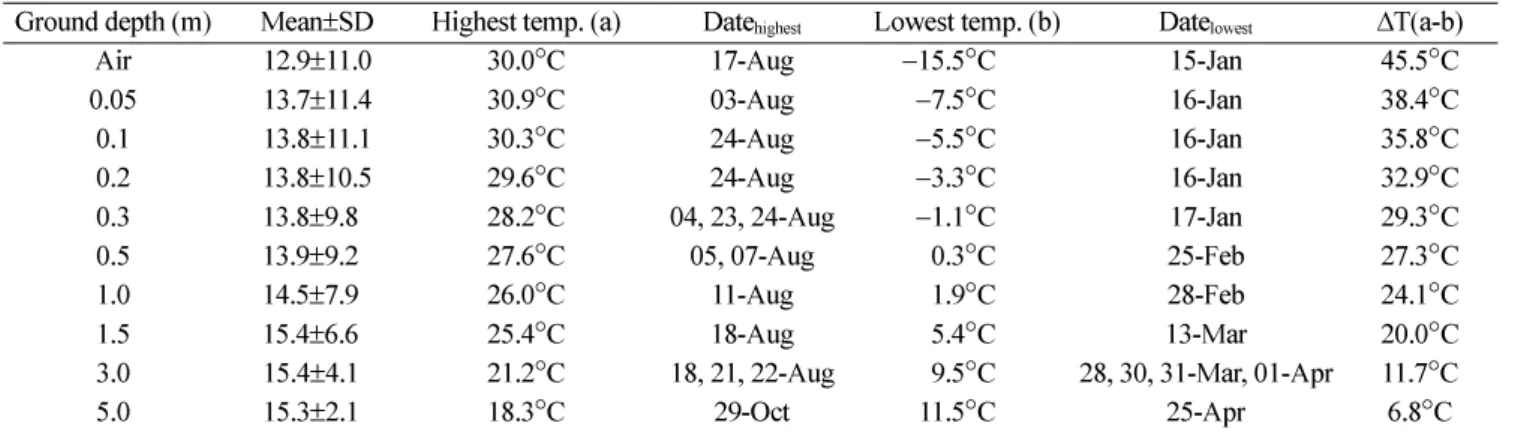
The annual temperature variation exponentially decreases with depth (Smerdon et al., 2003). From the simple regres- sion of the exponential function (actually the inverse of it in this figure, logarithmic function; Fig. 3a), a depth showing practically no variation was estimated as about 15 m. The variation of the solar radiation does not affect the ground temperatures below this depth. As previously described, the phase difference would occur with ground depth. The time shift estimated form the cross-correlation is linearly propor-
Table 1.
Summary of ground temperatures measured at the Seoul observatory (SGTO).
Ground depth (m) Mean
±SD Highest temp. (a) Date
highestLowest temp. (b) Date
lowest ∆T(a-b)
Air 12.9
±11.0 30.0 ° C 17-Aug
−15.5 ° C 15-Jan 45.5 ° C
0.05 13.7
±11.4 30.9 ° C 03-Aug
−7.5 ° C 16-Jan 38.4 ° C
0.1 13.8
±11.1 30.3 ° C 24-Aug
−5.5 ° C 16-Jan 35.8 ° C
0.2 13.8
±10.5 29.6 ° C 24-Aug
−3.3 ° C 16-Jan 32.9 ° C
0.3 13.8
±9.81 28.2 ° C 04, 23, 24-Aug
−1.1 ° C 17-Jan 29.3 ° C
0.5 13.9
±9.21 27.6 ° C 05, 07-Aug 0.3 ° C 25-Feb 27.3 ° C
1.0 14.5
±7.91 26.0 ° C 11-Aug 1.9 ° C 28-Feb 24.1 ° C
1.5 15.4
±6.61 25.4 ° C 18-Aug 5.4 ° C 13-Mar 20.0 ° C
3.0 15.4
±4.11 21.2 ° C 18, 21, 22-Aug 9.5 ° C 28, 30, 31-Mar, 01-Apr 11.7 ° C
5.0 15.3
±2.11 18.3 ° C 29-Oct 11.5 ° C 25-Apr 6.8 ° C
Table 2.
Results of auto-correlation analysis of air and ground tem- peratures at SGTO.
Ground depth
(m) Time lag
(auto-correlation=0) Regulation time (days)
Precipitation
a14 days 12.6
Air temp. 84 days 24.1
10.05 81 days 22.6
0.1 82 days 23.9
0.2 83 days 26.6
0.3 84 days 28.3
0.5 87 days 33.9
1.0 93 days 45.2
1.5 97 days 54.1
3.0 104 days1 66.2
5.0 98 days1 55.5
a
Data of daily precipitation is for comparison and reference purpose
tional to the ground depth (Koo et al., 2003). According to the linear regression (Fig. 3b), the time shift increases by 19.2 days with unit increase (1 m) of the ground depth. The phase difference of about 180 days (half a year) implies completely inverse relationship between the air temperature and the ground temperature, which would be attained at a depth of 9.6 m in this case. At this depth, the annual tem- perature variation would be 0.78°C (see Fig. 3a). Intu- itively, the complete inverse relationship between the air temperature and the ground temperature appears the most promising for application of the geothermal heat pumps
(especially ground-coupled types; Lee and Hahn, 2006) because the higher is the ground temperature, the better is the efficiency of the system in the winter and vice versa in the summer (i.e., COP; Hahn et al., 2004; Yasukawa et al., 2004; Lee et al., 2006). However, the minimum annual tem- perature variation (in this case 0.78°C) would mask the ben- efit of the attained lag times. But the stable ground temperature would maximize efficiency of the system maintenance because the system is initially optimized to a certain specific ground or groundwater temperature (Lee and Hahn, 2006).
3.2. Groundwater Temperatures
Figure 4 shows spatial distribution of mean annual ground- water temperatures in the metropolitan city. The mean tem- peratures ranged between 12°C and 19°C (average = 15°C).
In the Joongrangcheon region, some higher mean temper- atures were found. Superficially the mean temperatures in the upper half of the city (above the Han River) appear higher than those in the lower half region but the difference is not statistically significant (p<0.05). Consequently the spa- tial distribution does not show any interpretable geograph- ical implication.
Monthly mean groundwater temperatures are presented in Figure 5. Apparently the monthly mean temperatures are much similar to the ambient air temperatures without any significant lag time. The temperatures are the highest in the summer (August
−September) and they are the lowest in the winter (December
−February). This is very different from the variation behavior of the groundwater temperatures obtained from the Korean NGMSs (Lee and Hahn, 2006; Lee et al., 2006). In the NGMSs, a large proportion of the shallow and deep monitoring wells showed substantial phase differences of 4-8 months compared with the air temperatures. The objective of the NGMSs was to monitor long-term variation of groundwater quantity (water level) and quality through- out the whole country. Consequently, substantial numbers of the NGMSs are located in areas where artificial or anthropogenic effects are hardly to reach and corresponding proportion of them showed natural and typical groundwater temperature variation with season (Lee and Hahn, 2006).
However, the groundwater (or groundwater temperature) of the Seoul metropolitan city is expected to be influenced by various human activities with varying degree (e.g., BSDUD, 1999; Kinouchi, 2003; Ferguson and Woodbury, 2004).
Somewhat elevated groundwater temperatures of the city may reflect effects of artificial origin including air temper- atures or warm water leaked from various sources in the metropolitan city (i.e., heat island effect; Song, 2004). Nev- ertheless, the median values (15.0
°C) and ranges of the first (14.5
°C) and third quartiles (around 15.7
°C) were nearly the same throughout the year (2001). The most stable tem- peratures are very beneficial for extracting heat from the
Fig. 3.
Vertical profile of annual ground temperatures variation
(maximum-minimum temperatures) (a) and time shift with depth (b).
groundwaters (Woo, 2003).
Temperatures of most groundwater wells are very stable showing minimal annual amplitude of variation (Table 3).
Over 70% of the wells showed an annual temperature vari- ation less than 1
oC and about 80% showed the variation within 2°C. Only 6% showed the variation greater than 5°C.
Figure 6 shows temperature time series at some selected wells showing noticeable seasonal variation. Although the varia- tion appeared very different each other and somewhat irreg- ular or even erratic, some general trends may be observed.
The groundwater temperatures were low in March-July (warm or hot season) while they were high in September-December (cool or cold season). This means some phase differences of a few months compared with the air temperatures. The groundwater temperatures of these wells showed high cor- relation with the air temperatures with some lag times (Table 4) while the other wells did not any substantial cor- relation (data not shown).
Considering the phase differences (time shifts) observed from the cross-correlation between the air temperature and
Fig. 4.
Spatial distribution of annual mean groundwater temperatures for 2001.
Fig. 5.
Variation of monthly mean
groundwater temperatures.
the ground temperature (see Fig. 3b), rather small time shifts (21
−84 days) of the groundwater temperatures at the monitoring wells (Nos.: 8, 28, 56, 106) appeared unexpected.
Some longer time shifts were initially expected because the monitoring depths are relatively deep (average=36.2 m), the mean water levels (depths to water) were not very shallow (average=17.2 m, bgs) except for the well, no. 8, and the time shift of the ground temperature was 89 days at the depth of 5 m (see Fig. 3b). As expected, the values of the
Table 3.
Annual variation (maximum-minimum) of groundwater temperatures.
Annual variation No. of wells Proportion (%) Cumulative (%)
<1 ° C 84 70.6 70.6
1
−2 ° C 10 8.4 79.0
2
−3 ° C 7 5.9 84.9
3
−5 ° C 11 9.2 94.1
>5 ° C 7 5.9 100.0
Fig. 6.
Groundwater temperature variation at some selected wells (see Table 4 for detailed information on the stations).
Table 4.
Cross-correlation between air temperature and groundwater temperature for some selected monitoring wells.
Well no. Peak correlation Time shift
*(days) Mean W.L. (m, bgs) Monitoring depth (m) Mean water column (m)
18 0.780 50 12.38 21.01 18.62
28 0.777 84 10.15 34.51 24.35
47 0.704 1111 16.21 71.11 64.89
56 0.816 21 34.49 44.95 10.46
1061 0.789 63 17.10 44.21 37.10
1181 0.682 1141 13.90 30.51 26.60
*
Phase difference at which the peak cross-correlation is attained
peak correlation are closely negatively related to the time shifts (r
2=0.85; see Table 4). The peak correlations (r
2=0.05) and the time shifts (r
2=0.08) are not considerably related to the measuring depths (probe locations below ground sur- face). Both the correlations and the time shifts are mean- ingfully related to the mean water levels and the lengths of water column above the measuring probe (r
2=0.33
−0.46).
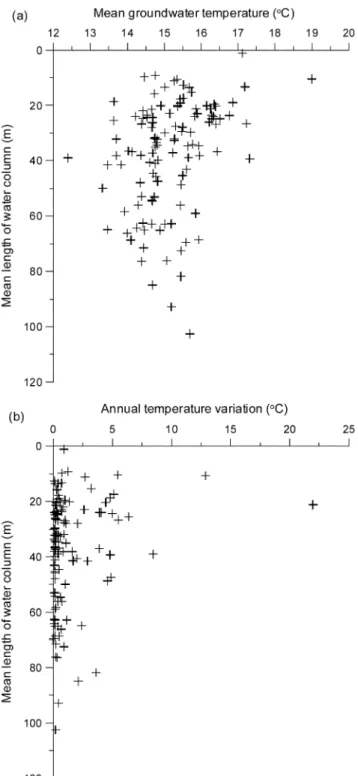
The examination was extended to all the monitoring wells.
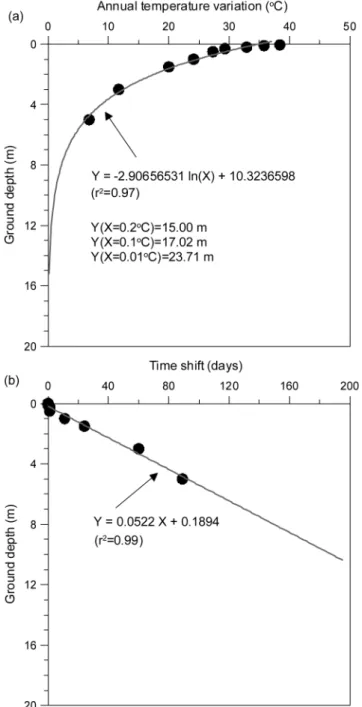
Figure 7 shows distribution of the annual mean ground- water temperatures and the annual temperature variation with the measurement depths. The mean groundwater tem- peratures show a slightly decreasing trend with the mea- suring depth but the negative correlation is not statistically large (r=-0.21, p=0.009). Also the annual variation of the
Fig. 7.
Mean groundwater temperatures (a) and annual variation (b) with measuring depth.
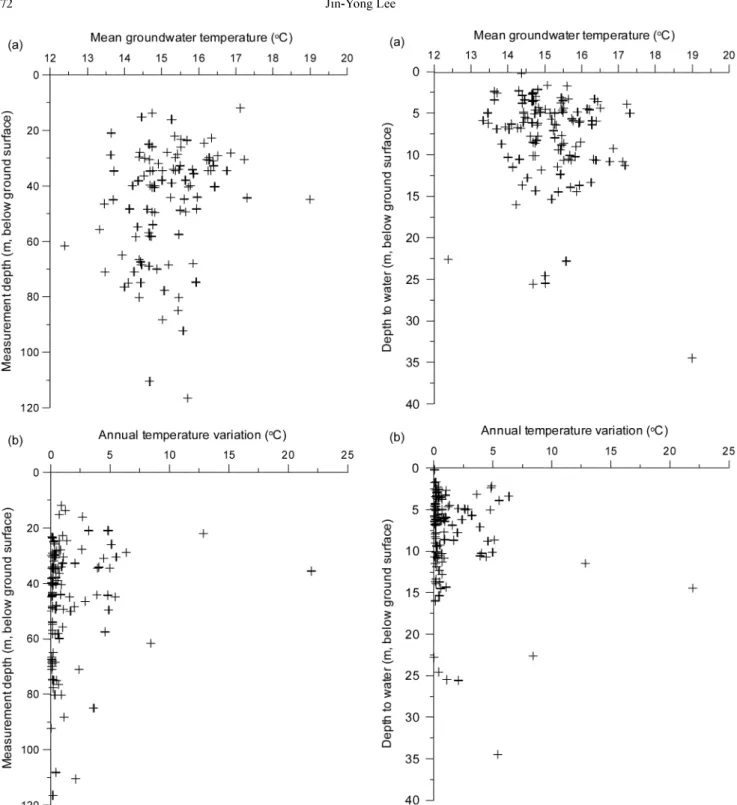
Fig. 8.
Relationship between depth to water and groundwater tem-
peratures (a) and annual variation (b).
groundwater temperatures was not largely correlated with the measuring depth (r=-0.14, p=0.146). Figure 8 shows relation between the water levels (depth to water below ground surface), and the mean groundwater temperature and annual temperature variation. The water levels showed some erratic positive correlation with the mean temperatures although the relation is not statistically significant (r=0.19, p=0.038). In addition, the water levels do not show any sub-
stantial correlation with the annual temperature variation (r=0.15, p=0.028). Figure 9 shows correlation of the mean lengths of the water column above the measuring point with the mean groundwater temperatures and the annual variation. The mean groundwater temperature is negatively correlated with the water column length (r=-0.30, p=0.001) and the annual variation is also negatively correlated to the water column length (r=-0.24, p=0.035).
Among the three variables (the measuring depth, the water level, and the water column length), the water column length appeared the most important factor influencing the annual mean groundwater temperatures and the annual vari- ation. It may reflect relatively fast heat transfer from the ambient air in the monitoring well to the groundwater near the water table instead of heat conduction through the sur- rounding soil, which is also evidenced by the smaller phase differences with the air temperature (see Table 4). So the previous spatial distribution of the mean groundwater tem- peratures may be also related to this water column length and so the observed groundwater temperatures in the mon- itoring wells may be only apparent temperatures.
3.3. Engineering Implications for Geothermal Heat Pumps In the above, some characteristics of the ground and groundwater temperatures in the metropolitan city were examined. With minimal variations, the ground tempera- tures at the depth of 3.0-5.0 m are stably maintained around 15°C throughout the year. Below 15 m, the ground tem- perature would not be affected by the air or near surface temperature. Furthermore, the groundwater levels are very shallow (average±standard deviation=7.91±5.49 m) and the groundwater temperatures are also very stable near 15°C.
All these hydrogeologic conditions are promising for the geothermal heat pumps.
In densely populated metropolitan area like Seoul, there does not exist sufficient space for horizontal ground-cou- pled (close loop) system (Meng, 2003). Even in the vertical loop system, 1 ton (3,517 W) requires 0.0254 m (1 inch) vertical hole of 50 m depth, in which U shape or coaxial typed heat exchange pipe is installed (Hahn et al., 2004).
1 RT (simply ton) is can be the power required to cool 1 short ton of water by 1°F every 10 minutes. In consider- ation of long maintenance of the system, the distance of 5 m between the vertical pipes should be maintained and consequently in case of 5 tons building (17,585 W), at least ground surface area of 5 m × 25 m is required (Woo, 2003).
Furthermore thickness of unconsolidated soil layers in most metropolitan area is less than 5 m except for the surround- ings of the Han River (Kim, 2000; Lee et al., 2005), which increase the installation costs. These practical limitations would restrict widespread installation of the ground-cou- pled systems in the metropolitan area.
Under some conditions, groundwater (open loop) systems
Fig. 9.