• 검색 결과가 없습니다.

MicroRNA-200a/210 Controls Proliferation and Osteogenic Differentiation of Human Adipose Tissue Stromal Cells

N/A
N/A
Protected

Academic year: 2021

Share "MicroRNA-200a/210 Controls Proliferation and Osteogenic Differentiation of Human Adipose Tissue Stromal Cells"

Copied!
16
0
0

로드 중.... (전체 텍스트 보기)

전체 글

(1)

MicroRNA-200a/210 Controls Proliferation and Osteogenic Differentiation of Human Adipose Tissue Stromal Cells

Young Suk Kim

1

, Hee Jeong Park

1

, Keun Koo Shin

1

, Sun Young Lee

1

, Yong Chan Bae

2

and Jin Sup Jung

1

*

1

Department of Physiology, School of Medicine, Pusan National University, Yangsan 626-870, Korea

2

Department of Plastic Surgery, School of Medicine, Pusan National University, Busan 602-739, Korea Received May 2, 2017 /Revised July 10, 2017 /Accepted July 18, 2017

MicroRNAs control the differentiation and proliferation of human adipose tissue–derived stromal cells (hADSCs). However, the role of miR-200a and miR210 on the osteogenic differentiaton of hADSCs has not been determined. hADSCs were isolated from human adipose tissues. Direct binding of mircoRNA to target mRNAs was determined by luciferase assay of the constructs containing putative microRNA binding sites within 3' untranslated region of target mRNAs. Overexpression of miR-200a increased the proliferation and osteogenic differentiation of hADSCs, while causing downregulation of the levels of ZEB2. Inhibition of miR-200a with antisense RNAs inhibited the proliferation and os- teogenic differentiation of hADSCs. Overexpression of miR-210 was found to inhibit the proliferation of hADSCs but increase the osteogenic differentiation, while causing downregulation of the levels of IGFBP3. Inhibition of miR-210 with antisense RNAs increased the proliferation but inhibited the osteo- genic differentiation of hADSCs. Analysis of the luciferase activity of the constructs containing the miR-200a target site within the ZEB2 3’ region and the miR-210 target site within the IGFBP3 3’ region revealed lower activity in the miR-200a- or miR-210-transfected hADSCs than in control miRNA-trans- fected hADSCs. Downregulation of ZEB2 or IGFBP3 in the hADSCs showed similar effects on both their proliferation and osteogenic differentiation with that of miR-200a and miR-210 overexpression, respectively. The results of the current study indicate that miR-200a and miR-210 regulate the osteo- genic differentiation and proliferation of hADSCs through the direct targeting of IGFBP3 and ZEB2, respectively.

Key words : hADSC, miR-200a, miR-210, osteogenic differentiation, proliferation

*Corresponding author

*Tel : +82-51-510-8071, Fax : +82-51-510-8076

*E-mail : jsjung@pusan.ac.kr

This is an Open-Access article distributed under the terms of the Creative Commons Attribution Non-Commercial License (http://creativecommons.org/licenses/by-nc/3.0) which permits unrestricted non-commercial use, distribution, and reproduction in any medium, provided the original work is properly cited.

Journal of Life Science 2017 Vol. 27. No. 7. 767~782 DOI : https://doi.org/10.5352/JLS.2017.27.7.767

Introduction

miRNAs have been shown to be involved in diverse bio- logical processes including differentiation [37], proliferation, apoptosis [3], metabolism [43] and neuronal patterning [13].

Members of the miR-200 family have been shown to pro- mote the mesenchymal-epithelial transition (MET), and to activate the differentiation of pancreatic [19] and breast can- cer cells [1] into epithelial cells. miR-200a has tumor sup- pressive functions in a wide range of cancers, including neu- roblastoma cells[8] and breast cancer [1, 25, 39] through the targeting of AP-2γ [8], phospholipase C gamma 1 (PLCG1) [39], and mitochondrial transcription factor A (TFAM) [25].

In contrast, miR-200a has also been reported to promote cell proliferation by targeting phosphatase and tensin homolog (PTEN) in 293T and SH-SY5Y cells [21]. miR-200a was also found to suppress the differentiation of mouse embryonic stem (EC) cells into endoderm and mesoderm [24], control the differentiation of neural progenitor cells [31], and main- tain the epithelial cell phenotype in mammary glands [27].

The induction of miR-210 expression under normoxic and/or hypoxic conditions results in the regulation of mi- tochondrial metabolism [32], angiogenesis [46], DNA repair [12], and cell survival, migration and differentiation [6].

Increased expression of miR-210 has been observed in vari- ous cancers, including carcinoma of nasopharyngeal epi- thelial cells [11], colon and breast cancer [26]. In addition to its hypoximir role, miR-210 also promoted both osteo- blastic [26] and adipocyte [23] differentiation. Several targets of miR-210 have been identified, including E2F3 [9], MYC antagonist (MNT) [47], ephrin-A3 (EFNA3) [33], and iron-sul- fur cluster scaffold protein (ISCU) [4].

Adipose tissue, like bone marrow, is a mesodermally-de-

(2)

rived organ with a stromal cell population. Adipose tissue stromal cells (ADSCs) shares many of the characteristics of bone marrow derived mesenchymal stem cells (BMSCs), in- cluding extensive proliferative potential and the ability to differentiate toward adipogenic, osteogenic, chondrogenic, and myogenic lineages. Our laboratory has reported several miRNAs which control the proliferation and differentiation of hADSCs [17, 18, 36].

In the current study, we examined the role of miR-200a and miR-210 in the proliferation and osteogenic differ- entiation of hADSCs. The data obtained herein indicated that miR-200a increases the proliferation of hADSCs and osteo- genic differentiation by binding to specific target sequences in the ZEB2 mRNA 3’ untranslated region (UTR), and that miR-210 inhibits the proliferation of hADSCs while increas- ing osteogenic differentiation by binding to specific target sequences in the IGFBP3 mRNA 3’ UTR.

Materials and Methods

Cell culture

All protocols involving human subjects were approved by the Institutional Review Board of Pusan National Univer- sity. Superfluous materials were collected from four in- dividuals undergoing elective abdominoplasty after in- formed consent was given by each individual. The hADSCs were isolated according to the methods described previously [29]. The hADSCs were maintained in α-DMEM with 10%

fetal bovine serum, 100 μg/ml streptomycin and 100 mg/ml penicillin in a 5% CO2 environment at 37℃.

Adipogenic and osteogenic differentiation

Adipogenic differentiation was induced by culturing the hADSCs for 10 days in an adipogenic differentiation me- dium (AM; 10% FBS, 1 μMdexamethasone, 0.5 mM/ml 3-iso- butyl-1-methylxanthine and 200 μM indomethacin in α- MEM), and was assessed by the use of Oil Red O stain as an indicator of intracellular lipid accumulation. In order to obtain quantitative data, 500 μl of isopropyl alcohol was add- ed to the stained culture dish. The absorbance of the extracted dye from the stained dishes was determined at 500 nm.

Osteogenic differentiation was induced by culturing of the cells for 14 days in osteogenic medium (OM; 10% FBS, 0.1 mM dexamethasone, 10 mM β-glycerophosphate, and 50 mM ascorbic acid in α-MEM). Extracellular matrix calcifica- tion was then estimated by treatment with 2% Alizarin red S with a pH of 4.3(Sigma-Aldrich, MO, USA) for 15 minutes.

To obtain quantitative data, 300 μl 10%(w/v) cetylpyr- idinium chloride (CPC, Sigma-Aldrich, MO, USA) and 10 mM sodium phosphate (pH 7.0) solution was added to the stained dishes, and the absorbance of the extracted dye was determined at 562 nm.

Quantitation of mineral formation

For the calcium deposition assay, cultures were washed twice with PBS. Mineral was then collected after dissolution with 500 μl of 0.5 N hydrocholoric acid at room temperature overnight and the samples assayed the following day.

Incorporation of calcium in the extracellular matrix was quantified using a commercial diagnostic kit (Quantichrom calcium assay kit, DICA-500; Bio Assay Systems, Hayward, CA, USA), in accordance with the manufacturer’s instructions.

Absorbance was compared with curves prepared using standard solutions of calcium. Calcium deposition was ex- pressed as mM per well of tissue culture 12-well plates.

Evaluation of cell proliferation

hADSCs were transfected with miRNA or siRNA. After incubation for 48 hr, the cells were detached and plated in 6 well plates at a density of 2×10

4

cells/well. The number of cells was then counted on the indicated days with a Countess®

Automated Cell Counter (Invitrogen, Carlsbad, CA, USA).

Real-time polymerase chain reaction (PCR) Total RNA was extracted using Trizol (Invitrogen), ac- cording to the manufacturer’s instructions, and cDNA syn- thesis was performed using Reverse Transcriptase M-MLV (Promega, Madison, WI, USA). GUSB (β-D-glucuronidase) was used as an internal control for expression analysis. The sequences of the primers used in the experiment were as follows: IGFBP-3 FW, 5’-GGGGTGTACACATTCCCAAC-3’

and RV, 5’-AGGCTGCCCATACTTATCCA-3’; ZEB-2 FW, 5’-ACTCCTGTCTGTCTCGCAAA-3’ and RV, 5’-GCTCGAT AAGGTGGTGCTTG-3’; GUSB FW, 5’-GCGTCCCACCTAG AATCTGC-3’ and RV, 5’-CATACGGAGCCCCCTTGTC-3’;

ALP (Alkaline phosphatase) FW, 5’-CCACGTCTTCACAT TTGGTG-3’ and RV, 5’-AGACTGCGCCTGGTAGTTGT-3’;

OC (Osteocalcin) FW, 5’-GTGCAGAGTCCAGCAAAGGT-3’

and RV, 5’-TCAGCCAACTCGTCACAGTC-3’; OPN (Osteo-

pontin) FW, 5’-TTGCAGTGATTTGCTTTTGC-3’ and RV, 5’-

ACACTATCACCTCGGCCATC-3’; RUNX2 FW, 5’-CTCACT

ACCACACCTACCTG-3’ and RV, 5’-TCAATATGGTCGCCA

AACAGATTC-3’. For miRNA quantitative RT-PCR (qPCR),

small RNA species enriched RNA isolation was performed

(3)

as per the manufacturer’s instructions (mirVana miRNA iso- lation kit; Ambion, Austin, TX, USA). The miRNA was re- verse-transcribed using the Ncode miRNA first-strand cDNA synthesis kit (Invitrogen). The forward primer sequences were designed as the sequences of the corresponding mature miRNA, and 5S rRNA was used as a normalizing control.

The miR-210 and miR- and miR-200a-specific forward pri- mer sequences were designed on the basis of the miRNA sequences obtained from the miRBase database. qPCR was performed using Power SYBR Green PCR Master Mix on the ABI 7500 Instrument (Applied Biosystems, Warrington, UK). The relative standard curve method was applied for analysis of the data.

Western blot analysis

Samples were homogenized in RIPA buffer (Sigma, St.

Louis, MO, USA). The isolated proteins were separated by SDS-PAGE and electro-transferred to PVDF membranes (Millipore, Bedford, MA, USA). The blots were probed with primary antibodies, followed by HRP-conjugated secondary antibodies. The following antibodies were used: IGFBP-3, from Abcam (Cambridge, MA); ZEB-2, from Santa Cruz Biotechnology (Dallas,TX,USA); GAPDH, from Cell Signaling Technologies (Boston, MA). Bound antibodies were detected using an ECL detection kit (Pierce Biotechnology, Rockford, IL, USA) and visualized using an LAS 3000 Luminoimage Analyzer (Fujifilm, Tokyo, Japan). The protein levels were quantified using ImageJ software from the National Institutes of Health.

miRNA/ siRNA transfection

hADSCs were seeded with complete medium without antibiotics. On the following day, the cells were transfected with 20 nM of miRNAs (miR-210, 200a mimics or inhibitors, Dharmacon, Thermo Scientific, Epsom, UK), 100 nM of siRNA (on-TARGET plus SMART pool, Dharmacon) target- ing IGFBP-3, and 10 nM of si-RNA (TriFECTaTM Dicer- Substrate RNAi,IDT) targeting ZEB-2 using DharmaFECT Transfection Reagent I (Dharmacon), according to the manu- facturer’s protocol. As a negative control, transfection was carried out with control miRNA or non-targeting siRNA.

Microarray analysis

Total RNA was extracted with TRIzol (Invitrogen) and purified using RNeasy columns (Qiagen, Hilden, Germany) according to the manufacturer’s instructions. Microarray analysis was carried out by Macrogen Inc (Seoul, Korea).

Briefly, biotinylated complementary RNAs were amplified and purified using the Ambion Illumina RNA amplification kit (Ambion) according to the manufacturer’s instructions.

Labeled cRNA samples were hybridized to each human HT-12 expression v.4 bead array according to the manu- facturer’s instructions (Illumina, SanDiego, CA, USA). Detec- tion of array signal was carried out using Amersham fluo- roLink streptavidin-Cy3 (GE Healthcare Bio-Sciences, Uppsala, Sweden). Arrays were scanned with an Illumina bead array Reader confocal scanner, and the raw data were extracted using the software provided by the manufacturer (Illumina GenomeStudio v2011.1 (Gene Expression Module v1.9.0)).

Reporter vectors and DNA constructs

The putative miR-200a-recognition element (as a single copy) from the ZEB2 gene was cloned into the 3’-untranslated region (UTR) of the firefly luciferase reporter vector (pMIR- Report, Ambion), according to the manufacturer’s specified guidelines. The oligonucleotide sequences were designed to carry HindIII and SpeI sites at their extremities, facilitating ligation into the HindIII and SpeI sites of pMIR-Report (Ambion). The oligonucleotides used herein were as follows:

pMIR-ZEB2 FW, 5’-CTAGT TTACCTTTGCACCAGCTTCAG TGTTAA-3’ and RV, 5’-AGCTT TAACACTGAAGCTGGTG CAAAGGTAAA-3’; pMIR-ZEB2-mut FW, 5’-CTAGT TTCC CTGGGCCCAATCTTCCGGGGTCA-3’ and RV, 5’-CTAGT TTCCCTGGGCCCAATCTTCCGGGGTCA-3’.

The putative miR-210-recognition element (as a single copy) from the IGFBP-3 gene was cloned into the 3’-untrans- lated region (UTR) of the firefly luciferase reporter vector (pMIR-Report, Ambion), according to the manufacturer’s specified guidelines. The oligonucleotide sequences were de- signed to carry HindIII and SpeI sites at their extremities, facilitating ligation into the HindIII and SpeI sites of pMIR-Report (Ambion). The oligonucleotides used herein were as follows: pMIR-IGFBP-3 FW, 5’-CTAGTCCACTCCC CGTACAGTGCGCACAG A-3’ and RV, 5’-AGCTTCTGTG CGCACTGTACGGGGAGTGG A-3’; pMIR-IGFBP-3-mut FW, 5’-CTAGTCCACTACTCCTAGATTGCACATAAA-3’ and RV, 5’-AGCTTTTATGTGCAATCTAGGAGTAGTGGA -3’.

Reporter gene assay

All transient transfections were conducted using Lipofect-

amine Plus Reagent (Invitrogen). The pMIR-IGFBP-3 and

pMIR-β-gal plasmids were used as reporter constructs. Cells

were harvested 48 hr after transfection, lysed in Report Lysis

buffer, and subsequently assayed for luciferase activity

(4)

(Luciferase Assay System, Promega). Each transfection was performed in duplicate, and all experiments were repeated several times. The luciferase activity was normalized accord- ing to the β-galactosidase activity.

Statistical analysis

All results are presented as the means ± SEM. Compar- isons between groups were carried out via t-tests (2-sided) or ANOVA for experiments with more than 2 subgroups.

Post hoc range tests and pairwise multiple comparisons were conducted using the t-test (2-sided) with Bonferroni adjustments. Probability values of p<0.05 were considered statistically significant.

Results

Effects of miR-200a overexpression on the differ- entiation and proliferation of hADSCs

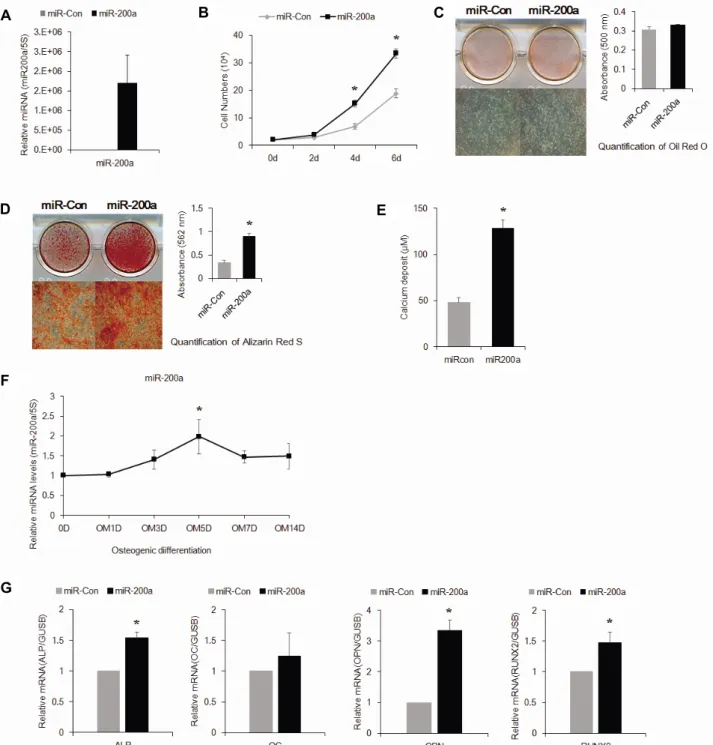
To examine the role of miR-200a in hADSCs function, miR-200a mimics were transfected into hADSCs for over- expression of miR-200a. Real-time PCR analysis confirmed that the miR-200a-transfected hADSCs had increased levels of miR-200a expression (Fig. 1A). To test the effects of miR-200a on hADSCs proliferation, miR-200a-transfected hADSCs were plated in culture plates and the number of cells was counted on specific days. The cell-counting experi- ment demonstrated that the miR200a-transfected cells grew faster compared to the control miR-transfected cells (Fig. 1B).

When adipogenic differentiation was induced with the ap- propriate media, miR-200a-overexpression did not show a significant effect on adipogenic differentiation compare with that observed in control-miRNA transfected cells at 10days after induction (Fig. 1C). In contrast, miR-200a-overexpres- sion significantly increased the osteogenic differentiation of hADSCs compared with that of control miR-transfected cells after incubation of hADSCs for 14 days in osteogenic differ- entiation media (Fig. 1D, Fig. 1E). Next, to examine the role of miR-200a in the osteogenic differentiation of hADSCs, the level of miR-200a expression during osteogenic differ- entiation was determined by real-time PCR analysis. The re- sult showed that miR-200a expression was increased 14 days after the induction of osteogenic differentiation in normal hADSCs (Fig. 1F). Real-time PCR was then employed to de- termine whether the overexpression of miR-200a caused in- creased expression of osteogenesis-related genes. The results revealed that miR-200a-overexpressing hADSCs had higher

levels of ALP, OC, OPN and RUNX2 expression than the control microRNA-transfected cells (Fig. 1G).

Effects of miR-210 overexpression on the differ- entiation and proliferation of hADSCs

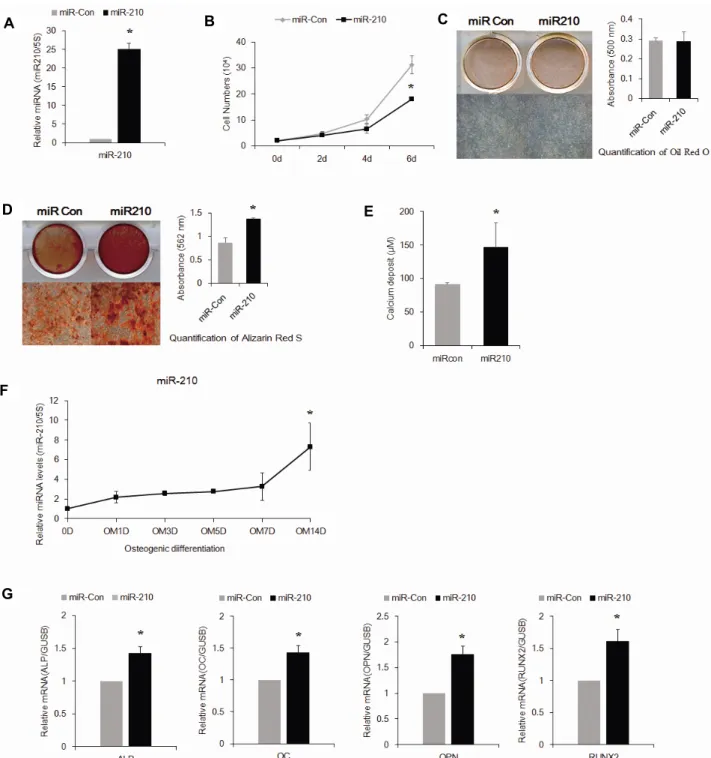
To examine the role of miR-210 in hADSCs function, miR-210 mimics were transfected into hADSCs for the over- expression of miR-210. Real-time PCR analysis confirmed that miR-210-transfected hADSCs had increased levels of miR-210 expression (Fig. 2A). To test the effects of miR-210 on hADSCs proliferation, miR-210-transfected hADSCs were plated in culture plates and the number of cells was counted on specific days. The miR210-transfected cells were found to display slower growth than the control miR-transfected cells (Fig. 2B). Incubation of the hADSCs for 10days in adipo- genic medium showed no significant differences in adipo- genic differentiation between the miR-210-overexpressing and control-miRNA transfected cells (Fig. 2C). In contrast, after incubation of the hADSCs for 14 days in osteogenic medium, miR-210-overexpression was found to significantly increase the osteogenic differentiation of hADSCs compared with that of the control-miRNA transfected cells (Fig. 2D, Fig. 2E). Next, to examine the role of miR-210 in the osteo- genic differentiation of hADSCs, the level of miR-210 ex- pression during osteogenic differentiation was determined by real- time PCR analysis. The results showed that the ex- pression of miR-210 was increased 14 days after the in- duction of osteogenic differentiation in normal hADSCs (Fig.

2F). Real-time PCR was then utilized to determine whether the miR-210 overexpression resulted in increased expression of osteogenesis-related genes. The results revealed higher levels of ALP, OC, OPN and RUNX2 expression in the miR- 210-overexpressing cells compared to control microRNA- transfected cells (Fig. 2G).

Effect of miR-200a inhibition on the differentia- tion and proliferation of hADSCs

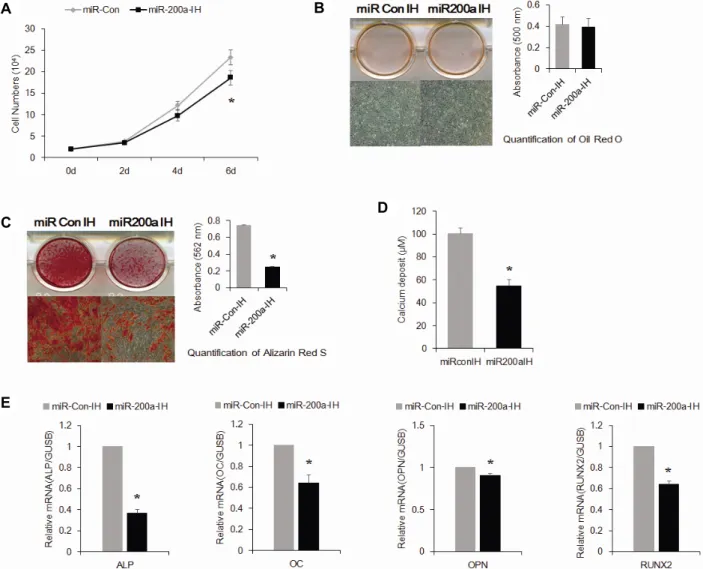
To investigate the effects of miR-200a inhibition on the

differentiation of hADSCs, hADSCs were transfected with

a specific miRNA inhibitor (miR-200a-IH). The cell-counting

experiment revealed that miR-200a-IH reduced hADSCs pro-

liferation compared with the control oligonucleotide-trans-

fected cells (Fig. 3A). To examine the effects of miR-200a

inhibition on adipogenic and osteogenic differentiation, miR-

200a-IH-transfected hADSCs were induced to differentiate

into adipogenic and osteogenic lineages. The miR-200a-IH-

(5)

A B C

D E

F

G

Fig. 1. Overexpression of miR-200a increases osteogenic differentiation and proliferation of hADSCs. (A) miR-200a levels were de-

termined in mimic control- (miR-con) or mimic miR-200a-transfected hADSCs using real-time PCR. (B) hADSCs proliferation

was determined by direct cell counting after oligonucleotide transfection. (C) Oligonucleotide-transfected hADSCs were grown

for 2 days, and then adipogenic differentiation was induced for 7 days after reaching 80-90% confluence. Differentiation

was determined by addition of Oil Red O solution, which was quantified by measuring the absorbance at 500 nm. (D)

Oligonucleotide-transfected hADSCs were grown for 2 days, and osteogenic differentiation was induced for 14 days after

reaching 80-90% confluence. Differentiation was determined by addition of Alizarin Red S solution, which was quantified

by measuring the absorbance at 562 nm. (E) Determination of calcium deposition at 14 days after induction of osteogenic

differentiation. (F) Osteogenic differentiation of hADSCs was induced for 14 days. miRNA was analyzed at the indicated

times via real-time PCR analysis. (G) Real-time PCR analysis of ALP, OC, OPN and RUNX2 in miR-200a mimic-transfected

undifferentiated cells. Total RNA was isolated at the indicated days after induction of differentiation. Internal controls for

the expression analysis were 5S and GUSB. Data represent the mean ± SEM (n=4). *p<0.05 compared to miR-con-transfected

hADSCs.

(6)

A B C

D E

F

G

Fig. 2. Overexpression of miR-210 increases osteogenic differentiation and inhibits proliferation of hADSCs. (A) miR-210 levels were

determined in mimic control- (miR-con) or mimic miR-210-transfected hADSCs using real-time PCR. (B) hADSCs proliferation

was determined by direct cell counting after oligonucleotide transfection. (C) Oligonucleotide-transfected hADSCs were grown

for 2 days, and adipogenic differentiation was induced for 7 days after reaching 80-90% confluence. Differentiation was de-

termined by addition of Oil Red O solution, which was quantified by measuring the absorbance at 500 nm. (D) Osteogenic

differentiation was induced for 14 days and determined by Alizarin Red S staining for visualization of the intracellular mineral

accumulation, which was quantified by measuring the absorbance at 562 nm. (E) Determination of calcium deposition at

14 days after induction of osteogenic differentiation. (F) Osteogenic differentiation of hADSCs was induced for 14days. miRNA

was measured at the indicated times via real-time PCR analysis. (G) Real-time PCR analysis of ALP, OC, OPN and RUNX2

in the miR-210 mimic-transfected undifferentiated cells. Total RNA was isolated at the indicated days after induction of

differentiation. Internal controls for expression analysis were 5S and GUSB. Data represent the mean ± SEM (n=4). *p<0.05

compared to miR-con-transfected hADSCs.

(7)

A B

C D

E

Fig. 3. Inhibition of miR-200a inhibits osteogenic differentiation and proliferation of hADSCs. (A) hADSCs proliferation was de- termined by direct cell counting after oligonucleotide transfection. (B) Oligonucleotide-transfected hADSCs were grown for 2 days, and adipogenic differentiation was induced for 7 days after reaching 80-90% confluence. Differentiation was determined by addition of Oil Red O solution, which was quantified by measuring the absorbance at 500 nm. (C) Osteogenic differentiation was induced for 14 days and determined by Alizarin Red S solution, which was quantified by measuring the absorbance at 562 nm. (D) Determination of calcium deposition at 14 days after induction of osteogenic differentiation. (E) Real-time PCR analysis of ALP, OC, OPN and RUNX2 in miR-200a-IH-transfeted undifferentiated cells. Total RNA was isolated at the indicated days after induction of differentiation. Internal controls for expression analysis were 5S and GUSB. Data represent the mean ± SEM (n=4). *p<0.05 compared to miR-con-IH transfected hADSCs.

transfected hADSCs showed no significant changes in adipo- genic differentiation compare with the control-miRNA trans- fected cells (Fig. 3B); however, Alizarin Red S staining re- vealed that the inhibition of miR-200a significantly inhibited the osteogenic differentiation of hADSCs (Fig. 3C, Fig. 3D).

To further confirm this effect, the expression of osteogenic differentiation markers was determined using real-time PCR. The results showed that miR-200a-IH transfection in- hibited the expression of the osteogenesis-related genes ALP, OC, OPN and RUNX2 (Fig. 3E).

Effect of miR-210 inhibition on the differentia- tion and proliferation of hADSCs

Next, to investigate the effects of miR-210 inhibition on

the differentiation of hADSCs, hADSCs were transfected

with a specific miRNA inhibitor (miR-210-IH). Transfection

with miR-210-IH was observed to enhance the proliferation

of hADSCs compared with the control oligonucleotide-trans-

fected cells (Fig. 4A). To examine the effects of miR-210 in-

hibition on adipogenic and osteogenic differentiation, miR-

210-IH-transfected hADSCs were induced to differentiate in-

(8)

A B

C

Fig. 4. Inhibition of miR-210 inhibits osteogenic differentiation and increases proliferation of hADSCs. (A) hADSCs proliferation was determined by direct cell counting after oligonucleotide transfection. (B) Oligonucleotide-transfected hADSCs were grown for 2 days, and adipogenic differentiation was induced for 7 days after reaching 80-90% confluence. Differentiation was determined by addition of Oil Red O solution, which was quantified by measuring the absorbance at 500 nm. (C) Osteogenic differentiation was induced for 2 weeks and determined by addition of Alizarin Red S solution, which was quantified by measuring the absorbance at 562 nm. (D) Determination of calcium deposition at 14 days after induction of osteogenic differentiation. (E) Real-time PCR analysis of ALP, OC, OPNand RUNX2 in miR-210-IH-transfected undifferentiated cells.

Total RNA was isolated at the indicated days after induction of differentiation. Internal controls for expression analysis were 5S and GUSB. Data represent the mean ± SEM (n=4). * p<0.05 compared to miR-con-IH transfected hADSCs.

to adipogenic and osteogenic lineages. The miR-210-IH-trans- fected hADSCs showed no significant change in adipogenic differentiation compared with the control-miRNA trans- fected cells (Fig. 4B); however, it was revealed through Alizarin Red S staining that the inhibition of miR-210 sig- nificantly inhibited the osteogenic differentiation of hADSCs (Fig. 4C, 4D). For further confirmation of this effect, the ex- pression of osteogenic differentiation markers was de- termined using real-time PCR. The results showed that miR-210-IH transfection inhibited the expression of the os- teogenesis-related genes ALP, OC, OPN and RUNX2 (Fig. 4E).

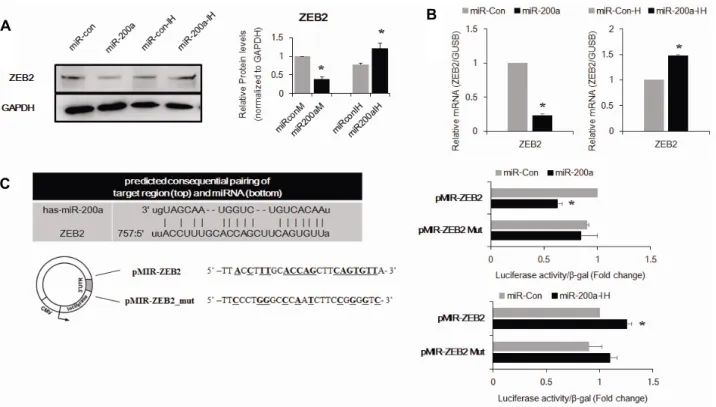
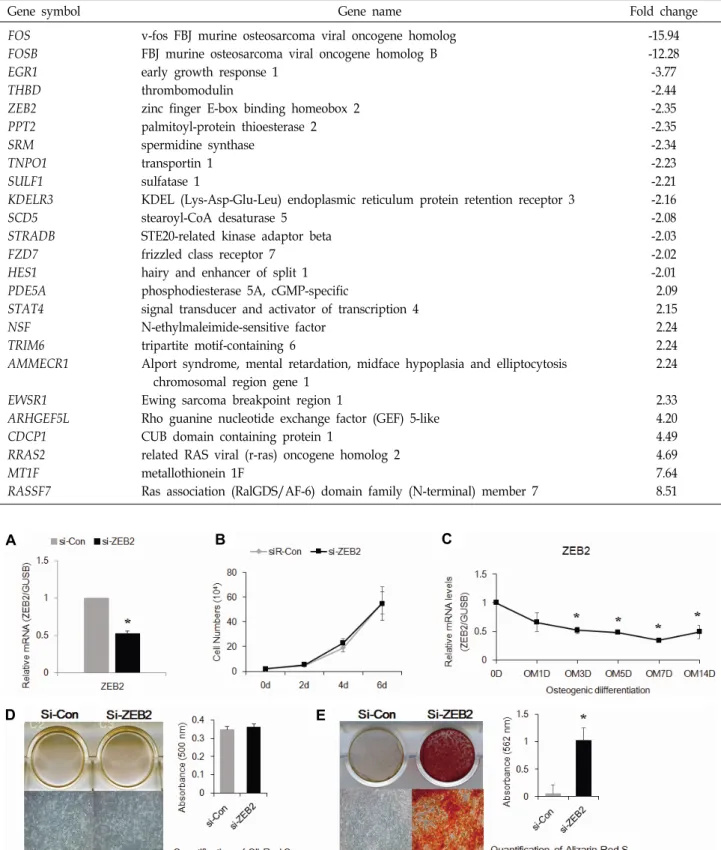
miR-200a targets the 3’UTR of ZEB2 mRNA To determine the potential targets of miR-200a in hADSCs, the miR-200a-induced changes in gene expression profiles were analyzed by microarray (Table. 1). Using the miRWalk database for target gene prediction, ZEB2 was se- lected as a potential target of miR-200a following the de-

tection of its downregulated expression via microarray

analysis. To determine the relationship between miR-200a

and ZEB2, ZEB2 expression was analyzed with real-time

PCR and Western blot analysis in the miR-200a mimic- or

inhibitor-transfected cells. The transfection of a miR-200a

mimic led to a significant decrease in the levels of ZEB2 pro-

tein (Fig. 5A) and mRNA (Fig. 5B) in the hADSCs. Converse-

ly, transfection with the miR-200a inhibitors led to an in-

crease in both ZEB2 protein (Fig. 5A) and mRNA (Fig. 5B)

expression levels. To test whether miR-200a directly targets

ZEB2 in hADSCs, luciferase reporter genes utilizing the

ZEB2 3’UTR with or without mutation at the miR-200a bind-

ing regions were constructed. The results showed a decrease

in the relative luciferase activity when the ZEB2 3’UTR

(pMIR-ZEB2) was transfected into the miR-200a-transfected

hADSCs, while no decrease in the relative luciferase activity

was observed in hADSCs transfected with a mutant ZEB2

3’UTR (pMIR-ZEB2-mut). Conversely, transfection of miR-

(9)

Table 1. Gene expression profile of miR-200a-overexpressing hADSCs

Gene symbol Gene name Fold change

FOS FOSB EGR1 THBD ZEB2 PPT2 SRM TNPO1 SULF1 KDELR3 SCD5 STRADB FZD7 HES1 PDE5A STAT4 NSF TRIM6 AMMECR1

EWSR1 ARHGEF5L CDCP1 RRAS2 MT1F RASSF7

v-fos FBJ murine osteosarcoma viral oncogene homolog FBJ murine osteosarcoma viral oncogene homolog B early growth response 1

thrombomodulin

zinc finger E-box binding homeobox 2 palmitoyl-protein thioesterase 2 spermidine synthase

transportin 1 sulfatase 1

KDEL (Lys-Asp-Glu-Leu) endoplasmic reticulum protein retention receptor 3 stearoyl-CoA desaturase 5

STE20-related kinase adaptor beta frizzled class receptor 7

hairy and enhancer of split 1 phosphodiesterase 5A, cGMP-specific

signal transducer and activator of transcription 4 N-ethylmaleimide-sensitive factor

tripartite motif-containing 6

Alport syndrome, mental retardation, midface hypoplasia and elliptocytosis chromosomal region gene 1

Ewing sarcoma breakpoint region 1

Rho guanine nucleotide exchange factor (GEF) 5-like CUB domain containing protein 1

related RAS viral (r-ras) oncogene homolog 2 metallothionein 1F

Ras association (RalGDS/AF-6) domain family (N-terminal) member 7

-15.94 -12.28 -3.77 -2.44 -2.35 -2.35 -2.34 -2.23 -2.21 -2.16 -2.08 -2.03 -2.02 -2.01 2.09 2.15 2.24 2.24 2.24

2.33 4.20 4.49 4.69 7.64 8.51

A B C

D E

Fig. 5. miR-200a targets the 3’UTR of ZEB2 mRNA. (A, B) ZEB2 expression in hADSCs transfected with oligonucleotides was analyzed

by western blot (A) and real-time PCR (B). (C) pMIR-ZEB2 or pMIR-ZEB2-mut luciferase constructs were made according

to the sequences from the miRWalk database. These construct were co-transfected with miR-con, miR-200a-mimic, and

miR-con-IH, or miR-200a-IH into hADSCs. Internal control for expression analysis was GUSB. Data represent the mean ±

SEM (n=4), * p<0.05, compared to miR-con-transfected hADSCs, * p<0.05 compared to miR-Con-IH-transfected hADSCs.

(10)

A B C

D E

F G

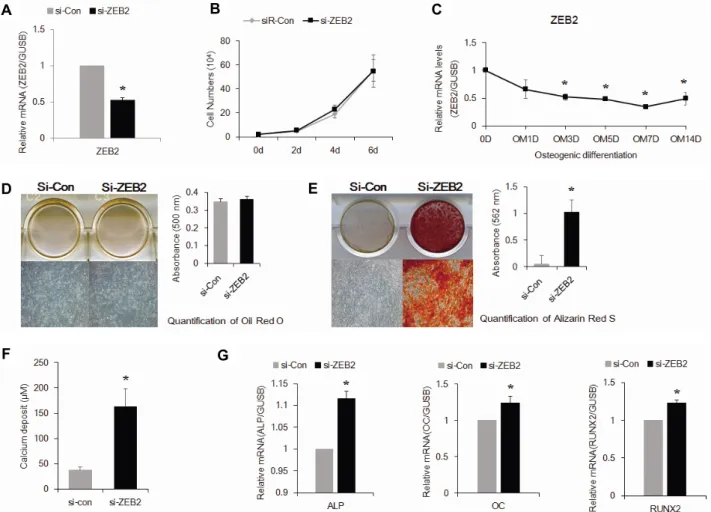
Fig. 6. ZEB2 siRNA increases osteogenic differentiation and inhibits proliferation of hADSCs. (A) ZEB2 mRNA levels were determined in control- (si-con) or ZEB2 oligonucleotide- (si-ZEB2) transfected hADSCs using real-time PCR. Internal control for expression analysis was GUSB. (B) hADSCs proliferation was determined by direct cell counting after siRNA oligo transfection. (C) Osteogenic differentiation of hADSCs was induced for 14 days. The ZEB2 level was measured at the indicated times via real-time PCR analysis. (D) Oligonucleotide-transfected hADSCs were grown for 2 days, and adipogenic differentiation was induced for 7 days after reaching 80-90% confluence. Differentiation was determined by addition of Oil Red O solution, which was quantified by measuring the absorbance at 500 nm. (E) Osteogenic differentiation was induced for 14 days and determined by addition of Alizarin Red S solution, which was quantified by measuring the absorbance at 562 nm. Silencing of the ZEB2 gene increased the osteogenic differentiation of hADSCs. (F) Determination of calcium deposition at 14 days after induction of osteogenic differentiation. (G) Real-time PCR analysis of ALP, OC,and RUNX2 in si-ZEB2-transfected un- differentiated cells. Internal control for expression analysis was GUSB. Data represent mean ± SEM (n=4). * p<0.05 compared with si-con-transfected hADSCs.

200a-IH increased the luciferase activity of pMIR-ZEB2 in hADSCs compared with those transfected with the miRNA control (Fig. 5C).

Effect of ZEB2 siRNA on osteogenic differentia- tion and proliferation of hADSCs

To determine the role of ZEB2 in osteogenic differ- entiation and the proliferation of hADSCs, ZEB2 expression was suppressed using an RNA interference technique through ZEB2 siRNA (si-ZEB2) transfection. Real-time PCR analysis confirmed that si-ZEB2 effectively inhibited the ex-

pression of ZEB2 in hADSCs (Fig. 6A). Direct cell counting

showed that the si-ZEB2-transfected hADSCs showed no sig-

nificant changed proliferation compared to the control cells

(Fig. 6B). To examine the role of si-ZEB2 in the osteogenic

differentiation of hADSCs, the level of ZEB2 expression dur-

ing osteogenic differentiation was determined by real-time

PCR analysis. ZEB2 expression was found to be decreased

during the osteogenic differentiation of normal hADSCs

(Fig. 6C). The adipogenic and osteogenic differentiation of

si-ZEB2-transfected hADSCs was then induced. The si-ZEB2-

transfected hADSCs showed no significant change in adipo-

(11)

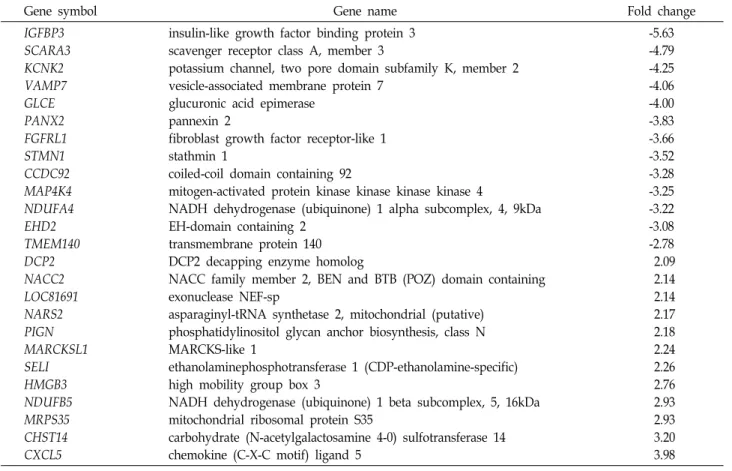
Table 2. Gene expression profile of miR-210-overexpressing hADSCs

Gene symbol Gene name Fold change

IGFBP3 SCARA3 KCNK2 VAMP7 GLCE PANX2 FGFRL1 STMN1 CCDC92 MAP4K4 NDUFA4 EHD2 TMEM140 DCP2 NACC2 LOC81691 NARS2 PIGN MARCKSL1 SELI HMGB3 NDUFB5 MRPS35 CHST14 CXCL5

insulin-like growth factor binding protein 3 scavenger receptor class A, member 3

potassium channel, two pore domain subfamily K, member 2 vesicle-associated membrane protein 7

glucuronic acid epimerase pannexin 2

fibroblast growth factor receptor-like 1 stathmin 1

coiled-coil domain containing 92

mitogen-activated protein kinase kinase kinase kinase 4

NADH dehydrogenase (ubiquinone) 1 alpha subcomplex, 4, 9kDa EH-domain containing 2

transmembrane protein 140 DCP2 decapping enzyme homolog

NACC family member 2, BEN and BTB (POZ) domain containing exonuclease NEF-sp

asparaginyl-tRNA synthetase 2, mitochondrial (putative) phosphatidylinositol glycan anchor biosynthesis, class N MARCKS-like 1

ethanolaminephosphotransferase 1 (CDP-ethanolamine-specific) high mobility group box 3

NADH dehydrogenase (ubiquinone) 1 beta subcomplex, 5, 16kDa mitochondrial ribosomal protein S35

carbohydrate (N-acetylgalactosamine 4-0) sulfotransferase 14 chemokine (C-X-C motif) ligand 5

-5.63 -4.79 -4.25 -4.06 -4.00 -3.83 -3.66 -3.52 -3.28 -3.25 -3.22 -3.08 -2.78 2.09 2.14 2.14 2.17 2.18 2.24 2.26 2.76 2.93 2.93 3.20 3.98 genic differentiation compared with the control-miRNA

transfected cells (Fig. 6D); however, Alizarin Red S staining and calcium deposition assay and real-time PCR analysis of the osteogenic differentiation markers indicated that the downregulation of ZEB2 enhanced the osteogenic differ- entiation of hADSCs (Fig. 6E, Fig. 6F, Fig. 6G).

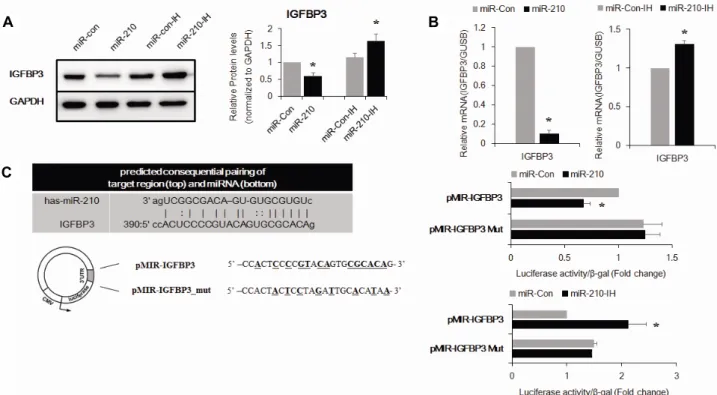
miR-210 targets the 3’UTR of IGFBP3 mRNA To determine the potential targets of miR-210 in hADSCs, the miR-210-induced changes in gene expression profiles were analyzed by microarray (Table 2). Using the miRWalk database for target gene prediction, IGFBP3 was selected as a potential target of miR-210 following observation of the downregulated expression via microarray analysis. To de- termine the relationship between miR-210 and IGFBP3, IGFBP3 expression was analyzed with real-time PCR and western blot analysis in miR-210 mimic- or miR-210 in- hibitor-transfected cells. The transfection of a miR-210 mimic led to a significant decrease in the level of IGFBP3 protein (Fig. 7A) and mRNA (Fig. 7B) in the hADSCs. Conversely, the transfection of miR-210-IH led to an increase in the ex- pression levels of both IGFBP3 protein (Fig. 7A) and mRNA

(Fig. 7B). To test whether miR-210 directly targets IGFBP3 in hADSCs, luciferase reporter genes containing the IGFBP3 3’UTR with or without mutation at the miR-210 binding re- gions were constructed. The results showed a decrease in the relative luciferase activity when the IGFBP3 3’UTR (pMIR-IGFBP3) was transfected into miR-210-transfected hADSCs, while no decrease was observed upon transfection with a mutant IGFBP3 3’UTR (pMIR-IGFBP3-mut). Con- versely, transfection of miR-210-IH increased the luciferase activity of pMIR-IGFBP3 in hADSCs compared with trans- fection of the miRNA control (Fig. 7C).

Effect of IGFBP3 siRNA on osteogenic differentia- tion and proliferation of hADSCs

To determine the role of IGFBP3 in the osteogenic differ-

entiation and proliferation of hADSCs, IGFBP3 expression

was suppressed in with an RNA interference technique

through transfection with IGFBP3 siRNA (si-IGFBP3). Real-

time PCR analysis confirmed that si-IGFBP3 effectively in-

hibited the expression of IGFBP3 in hADSCs (Fig. 8A). Direct

cell counting showed that the si-IGFBP3-transfected hADSCs

exhibited less proliferation than control cells (Fig. 8B). The

(12)

A B

C

Fig. 7. miR-210 targets the 3’UTR of IGFBP3 mRNA. (A, B) IGFBP3 expression in hADSCs transfected with oligonucleotides was analyzed by Western blot (A) and real-time PCR (B). (C) pMIR-IGFBP3 or pMIR-IGFBP3-mut luciferase constructs were made according to the sequences from the miRWalk database. These construct were co-transfected with miR-con, miR-210-mimic, miR-con-IH, or miR-210-IH into hADSCs. Internal control for expression analysis was GUSB. Data represent the mean ± SEM (n=4), * p<0.05, compared to miR-con-transfected hADSCs, * p<0.05 compared to miR-Con-IH-transfected hADSCs.

level of IGFBP3 expression during osteogenic differentiation was next determined by real-time PCR analysis. The results showed that the expression of IGFBP3 was decreased during the osteogenic differentiation of normal hADSCs (fig. 8C).

To study the effect of IGFBP3 downregulation on the effi- ciency of hADSCs differentiation, the adipogenic and osteo- genic differentiation of si-IGFBP3- transfected hADSCs was induced. The si-IGFBP3-transfection of hADSCs showed no influence on adipogenic differentiation compared with the control-miRNA transfected cells (Fig. 8D); however, Alizarin Red S staining and calcium diposition assay and real-time PCR analysis of the osteogenic differentiation markers in- dicated that the downregulation of IGFBP3 enhanced the os- teogenic differentiation of hADSCs (Fig. 8E, Fig. 8F, Fig. 8G).

Discussion

Our findings show that miR-200a and miR-210 control proliferation and osteogenic differentiation of hADSCs, in- dicating their potential as new targets for modulating MSC functions. The effects of miR-200a and miR-210 on cell pro- liferation vary according to cell type. Although it has been

reported that miR-200 is a tumor suppressor in various can-

cers [5, 8, 25, 39, 42], in this study miR-200a mimic trans-

fection increased hADSCs proliferation. This finding was

consistent with the results that miR-200 increases cell pro-

liferation in endometrial carcinoma and colon cancer cell

lines [21]. miR-210 increases cell proliferation of peripheral

nerve sheath tumor [41], epithelial ovarian cancer [21], hep-

atoma [44], and fibroblasts [2] under hypoxic conditions. In

contrast, miR-210 inhibits proliferation of human esophageal

squamous cell carcinoma [38] and, in human nasophar-

yngeal carcinoma CNE cells [29] and HaCaT (Human im-

mortalized keratinocytes) [14] treated with hypoxia mimetic

agent, over-expression of exogenous miR-210 significantly

decreases cell proliferation. Overexpression of miR-210 in-

creases rotenone-induced hADSCs proliferation via PTPN2

(protein tyrosine phosphatase non-receptor type 2) in-

hibition [16]. However, in this study we found that miR-210

mimics inhibited proliferation of hADSCs and its inhibitor

showed the opposite effect. Furthermore, we did not find

a significant change in PTPN2 level in miR-210 transfected

hADSCs (data not shown). This discrepancy may be resulted

from different experimental conditions between the studies.

(13)

A B C

D E F

G

Fig. 8. IGFBP3 RNAi increases osteogenic differentiation and inhibits proliferation of hADSCs. (A) IGFBP3 mRNA levels were de- termined in control- (si-con) or IGFBP3 oligonucleotide- (si-IGFBP3) transfected hADSCs using real-time PCR. Internal control for expression analysis was GUSB. (B) hADSCs proliferation was determined by direct cell counting after siRNA oligo transfection. (C) Osteogenic differentiation of hADSCs was induced for 2 weeks. The IGFBP3 level was measured at the indicated times via real-time PCR analysis. (D) Oligonucleotide-transfected hADSCs were grown for 2 days, and adipogenic differentiation was induced for 7 days after reaching 80-90% confluence. Differentiation was determined by addition of Oil Red O solution, which was quantified by measuring the absorbance at 500 nm. (E) Osteogenic differentiation was induced for 14 days and determined by addition of Alizarin Red S solution, which was quantified by measuring the absorbance at 562 nm. Silencing of the IGFBP3 gene increased the osteogenic differentiation of hADSCs. (F) Determination of calcium deposition at 14 days after induction of osteogenic differentiation. (G) Real-time PCR analysis of ALP, OC, OPN,and RUNX2 in si-IGFBP3-transfected undifferentiated cells. Internal control for expression analysis was GUSB. Data represent mean ± SEM (n=4). * p<0.05 compared with si-con-transfected hADSCs

Insulin-like growth factor-binding protein (IGFBP)-3 as a high-affinity binding protein for the insulin-like growth fac- tors IGF-I and IGF-II can modulate IGF activity [7]. Presently, miR-210 modulated IGFBP-3 levels in hADSCs and IGFBP-3 level decreased during osteogenic differentiation, which was accompanied with the increase of miR-210 levels. Further- more, luciferase assay demonstrated that miR-210 directly binds to the 3’ UTR of IGFBP3, and the transfection of IGFBP3 siRNA induces the inhibition of hADSCs pro- liferation and increased osteogenic differentiation, support- ing that IGFBP3 is a direct target for miR-210-induced con- trol of cell proliferation and osteogenic differentiation of

hADSCs. It has been reported that IGFBP-3 inhibits osteo- blast differentiation in human osteosarcoma MG-63 cells through the interaction with vitamin D receptor [22] and in- duced inhibition of proliferation has been shown in hep- atocellular carcinoma cells [45], L6 myogenic cells [29], neu- ral progenitor cells [14], porcine embryonic myogenic cell [15], consistent with our data.

ZEB1/2 is a transcriptional repressor that interacts with

activated SMADs, and the nucleosome remodeling and his-

tone deacetylation (NURD) complex [40]. Increasing miR-200

levels has been reported to produce mesenchymal-to-epi-

thelial transition in human cancer cell lines, which is re-

(14)

sulted by targeting ZEB1 and ZEB2 [30]. Presently, miR-200a modulated ZEB2 levels in hADSCs and ZEB2 level decreased during osteogenic differentiation, which was accompanied with the increase of miR-200a levels. Furthermore, luciferase assay demonstrated that miR-200a directly binds to the 3’

UTR of ZEB2, and the transfection of ZEB2 siRNA increased the osteogenic differentiation of hADSCs, supporting the view that ZEB2 is a direct target for miR-200a-induced con- trol of osteogenic differentiation of hADSCs. The mechanism of ZEB2 on osteogenic differentiation is not clear. Treatment of TGF-β increases ZEB2 level and inhibits the level of miR-200, which is important for maintenance of the EMT process [10]. TGF- β inhibits the osteogenic differentiation of MSCs [20, 28, 35, 48]. Therefore, miR-200a-induced down- regulation of ZEB2 levels may induce inhibition of autocrine TGF- β signaling, resulting in increase of osteogenic differ- entiation of hADSCs. In this study, transfection of ZEB2 siRNA failed to alter cell proliferation of hADSCs. There- fore, the target molecule for miR-200a-induced increase of hADSCs proliferation is not ZEB2. The miR-200-induced in- crease of cell proliferation results from the targeting of PTEN (Phosphatase and tensin homolog) in endometrial and colon cancer cell lines [21]. However, no significant change in PTEN levels in miR-200a-transfected hADSCs was presently evident (data not shown). This result indicates that the miR-200a action on cell proliferation is mediated by different targets besides of PTEN and ZEB2.

Reciprocal relationship between proliferation and differ- entiation in osteoblasts has been reported [34]. In this study miR-200a and miR-210 showed the opposite effect on hADSCs proliferation in contrast with that on osteogenic differentiation. These results indicate that the regulation of proliferation processes itself in hADSCs is not relevant on the regulation of osteogenic differentiation.

The demonstration that miR-200a and miR-210 regulate osteogenic differentiation and proliferation of hADSCs by modulating ZEB2 and IGFBP3 levels, respectively, provides mechanistic insights into the molecular processes of MSCs differentiation and proliferation. These findings implicate miR-200a and miR-210 as potential targets for bone tissue engineering through miRNAs.

Acknowledgment

This work was supported by a 2-Year Research Grant of Pusan National University.

References

1. Ahmad, A., Aboukameel, A., Kong, D., Wang, Z., Sethi, S., Chen, W., Sarkar, F. H. and Raz, A. 2011. Phosphoglucose isomerase/autocrine motility factor mediates epithelial-mes- enchymal transition regulated by miR-200 in breast cancer cells. Cancer Res. 71, 3400-3409.

2. Bodempudi, V., Hergert, P., Smith, K., Xia, H., Herrera, J., Peterson, M., Khalil, W., Kahm, J., Bitterman, P. B. and Henke, C. A. 2014. miR-210 promotes IPF fibroblast pro- liferation in response to hypoxia. Am. J. Physiol. Lung Cell.

Mol. Physiol. 307, L283-294.

3. Brennecke, J., Hipfner, D. R., Stark, A., Russell, R. B. and Cohen, S. M. 2003. bantam encodes a developmentally regu- lated microRNA that controls cell proliferation and regu- lates the proapoptotic gene hid in Drosophila. Cell 113, 25-36.

4. Chan, S. Y., Zhang, Y. Y., Hemann, C., Mahoney, C. E., Zweier, J. L. and Loscalzo, J. 2009. MicroRNA-210 controls mitochondrial metabolism during hypoxia by repressing the iron-sulfur cluster assembly proteins ISCU1/2. Cell. Metab.

10, 273-284.

5. Cong, N., Du, P., Zhang, A., Shen, F., Su, J., Pu, P., Wang, T., Zjang, J., Kang, C. and Zhang, Q. 2013. Downregulated microRNA-200a promotes EMT and tumor growth through the wnt/beta-catenin pathway by targeting the E-cadherin repressors ZEB1/ZEB2 in gastric adenocarcinoma. Oncol.

Rep. 29, 1579-1587.

6. Fasanaro, P., D'Alessandra, Y., Di Stefano, V., Melchionna, R., Romani, S., Pompilio, G., Capogrossi, M. C. and Martelli, F. 2008. MicroRNA-210 modulates endothelial cell response to hypoxia and inhibits the receptor tyrosine kinase ligand Ephrin-A3. J. Biol. Chem. 283, 15878-15883.

7. Firth, S. M and Baxter, R. C. 2002. Cellular actions of the insulin-like growth factor binding proteins. Endocr. Rev. 23, 824-854.

8. Gao, S. L., Wang, L. Z., Liu, H. Y., Liu, D. L., Xie, L. M.

and Zhang, Z. W. 2014. miR-200a inhibits tumor pro- liferation by targeting AP-2gamma in neuroblastoma cells.

Asian. Pac. J. Cancer Prev. 15, 4671-4676.

9. Giannakakis, A., Sandaltzopoulos, R., Greshock, J., Liang, S., Huang, J., Hasegawa, K, Li, C., O'Brien-Jenkins, A., Katsaros, D., Weber, B. L., Simon, C., Coukos, G. and Zhang, L. 2008. miR-210 links hypoxia with cell cycle regulation and is deleted in human epithelial ovarian cancer. Cancer Biol. Ther. 7, 255-264.

10. Gregory, P. A., Bracken, C. P., Smith, E., Bert, A. G., Wright, J. A., Roslan, S., Morris, M., Wyatt, L., Farshid, G., Lim, Y. Y., Lindeman, G. J., Shannon, M. F., Drew, P. A., Khew- Goodall, Y. and Goodall, G. J. 2011. An autocrine TGF-be- ta/ZEB/miR-200 signaling network regulates establishment and maintenance of epithelial-mesenchymal transition. Mol.

Biol. Cell 22, 1686-1698.

11. Hua, Z., Lv, Q., Ye, W., Wong, C. K., Cai, G., Gu, D., Ji, Y., Zhao, C., Wang, J., Yang, B. B. and Zhang, Y. 2006.

MiRNA-directed regulation of VEGF and other angiogenic

(15)

factors under hypoxia. PLoS One 1, e116.

12. Huang, X., Le, Q. T. and Giaccia, A. J. 2010. MiR-210-micro- manager of the hypoxia pathway. Trends Mol. Med. 16, 230-237.

13. Johnston, R. J. and Hobert, O. 2003. microRNA controlling left/right neuronal asymmetry in Caenorhabditis elegans.

Nature 426, 845-849.

14. Kalluri, H. S. and Dempsey, R. J. 2011. IGFBP-3 inhibits the proliferation of neural progenitor cells. Neurochem. Res. 6, 406-411.

15. Kamanga-Sollo, E., Pampusch, M. S., Whitem M. E. and Dayton, W. R. 2003. Role of insulin-like growth factor bind- ing protein (IGFBP)-3 in TGF-beta- and GDF-8 (myostatin)- induced suppression of proliferation in porcine embryonic myogenic cell cultures. J. Cell. Physiol. 197, 225-231.

16. Kim, J. H., Park, S. G., Song, S. Y., Kim, J. K. and Sung, J. H. 2013. Reactive oxygen species-responsive miR-210 reg- ulates proliferation and migration of adipose-derived stem cells via PTPN2. Cell. Death. Dis. 4, e588.

17. Kim, Y. J., Bae, S. W., Yu, S. S., Bae, Y. C. and Jung, J. S.

2009. miR-196a regulates proliferation and osteogenic differ- entiation in mesenchymal stem cells derived from human adipose tissue. J. Bone. Miner. Res. 24, 816-825.

18. Kim, Y. J., Hwang, S. J., Bae, Y. C. and Jung, J. S. 2009.

MiR-21 regulates adipogenic differentiation through the modulation of TGF-beta signaling in mesenchymal stem cells derived from human adipose tissue. Stem Cells 27, 3093-3102.

19. Korpal, M., Lee, E. S., Hu, G. and Kang, Y. 2008. The miR-200 family inhibits epithelial-mesenchymal transition and cancer cell migration by direct targeting of E-cadherin transcriptional repressors ZEB1 and ZEB2. J. Biol. Chem. 283, 14910-14914.

20. Levi, B., Wan, D. C., Glotzbach, J. P., Hyun, J., Januszyk, M., Montoro, D., Sorkin, M., James, A. W., Nelson, E. R., Li, S., Quarto, N., Lee, M., Gurtner, G. C. and Longaker, M. T. 2011. CD105 protein depletion enhances human adi- pose-derived stromal cell osteogenesis through reduction of transforming growth factor beta1 (TGF-beta1) signaling. J.

Biol. Chem. 286, 39497-39509.

21. Li, H., Tang, J., Lei, H., Cai, P., Zhu, H., Li, B., Xu, X., Xia, Y. and Tang, W. 2014. Decreased MiR-200a/141 suppress cell migration and proliferation bytargeting PTEN in Hirschsprung's disease. Cell. Physiol. Biochem. 34, 543-553.

22. Li, J., Jin, D., Fu, S., Mei, G., Zhou, J., Lei, L., Yu, B. and Wang, G. 2013. Insulin-like growth factor binding protein-3 modulates osteoblast differentiation via interaction with vi- tamin D receptor. Biochem. Biophys. Res. Commun. 436, 632- 637.

23. Liang, W. C., Wang, Y., Wan, D. C., Yeung, V. S. and Waye, M. M. 2013. Characterization of miR-210 in 3T3-L1 adipo- genesis. J. Cell. Biochem. 114, 2699-2707.

24. Liu, Y., Liu, Q., Jia, W., Chen, J., Wang, J., Ye, D., Guo, X., Chen, W., Li, G., Wang, G., Deng, A. and Kang, J. 2013.

MicroRNA-200a regulates Grb2 and suppresses differ- entiation of mouse embryonic stem cells into endoderm and

mesoderm. PLoS One 8, e68990.

25. Lu, D. F., Yao, Y., Su, Z. Z., Zeng, Z. H., Xing, X. W., He, Z. Y. and Zhang, C. 2014. Downregulation of HDAC1 is involved in the cardiomyocyte differentiation from mesen- chymal stem cells in a myocardial microenvironment. PLoS One 9, e93222.

26. Mizuno, Y., Tokuzawa, Y., Ninomiya, Y., Yagi, K., Yatsuka- Kanesaki, Y., Suda, T., Fukuda, T., Katagiri, T., Kondoh, Y., Amemiya, T., Tashiro, H. and Okazaki, Y. 2009. miR-210 promotes osteoblastic differentiation through inhibition of AcvR1b. FEBS. Lett. 583, 2263-2268.

27. Nagaoka, K., Zhang, H., Watanabe, G. and Taya, K. 2013.

Epithelial cell differentiation regulated by MicroRNA-200a in mammary glands. PLoS One 8, e65127.

28. Ochiai, H., Okada, S., Saito, A., Hoshi, K., Yamashita, H., Takato, T. and Azuma, T. 2012. Inhibition of insulin-like growth factor-1 (IGF-1) expression by prolonged trans- forming growth factor-beta1 (TGF-beta1) administration suppresses osteoblast differentiation. J. Biol. Chem. 287, 22654-22661.

29. Pampusch, M. S., Kamanga-Sollo, E., Hathaway, M. R., White, M. E. and Dayton, W. R. 2011. Low-density lip- oprotein-related receptor protein 1 (LRP-1) is not required for insulin-like growth factor binding protein 3 (IGFBP-3) to suppress L6 myogenic cell proliferation. Domest. Anim.

Endocrinol. 40, 197-204.

30. Park, S. M., Gaur, A. B., Lengyel, E. and Peter, M. E. 2008.

The miR-200 family determines the epithelial phenotype of cancer cells by targeting the E-cadherin repressors ZEB1 and ZEB2. Genes. Dev. 22, 894-907.

31. Peng, C., Li, N., Ng, Y. K., Zhang, J., Meier, F., Theis, F.

J., Merkenschlager, M., Chen, W., Wurst, W. and Prakash, N. 2012. A unilateral negative feedback loop between miR- 200 microRNAs and Sox2/E2F3 controls neural progenitor cell-cycle exit and differentiation. J. Neurosci. 32, 13292- 13308.

32. Puisségur, M. P., Mazure, N. M., Bertero, T., Pradelli, L., Grosso, S., Robbe-Sermesant, K., Maurin, T., Lebrigand, K., Cardinaud, B., Hofman, V., Fourre, S., Magnone, V., Ricci, J. E., Pouysségur, J., Gounon, P., Hofman, P., Barbry, P. and Mari, B. 2011. miR-210 is overexpressed in late stages of lung cancerand mediates mitochondrial alterations asso- ciated with modulation of HIF-1 activity. Cell Death Differ.

18, 465-478.

33. Pulkkinen, K., Malm, T., Turunen, M., Koistinaho, J. and Ylä-Herttuala, S. 2008. Hypoxia induces microRNA miR-210 in vitro and in vivo ephrin-A3 and neuronal pentraxin 1 are potentially regulated by miR-210. FEBS. Lett. 582, 2397-2401.

34. Raucci, A., Bellosta, P., Grassi, R., Basilico, C. and Mansu- khani, A. 2008. Osteoblast proliferation or differentiation is regulated by relative strengths of opposing signaling path- ways. J. Cell. Physiol. 215, 442-451.

35. Rhodes, S. D., Wu, X., He, Y., Chen, S., Yang, H., Staser, K. W., Wang, J., Zhang, P., Jiang, C., Yokota, H., Dong, R., Peng, X., Yang, X., Murthy, S., Azhar, M., Mohammad, K.

S., Xu, M., Guise, T. A. and Yang, F. C. 2013.Hyperactive

(16)

초록:MicroRNA-200a/210의 인체 지방 유래 중간엽 줄기세포 골분화 및 증식 조절 기전

김영숙

1

․박희정

1

․신근구

1

․이선영

1

․배용찬

2

․정진섭

1

*

(

1

부산대학교 의학전문대학원 생리학 교실,

2

부산대학교 의학전문대학원 성형외과학 교실)

MicroRNA는 인체 지방 유래 중간엽 줄기세포(hADSC)의 분화와 증식을 조절할 수 있으나 hADSC에서 miR- 200a와 miR210의 역할은 아직까지 보고된 바가 없다. 표적 mRNA의 3’ UTR 에 결합할 수 있는 construct를 이용 한 luciferase assay를 통하여 microRNA가 직접적으로 표적 mRNA에 결합하는 것을 확인 하였다. hADSC에서 miR-200a 과발현은 ZEB2의 발현 감소를 통해 hADSC의 분화와 증식을 증가시키는 것을 확인할 수 있었으며, miR210의 과발현은 IGFBP3의 발현 감소를 통해 hADSC의 증식을 감소시키는 반면, 분화는 증가시키는 것을 확 인 할 수 있었다. hADSC에서 miR210의 발현 억제는 표적유전자의 발현을 증가시킴으로써 hADSC의 증식을 증 가시키는 반면, 분화를 억제시키는 것을 확인할 수 있었다. luciferase assay통하여 microRNA-200a/210의 과발현 이 대조군에 비해 표적 유전자인 ZEB2/ IGFBP3의 luciferase 활성화를 감소시키는 것을 확인하였으며, hADSC에 서 ZEB2/ IGFBP3 발현 억제는 microRNA-200a/210 과발현과 유사한 효과를 나타내는 것을 확인할 수 있었다.

이러한 결과는 microRNA-200a/210가 hADSC의 분화와 증식을 각각의 표적 유전자인 ZEB2/ IGFBP3을 통해 조 절한다는 것을 나타낸다.

transforming growth factor-beta1 signaling potentiates skel- etal defects in a neurofibromatosis type 1 mouse model. J.

Bone Miner. Res. 28, 2476-2489.

36. Shin, K. K., Kim, Y. S., Kim, J. Y., Bae, Y. C. and Jung, J.

S. 2014. miR-137 controls proliferation and differentiation of human adipose tissue stromal cells. Cell. Physiol. Biochem.

33, 758-768.

37. Tarantino, C., Paolella, G., Cozzuto, L., Minopoli, G., Pastore, L., Parisi, S. and Russo, T. 2010. miRNA 34a, 100, and 137 modulate differentiation of mouse embryonic stem cells.

Faseb. J. 24, 3255-3263.

38. Tsuchiya, S., Fujiwara, T., Sato, F., Shimada, Y., Tanaka, E., Sakai, Y., Shimizu, K. and Tsujimoto, G. 2011. MicroRNA- 210 regulates cancer cell proliferation through targeting fi- broblast growth factor receptor-like 1 (FGFRL1). J. Biol.

Chem. 286, 420-428.

39. Uhlmann, S., Zhang, J. D., Schwäger, A., Mannsperger, H., Riazalhosseini, Y.,Burmester, S., Ward, A., Korf, U., Wie- mann, S. and Sahin, O. 2010. miR-200bc/429 cluster targets PLCgamma1 and differentially regulates proliferation and GF-driven invasion than miR-200a/141 in breast cancer.

Oncogene 29, 4297-4306.

40. Verstappen, G., van Grunsven, L. A., Michiels, C., Van de Putte, T., Souopgui J.,Van Damme, J., Bellefroid, E., Vande- kerckhove, J. and Huylebroeck, D. 2008. Atypical Mowat- Wilson patient confirms the importance of the novel associa- tion between ZFHX1B/SIP1 and NuRD corepressor com- plex. Hum. Mol. Genet. 17, 1175-1183.

41. Wang, Z., Yin, B., Wang, B., Ma, Z., Liu, W. and Lv, G.

2014. MicroRNA-210 promotes proliferation and invasion of peripheral nerve sheath tumor cells targeting EFNA3. Oncol.

Res. 21, 145-154.

42. Xia, H., Ng, S. S., Jiang, S., Cheung, W. K., Sze, J., Bian, X. W., Kung, H. F. and Lin, M. C. 2010. miR-200a-mediated downregulation of ZEB2 and CTNNB1 differentially inhibits nasopharyngeal carcinoma cell growth, migration and invasion. Biochem. Biophys. Res. Commun. 391, 535-541.

43. Xu, P., Vernooy, S. Y., Guo, M. and Hay, B. A. 2003. The Drosophila microRNA Mir-14 suppresses cell death and is required for normal fat metabolism. Curr. Biol. 13, 790-795.

44. Yang, W., Sun, T., Cao, J., Liu, F., Tian, Y. and Zhu, W.

2012. Downregulation of miR-210 expression inhibits pro- liferation, induces apoptosis and enhances radiosensitivity in hypoxic human hepatoma cells in vitro. Exp. Cell Res. 318, 944-954.

45. Yin, J., Ding, J., Huang, L., Tian, X., Shi, X., Zhi, L., Song, J., Zhang, Y., Gao, X., Yao, Z., Jing, X. and Yang, J. 2013.

SND1 affects proliferation of hepatocellular carcinoma cell line SMMC-7721 by regulating IGFBP3 expression. Anat.

Rec. (Hoboken) 296, 1568-1575.

46. Zeng, L., He, X., Wang, Y., Tang, Y., Zheng, C., Cai, H., Liu, J., Wang, Y., Fu, Y. and Yang, G. Y. 2014. MicroRNA-210 overexpression induces angiogenesis and neurogenesis in the normal adult mouse brain. Gene Ther. 21, 37-43.

47. Zhang, Z., Sun, H., Dai, H., Walsh, R. M., Imakura, M., Schelter, J., Burchard, J., Dai, X., Chang, A. N., Diaz, R. L., Marszalek, J. R., Bartz, S. R., Carleton, M., Cleary, M. A., Linsley, P. S. and Grandori, C. 2009. MicroRNA miR-210 modulates cellular response to hypoxia through the MYC antagonist MNT. Cell Cycle 8, 2756-2768.

48. Zhao, L., Jiang, S. and Hantash, B. M. 2010. Transforming

growth factor beta1 induces osteogenic differentiation of

murine bone marrow stromal cells. Tissue. Eng. Part. A. 16,

725-733.

수치

Fig.  1.  Overexpression  of  miR-200a  increases  osteogenic  differentiation  and  proliferation  of  hADSCs
Fig.  2.  Overexpression  of  miR-210  increases  osteogenic  differentiation  and  inhibits  proliferation  of  hADSCs
Fig.  3.  Inhibition  of  miR-200a  inhibits  osteogenic  differentiation  and  proliferation  of  hADSCs
Fig.  4.  Inhibition  of  miR-210  inhibits  osteogenic  differentiation  and  increases  proliferation  of  hADSCs
+6

참조

관련 문서

The surface of untreated Ti, SLA treated Ti, and AA plasma polymerized SLA/Ti were also examined for their proliferation and differentiation of

In this study, we have fabricated the 660 nm red LED illumination controller and LED array module and evaluated the proliferation and differentiation

Determining optimal surface roughness of TiO₂blasted titanium implant material for attachment, proliferation and differentiation of cells derived from

Conclusions: Thus, 25-HC induced odontoclast differentiation through the odontoclastogenesis factor-mediated activation of NF-κB and upregulated inflammatory

3 An Analytic Function of Constant Absolute Value Is Constant The Cauchy-Riemann equations also help in deriving general. properties

These results of the histologic distribution of lamina propria, adipose tissue, and glandular tissue of the hard palatal mucosa and the topography of the greater palatine

differentiation, integration (line, surface and volume differentiation, integration (line, surface and volume integrals).. del( ) operator, gradient, divergence and

Fig 4 : Inhibitory effects of classified methanol extracts of Acalypha australis the COX-2 protein expression of the human oral cavity carcinoma KB cells....