Vol.:(0123456789)
https://doi.org/10.1007/s13206-021-00011-6
1 3
ORIGINAL ARTICLECompetitive Immunoassay of SARS‑CoV‑2 Using Pig Sera‑Derived
Anti‑SARS‑CoV‑2 Antibodies
Ji‑Hong Bong1 · Tae‑Hun Kim1 · Jaeyong Jung1 · Soo Jeong Lee1 · Jeong Soo Sung1 · Chang Kyu Lee1 · Min‑Jung Kang2 · Hyun Ok Kim3 · Jae‑Chul Pyun1
Received: 21 October 2020 / Revised: 20 November 2020 / Accepted: 4 January 2021 © The Korean BioChip Society 2021
Abstract
Anti-severe acute respiratory syndrome coronavirus 2 (anti-SARS-CoV-2) nucleoprotein (NP) antibodies were isolated from pig sera using human SARS-CoV-2 NP-immobilized magnetic beads. The binding properties of the isolated antibodies against SARS-CoV-2 NP were tested via flow cytometry using SARS-CoV-2 NP-immobilized magnetic beads. A competitive immunoassay was developed for detecting SARS-CoV-2 NP as well as SARS-CoV-2 in the culture fluid using magnetic beads with immobilized anti-SARS-CoV-2 NP antibodies. Selectivity tests were carried out during the competitive immunoassay for SARS-CoV, MERS-CoV, and CoV strain 229E in the culture fluid.
Keywords Competitive assay · SARS-CoV-2 · Culture fluid · Anti-SARS-CoV-2 nucleoprotein antibody · Nucleoprotein (NP)
1 Introduction
Severe acute respiratory syndrome coronavirus 2 (SARS-CoV-2) is a beta-corona virus, and four protein types (spike proteins, membrane proteins, envelop proteins, and nucle-oproteins (NPs)) have been used for detecting this virus. Among these, NPs have been most frequently used for devel-oping vaccines and the SARS-CoV-2 antigen test for in vitro diagnosis of coronavirus disease 2019 (COVID-19) [1, 2]. Recently, the antibodies against human SARS-CoV-2 nucle-oprotein (NP) from pig sera were used for detecting human SARS-CoV-2 in the culture fluid. This detection of human SARS-CoV-2 was possible because (1) a certain portion of virus particles was broken to release NP into the culture fluid
[3] and (2) the NPs of humans and pigs presented highly homologous amino acid sequences (> 40%) during BLAST analysis. In a previous report, SARS-CoV-2 NP anti-bodies were used to detect SARS-CoV-2 and other corona-viruses such as MERS-CoV and CoV strain 229E using the surface plasmon resonance biosensor [4].
Sandwich-type immunoassays have been used to detect antigens in samples using immobilized antibodies. In gen-eral, the response from the binding of antigens to the immo-bilized antibodies was generated in proportion to the antigen concentration in the samples [5–7]. In the case of competi-tive immunoassays, antigens in the sample compete for their binding sites with a fixed concentration of antigen-like sign-aling molecules. The signal from the indirect immunoas-says usually decreased as the antigen concentration in the samples increased because the antigen-like signaling mol-ecules were released from the immobilized antibodies. Such indirect immunoassays have been used to evaluate whether a certain target molecule was included in the sample, such as narcotics [8, 9] and insecticides [10–12].
In the present study, we presented a competitive immu-noassay to detect SARS-CoV-2 using isolated anti-SARS-CoV-2 NP antibodies from pig sera, which exhibited a bind-ing affinity to SARS-CoV-2 NP via immunoassays with immobilized antibodies and flow cytometry with magnetic beads of immobilized SARS-CoV-2 NP. The competitive * Jae-Chul Pyun
1 Department of Materials Science and Engineering, Yonsei
University, 50 Yonsei-Ro, Seodaemun-Gu, Seoul 03722, Republic of Korea
2 Molecular Recognition Research Center, Korea Institute
of Science and Technology (KIST), 5 Hwarang-ro 14-gil, Seongbuk-gu, Seoul 02792, Republic of Korea
3 Department of Laboratory Medicine, Yonsei University
College of Medicine, 50-1 Yonsei-Ro, Seodaemun-Gu, Seoul 03722, Republic of Korea
1 3
immunoassay was configured by mixing magnetic beads with immobilized SARS-CoV-2 NPs and known concen-trations of the isolated antibodies. The competitive assay overcame the Hook effect at high concentrations of SARS-CoV-2 and the narrow dynamic detection range of the stand-ard rapid test for the SARS-CoV-2 Ag test. Eventually, a selectivity test was carried out for the competitive immuno-assay for SARS-CoV, MERS-CoV, and CoV strain 229E in the culture fluid.
2 Results and Discussion
2.1 Isolation of Anti‑SARS‑CoV‑2 NP Antibody from Pig Sera
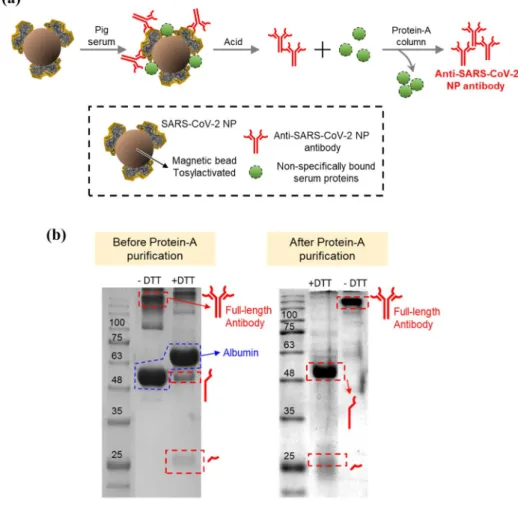
Anti-SARS-CoV-2 NP antibodies were isolated from pig sera using human SARS-CoV-2 NP-immobilized magnetic beads. As previously reported, SARS-CoV-2 NPs were immobilized on the magnetic beads via covalent bond-ing between the amino groups of SARS-CoV-2 NP and tosyl group present on the magnetic beads. As illustrated
in Fig. 1(a), the isolation was carried out through the fol-lowing steps: (1) incubation of pig sera for the binding of anti-SARS-CoV-2 NP antibodies to the magnetic beads, (2) acid dissociation of the bound proteins including anti-SARS-CoV-2 NP antibodies on the magnetic beads, and (3) protein-A purification of antibody (IgG) fraction among the dissociated proteins.
The isolated fraction was analyzed using SDS-PAGE, as illustrated in Fig. 1(b). To assess the antibody fraction after protein-A purification, the protein band correspond-ing to IgG (150 kDa) was observed without the treatment with the reducing agent dithiothreitol (DTT). After treat-ment with DTT for the reduction of disulfide bonds in IgG, the protein bands of the light chain (~ 25 kDa) and heavy chain (~ 50 kDa) of IgG were observed. These results indi-cated that the isolated proteins from pig sera corresponded to the IgG fraction. The isolation yield was estimated to be 2.91% ± 0.7% because 156 μg protein was obtained from 1 mL of pig sera before protein-A purification (n = 5). Eventually, the yield of antibody isolation was estimated to be 0.24% ± 0.05% because 12.3 μg of antibodies (IgG) was isolated from 1 mL of pig sera after protein-A puri-fication (n = 5).
Fig. 1 Isolation of anti-SARS-CoV-2 NP antibodies from pig sera. a Isolation procedure of anti-SARS-CoV-2 NP antibod-ies. b SDS-PAGE analysis of isolated anti-SARS-CoV-2 NP antibodies before and after treat-ment with dithiothreitol
1 3
2.2 Binding Properties of Anti‑SARS‑CoV‑2 NPAntibody
As previously reported, the binding properties of anti-CoV-2 NP antibodies were tested using immobilized SARS-CoV-2 NP proteins on a microplate and on magnetic beads. Initially, SARS-CoV-2 NP protein was immobilized on the microplate through hydrophilic and hydrophobic interac-tions, and then the isolated anti-SARS-CoV-2 NP antibod-ies were added to the microplate. As illustrated in Fig. 2(a), the amount of bound antibodies to the microplate was esti-mated using anti-pig IgG antibodies labeled with HRP and a chromogenic reaction with 3,3′,5,5′-tetramethylbenzidine (TMB). Eventually, the OD value was measured at 450 nm after quenching with sulfuric acid. As a negative control, a bovine serum albumin (BSA)-blocked microplate was used. As illustrated in Fig. 2(b), the OD value was increased in the antibody concentration range of 0.14–10.0 μg/mL (n = 3). In the negative control group, the OD value remained at the baseline level (n = 3). These results indicated that the isolated anti-SARS-CoV-2 NP antibodies from pig sera could bind specifically to the immobilized SARS-CoV-2 NP proteins.
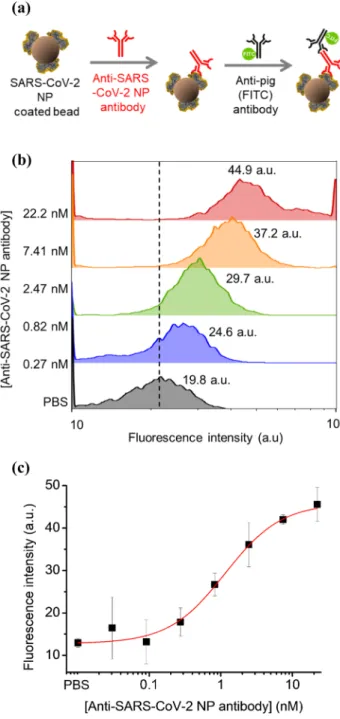
The quantitative binding of SARS-CoV-2 NP anti-bodies was analyzed via flow cytometry with SARS-CoV-2 NP-immobilized magnetic beads. As depicted in Fig. 3(a), the assay was carried out by mixing SARS-CoV-2 NP immobilized magnetic beads and samples at different con-centrations of anti-SARS-CoV-2 NP antibodies. For the
Fig. 2 Binding properties of the isolated SARS-CoV-2 NP anti-bodies from pig sera. a Configuration of immunoassay. b Immuno-assay results with the isolated SARS-CoV-2 NP immobilized on a microplate
Fig. 3 Quantitative binding of anti-SARS-CoV-2 NP antibodies using flow cytometry with the isolated anti-SARS-CoV-2 NP on magnetic beads. a Configuration of the quantitative binding test. b Results of flow cytometry with anti-SARS-CoV-2 NP antibodies bound to SARS-CoV-2 NP on the magnetic beads. c Standard curve for quanti-tative binding of anti-SARS-CoV-2 NP antibodies using flow cytom-etry
1 3
quantitative analysis of the bound anti-SARS-CoV-2 NP antibodies, the secondary antibody was reacted against pig-IgG labeled with fluorescein (λex = 488 nm, λem = 508 nm). Using the flow cytometry of magnetic beads, the fluores-cence intensity from these beads was measured for differ-ent concdiffer-entrations of isolated antibodies, as illustrated in Fig. 3(b). From the dose–response curve of flow cytometry (Fig. 3(c)), the anti-SARS-CoV-2 NP antibodies could be quantified at a concentration range of 0.03–22.2 μg/mL (n = 3). Considering the four parameter logistic equation [13], the binding constant (KD) of the isolated antibody against the immobilized SARS-CoV-2 NP on the magnetic beads was estimated to be 1.15 nM (n = 3).
2.3 Competitive Immunoassay of SARS‑CoV‑2 As previously reported, the isolated anti-SARS-CoV-2 NP antibodies from pig sera could be used to detect SARS-CoV-2 NP as well as SARS-SARS-CoV-2 in the culture fluid. In the present study, an assay was configured based on the competitive immunoassay for the quantitative analysis of SARS-CoV-2 NP as well as SARS-CoV-2 using magnetic beads with immobilized SARS-CoV-2 NP. As illustrated in Fig. 4(a), the magnetic beads and a known concentra-tion of anti-SARS-CoV-2 NP antibodies were mixed with the samples. When the sample had SARS-CoV-2 NP (or SARS-CoV-2), the isolated antibodies were bound to both magnetic beads and SARS-CoV-2 NP (or SARS-CoV-2). Eventually, secondary antibodies against pig-IgG labeled with fluorescein were used to quantify the bound antibod-ies on the magnetic beads. In the negative samples lack-ing SARS-CoV-2 NP (or SARS-CoV-2), all the isolated antibodies were bound to the magnetic beads. Therefore, when the secondary antibodies against pig-IgG labeled with fluorescein were treated, a remarkably higher fluorescence signal was observed from the magnetic beads. Therefore, the fluorescence signal decreased with an increase in the SARS-CoV-2 NP (or SARS-CoV-2) in the sample, and the positiveness of the sample could be evaluated by considering the difference between signals of the positive and negative samples.
First, SARS-CoV-2 NP was quantified in samples using a competitive assay. As illustrated in Fig. 4(b), PBS with-out SARS-CoV-2 NP was used as a negative control. When samples with SARS-CoV-2 NP were applied to the competi-tive assay, the fluorescence signal gradually decreased in the concentration range of 0.12–10.0 μg/mL and the signal was maintained at a baseline level above the concentration of 1 µg/mL (Fig. 4(c)). These results indicate that the com-petitive assay could be used for the quantitative analysis of SARS-CoV-2 NP.
Second, SARS-CoV-2 in the culture fluid was evalu-ated via a competitive assay. The quantification of
CoV-2 was carried out using a rapid test for SARS-CoV-2 from SD Biosensors (Seoul, Korea) [14]. As illus-trated in Fig. 5(a), the signal band was observed for the samples with diluted SARS-CoV-2 culture fluid, and the control bands indicated the validity of the test. According to the manufacturer’s manual [14], the cutoff value for determining the positivity of COVID-19 was established to be the dilution factor of 925, corresponding to a culture fluid fraction of 0.11%. As illustrated in Fig. 5(b), PBS without diluted SARS-CoV-2 culture fluid was used as a negative control for both the rapid test and the competitive assay. In the case of the rapid test, a linear detection range was observed in the dilution fraction range of 0.15%–1%. For the higher dilution fraction, the signal was observed to decrease, which indicated the Hook effect of the immuno-assay. For the lower dilution fraction, the signal remained at the baseline level. When the diluted samples of SARS-CoV-2 culture fluid were applied to the competitive assay, the fluorescence signal gradually decreased the dilution fraction of 0.078%–5%, and the quantitative analysis was determined to be possible in the whole range of used dilu-tion fracdilu-tions (n = 6). These results indicated that (1) the competitive assay had a considerably wider detection range than that observed in the conventional rapid test and (2) the competitive assay could be used even for the dilution fraction range where the Hook effect occurred (in the range of high dilution fraction) and the detection limit was attained (in the range of low dilution fraction).
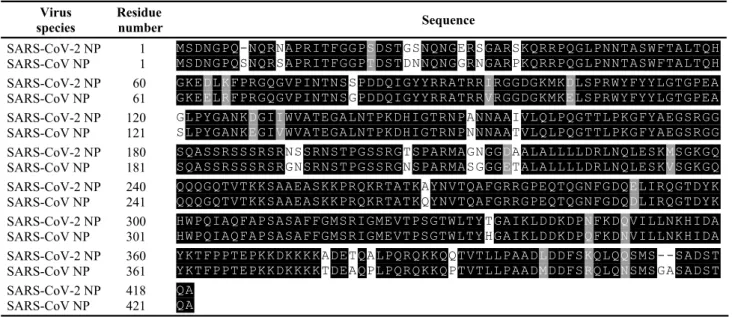
Third, the selectivity of the competitive assay was tested against SARS-CoV-2 and other types of coronavi-ruses of SARS-CoV, MERS-CoV, and CoV strain 229E. The culture fluid of CoV strain 229E was used as a nega-tive control. To compare the assay signals, normalized fluorescence intensity was used in the dilution fraction range of 0.078%–5%. As shown in Fig. 5(c), the coronavi-ruses SARS-CoV-2, SARS-CoV, and MERS-CoV revealed quantitative response according to the dilution fraction of each culture fluid. Such response indicated that the iso-lated anti-SARS-CoV-2 NP antibodies had a binding affin-ity against NP proteins from the corresponding viruses. In particular, the signals of the competitive assay from SARS-CoV-2 and SARS-CoV were quite similar because the homology of amino acid sequences in both NPs was estimated to be more than 90% (Table 1) from BLAST analysis, whereas the homology in MERS-CoV and CoV strain 229E was 48% (Table 2) and 29% (Table 3), respec-tively. These results indicated that a competitive assay based on magnetic beads with immobilized NPs could be used for the quantitative analysis of SARS-CoV-2 and other types of coronaviruses of SARS-CoV, MERS-CoV, and CoV strain 229E.
1 3
3 Conclusion
Anti-SARS-CoV-2 NP antibodies were isolated from pig sera using SARS-CoV-2 NP-immobilized magnetic beads, via the three steps discussed in the Results and Discussion
section. Finally, the yield of isolated antibody was esti-mated to be 0.24% ± 0.05% because 12.3 μg of antibodies (IgG) was isolated from 1 mL of pig sera after protein-A purification (n = 5). From the dose–response curve of flow cytometry, the quantification of anti-SARS-CoV-2 Fig. 4 Competitive
immunoas-say using the isolated anti-SARS-CoV-2 NP antibodies on magnetic beads. a Configuration of competitive immunoassay. b Results of flow cytometry for quantitative analysis of SARS-CoV-2 NP using competitive immunoassay. c Standard curve for quantitative analysis of SARS-CoV-2 NP using com-petitive immunoassay
1 3
NP antibodies was possible at 0.03–22.2 μg/mL (n = 3), and the binding constant (KD) of the isolated antibody against SARS-CoV-2 NP on the magnetic beads was esti-mated to be 1.15 nM (n = 3). A configuration based on the competitive immunoassay was developed for the quantita-tive analysis of SARS-CoV-2 NP as well as SARS-CoV-2 using magnetic beads with immobilized SARS-CoV-2 NP.
When diluted samples of SARS-CoV-2 culture fluid were applied to the competitive assay, the fluorescence signal gradually decreased the dilution fraction of 0.078%–5%, and the quantitative analysis was carried out for the entire range of used dilution fractions. These results indicated that (1) the competitive assay had a far wider detec-tion range than the convendetec-tional rapid test and (2) the Fig. 5 Competitive
immunoas-say of SARS-CoV-2. a Results of a rapid test for the diagnosis of SARS-CoV-2 antigen test using diluted culture fluid with SARS-CoV-2. b Comparison of the standard curve for quantita-tive analysis of SARS-CoV-2 using rapid test and competitive immunoassay. c Selectivity test for competitive immunoassay of SARS-CoV, MERS-CoV, and CoV strain 229E
1 3
competitive assay could be used even for the dilutionfraction range where the Hook effect occurred (in the range of high dilution fraction) and the detection limit was attained (in the range of low dilution fraction). Using the selectivity test for SARS-CoV-2 and other kinds of
coronaviruses such as SARS-CoV, MERS-CoV and CoV strain 229E, a competitive assay based on the magnetic beads with immobilized SARS-CoV-2 NP was used to quantify these viruses.
Table 1 Homology analysis of amino acid sequences between SARS-CoV-2 NP and SARS-CoV NP (Identity of sequences: 91%) Virus
species Residue number Sequence
SARS-CoV-2 NP SARS-CoV NP
1 1
MSDNGPQ-NQRNAPRITFGGPSDSTGSNQNGERSGARSKQRRPQGLPNNTASWFTALTQH MSDNGPQSNQRSAPRITFGGPTDSTDNNQNGGRNGARPKQRRPQGLPNNTASWFTALTQH
SARS-CoV-2 NP SARS-CoV NP 60 61 GKEDLKFPRGQGVPINTNSSPDDQIGYYRRATRRIRGGDGKMKDLSPRWYFYYLGTGPEA GKEELRFPRGQGVPINTNSGPDDQIGYYRRATRRVRGGDGKMKELSPRWYFYYLGTGPEA SARS-CoV-2 NP SARS-CoV NP 120 121
GLPYGANKDGIIWVATEGALNTPKDHIGTRNPANNAAIVLQLPQGTTLPKGFYAEGSRGG
SLPYGANKEGIVWVATEGALNTPKDHIGTRNPNNNAATVLQLPQGTTLPKGFYAEGSRGG
SARS-CoV-2 NP SARS-CoV NP
180 181
SQASSRSSSRSRNSSRNSTPGSSRGTSPARMAGNGGDAALALLLLDRLNQLESKMSGKGQ SQASSRSSSRSRGNSRNSTPGSSRGNSPARMASGGGETALALLLLDRLNQLESKVSGKGQ
SARS-CoV-2 NP SARS-CoV NP 240 241 QQQGQTVTKKSAAEASKKPRQKRTATKAYNVTQAFGRRGPEQTQGNFGDQELIRQGTDYK QQQGQTVTKKSAAEASKKPRQKRTATKQYNVTQAFGRRGPEQTQGNFGDQDLIRQGTDYK SARS-CoV-2 NP SARS-CoV NP 300 301 HWPQIAQFAPSASAFFGMSRIGMEVTPSGTWLTYTGAIKLDDKDPNFKDQVILLNKHIDA HWPQIAQFAPSASAFFGMSRIGMEVTPSGTWLTYHGAIKLDDKDPQFKDNVILLNKHIDA SARS-CoV-2 NP SARS-CoV NP 360 361
YKTFPPTEPKKDKKKKADETQALPQRQKKQQTVTLLPAADLDDFSKQLQQSMS--SADST YKTFPPTEPKKDKKKKTDEAQPLPQRQKKQPTVTLLPAADMDDFSRQLQNSMSGASADST
SARS-CoV-2 NP SARS-CoV NP 418 421 QA QA
*Black square: Completely matched sequence
Grey square: Amino acid sequence with similar property Dash line: Gap to fill out unmatched sequence
Table 2 Homology analysis of amino acid sequences between SARS-CoV-2 NP and MERS-CoV NP (Identity of sequences: 48%) Virus
species Residue number Sequence
SARS-CoV-2 NP MERS-CoV NP
1 1
MSDNGPQNQRNAPR-ITFGGPSDSTGSNQNGERSGARSKQRRPQGLPNNTASWFTALTQH MAS---PAAPRAVSFADNNDITNTNL----SRGRGRNPKPRAAPNNTVSWYTGLTQH
SARS-CoV-2 NP MERS-CoV NP
60 51
GKEDLKFPRGQGVPINTNSSPDDQIGYYRRATRRIRGGDGKMKDLSPRWYFYYLGTGPEA GKVPLTFPPGQGVPLNANSTPAQNAGYWRRQDRKINTGNG-IKQLAPRWYFYYTGTGPEA
SARS-CoV-2 NP MERS-CoV NP
120 110
GLPYGANKDGIIWVATEGALNTPKDHIGTRNPANNAAIVLQLPQGTTLPKGFYAEGSRGG
ALPFRAVKDGIVWVHEHGATDAPS-TFGTRNPNNDSAIVTQFAPGTKLPKNFHIEGTGGN SARS-CoV-2 NP
MERS-CoV NP
180 169
SQASSRSSSRSRNSSRNSTPGSS---RGTSPAR--MAGNGGDAALALLLLDRLNQLES
SQSSSRASSVSRNSSRSSSQGSRSGNSTRGTSPGPSGIGAVGGD----LLYLDLLNRLQA SARS-CoV-2 NP
MERS-CoV NP
239 225
KMSGKGQQQQGQTVTKKSAAEASKKPRQKRTATKAYNVTQAFGRRGPEQTQGNFGDQELI KMSGKGQQQQGQTVTKKSAAEASKKPRQKRTATKAYNVTQAFGRRGPEQTQGNFGDQELI SARS-CoV-2 NP
MERS-CoV NP
293 285
RQGTDYKHWPQIAQFAPSASAFFGMSRIGMEVTPS---GTWLTYTGAIKLDDKDPNF KLGTEDPRWPQIAELAPTASAFMGMSQFKLTHQNNDDHGNPVYFLRYSGAIKLDPKNPNY
SARS-CoV-2 NP MERS-CoV NP
347 345
KDQVILLNKHIDAYKTFPPTEPKKD--KKKKADETQALPQRQKKQQTVT L---NKWLELLEQNIDAYKTFPKKEKKQKAPKEESTDQMSEPPKEQRVQGSITQRTRTRPSVQP SARS-CoV-2 NP MERS-CoV NP 395 405 LPAADLDDFSKQLQQSMSSADSTQA GPMIDV NTD---*Black square: Completely matched sequence
Grey square: Amino acid sequence with similar property Dash line: Gap to fill out unmatched sequence
1 3
4 Materials and Methods
4.1 Materials
Anti-pig IgG labeled with horseradish peroxidase (ab102135) or fluorescein (ab9611) was purchased from Abcam (Cambridge, UK). The tosyl-activated magnetic beads (diameter of 2.8 µm, 14203) were purchased from Invitrogen Co. (Carlsbad, CA, USA). BSA (A2153) and other chemicals were purchased from Sigma-Aldrich Korea (Seoul, Korea). The bicinchoninic acid (BCA) assay kit (23227), pig sera (porcine sera, 26250084), and TMB reagent with H2O2 solution (34021) were purchased from Thermo Fisher Scientific (Waltham, MA, USA). Maxib-inding microplates (32296) were purchased from SPL Life Science (Pocheon, Korea). Culture fluids of SARS-CoV-2 (0810587CFHI), MERS-CoV (0810575CFHI), CoV strain 229E (0810229CFHI), and SARS-CoV (NATSARS-ST) were purchased from Zeptometrix (Buffalo, NY, USA). The His-tagged SARS-CoV-2 nucleoprotein (SARS-CoV-2 NP) was supplied by Genbody Inc. (Cheonan, Korea) and Opto-lane Inc. (Seongnam, Korea).
4.2 Purification of Anti‑SARS‑CoV‑2 Antibodies The antibodies were isolated from pig sera using the fol-lowing procedure. Initially, the pig sera (1 mL) were added to magnetic beads coated with SARS-CoV-2 NP (10 mg). Thereafter, the reaction tube was mixed continuously with a wheel-rotating mixer (RT-10, Daehan Scientific Co, Wonju,
Korea) for 1 h. The beads were prepared according to the manufacturer’s instructions. Next, the proteins bound to the beads were dissociated by treatment with 1 mL of 0.1 M glycine–HCl buffer (pH 2.7) for 10 s. Furthermore, Tris–HCl buffer (1 M, pH 10.5, 50 μL) was added for neutralization. The SARS-CoV-2 NP antibodies were eventually purified using a protein-A column without unwanted proteins. The product was finally concentrated with Amicon centrifugal filtration (molecular weight cutoff: 3 kDa). The yield of anti-bodies was determined as the amount of protein isolated from a unit volume (1 mL) of pig sera. The concentration of protein was estimated using a BCA assay kit from Thermo Fisher Scientific (Waltham, MA, USA).
4.3 The Binding Affinity Analysis of Anti‑SARS‑CoV‑2 Antibodies
Immunoassays using microplates (Fig. 2) and flow cytom-etry (Fig. 3) were performed to analyze the binding affinity of the isolated antibodies. For the microplate assay, the pro-teins (SARS-CoV-2 NP) were immobilized on a Maxibind-ing plate for 2 h at 100 μg/mL. Thereafter, each well was blocked with BSA (5 mg/mL, 1 h). The SARS-CoV-2 anti-bodies were added to each well at various concentrations, followed by a secondary antibody reaction (100 ng/mL, 1 h for both antibodies). After washing once with PBST and twice with PBS, the colorimetric reaction was performed using the TMB reagent with H2O2 (1:1 retio, 100 μL) for 3 min. The optical density was measured at a wavelength of 450 nm after quenching with 2 M sulfuric acid (100 μL) Table 3 Homology analysis of amino acid sequences between SARS-CoV-2 NP and CoV strain 229E (Identity of sequences: 29%)
Virus
species Residue number Sequence
SARS-CoV-2 NP CoV[229E] NP
1 1
MSDNGPQNQRNAPRITFGGPSDSTGSNQNGERSGARSKQRRPQGLPNNTASWFTALTQHG
MAT---VKWADASEPQRGRQGRI—-PYSLYSPLLVDS SARS-CoV-2 NP
CoV[229E] NP
61 33
KEDLKFPRGQGVPINTNSSPDDQIGYYRRATRRIRGGDGKMKDLSPRWYFYYLGTGPEAG EQPWKVIPRNLVPINKKD-KNKLIGYWN-VQKRFRTRKGKRVDLSPKLHFYYLGTGPHKD SARS-CoV-2 NP
CoV[229E] NP
121 91
LPYGANKDGIIWVATEGALNTPKDHIGTRNPANNAA---IVLQLPQGTTLPKGFYAEGSR
AKFRERVEGVVWVAVDGAKTEPTGY-GVRRKNSEPEIPHFNQKLPNGVTVVEE---PDSR
SARS-CoV-2 NP CoV[229E] NP
178 147
GGSQASSRSSSRSRNSSRN--STPGSSRGTSPARMAGNGGDAALALLLLDRLNQLESKMS
APSRSQSRSQSRGRGESKPQSRNPSSDRNHNSQDDIMKAVAAALKSLGFDKPQEKDKKSA SARS-CoV-2 NP CoV[229E] NP 236 207 GKGQQQQ---GQTVTKKSAAEASKKPRQKRTATK--AYNVTQAFG
KTGTPKPSRNQSPASSQTSAKSLARSQSSETKEQKHEMQKPRWKRQPNDDVTSNVTQCFG
SARS-CoV-2 NP CoV[229E] NP
276 267
RRGPEQTQGNFGDQELIRQGTDYKHWPQIAQFAPSASAFFGMSRIGMEVTPSGTWLTYTG P---RDLDHNFGSAGVVANGVKAKGYPQFAELVPSTAAMLFDSHIVSKESGNTVVLTFTT SARS-CoV-2 NP
CoV[229E] NP
336 324
AIKLDDKDPNFKDQVILLNKHIDAYKTFPPTEPKKDKKKKA--DETQALPQRQKKQQTVT RVTVPKDHPHLGKFLEELNAFTREMQQHPLLNPSALEFNPSQTSPATAEPVRDEVSIETD SARS-CoV-2 NP CoV[229E] NP 394 384 LLPAADLDDFSKQLQQSMSSADSTQA II DEVN---*Black square: Completely matched sequence
Grey square: Amino acid sequence with similar property Dash line: Gap to fill out unmatched sequence
1 3
using a microplate reader (Versamax Microplate reader)from Molecular Devices Co. (San Jose, CA, USA).
For the assay based on flow cytometry, 0.1 mg of the magnetic beads immobilized with SARS-CoV-2 NP was utilized. Anti-SARS-CoV-2 NP antibodies were incubated for 1 h at various concentrations, followed by the reaction of anti-pig(FITC) antibody solution (5 μg/mL, 1 h). After the aforementioned washing step, the fluorescence signals were obtained using FACSCalibur (BD, NJ, USA).
4.4 Competitive Assay of Anti‑SARS‑CoV‑2 Antibodies
The magnetic beads (0.1 mg) were aliquoted into each vial. Then various concentrations of SARS-CoV-NP (100 μL) and fixed concentration of anti-SARS-CoV-2 antibody (12.5 μg/ mL, 100 μL) were added simultaneously. After 1 h of wash-ing, anti-pig(FITC) antibody solution (12.5 μg/mL, 100 μL) was incubated for 1 h. The fluorescence signals were obtained using FACSCalibur (BD, NJ, USA).
4.5 Standard Curve Fitting
The results were fitted with the four parameter logistic equa-tion [15, 16] as described below:
where a and d are the maximum and minimum signals (a.u.), respectively; c is the concentration of SARS-CoV-2 NP (pM), and b is the Hill’s slope of the curve.
Acknowledgments This work was supported by the National Research Foundation of Korea [grant number: NRF-2020R1A2B5B01002187 and NRF-2020R1A5A101913111.
References
1. Spencer, K.-A., Osorio, F.A., Hiscox, J.A.: Recombinant viral proteins for use in diagnostic ELISAs to detect virus infection. Vaccine. 25, 5653–5659 (2007). https ://doi.org/10.1016/j.vacci ne.2007.02.053
2. Feng, W., Newbigging, A.M., Le, C., Pang, B., Peng, H., Cao, Y., Wu, J., Abbas, G., Song, J., Wang, D.-B., Cui, M., Tao, J., Tyrrell, D.L., Zhang, X.-E., Zhang, H., Le, X.C.: Molecular diagnosis of COVID-19: challenges and research needs. Anal. Chem. 92, 10196–10209 (2020). https ://doi.org/10.1021/acs.analc hem.0c020 60
3. Li, Y.-H., Li, J., Liu, X.-E., Wang, L., Li, T., Zhou, Y.-H., Zhuang, H.: Detection of the nucleocapsid protein of severe
y= a− d 1+(x∕
c
)b + d
acute respiratory syndrome coronavirus in serum: comparison with results of other viral markers. J. Virol. Methods. 130, 45–50 (2005). https ://doi.org/10.1016/j.jviro met.2005.06.001
4. Bong, J.-H., Kim, T.-H., Jung, J.-Y., Lee, S.-J., Sung, J.S., Lee, C., Kang, M.-J., Kim, H.O., Pyun, J.-C.: Pig sera-derived anti-SARS-CoV-2 antibodies in surface plasmon resonance biosensors. Biochip. J. 14, 358–368 (2020). https ://doi.org/10.1007/s1320 6-020-4404-z
5. Bulemo, P.M., Kim, I.D.: Recent advances in ABO(3) perovs-kites: their gas-sensing performance as resistive-type gas sensors. J. Korean Ceram. Soc. 57, 24–39 (2020). https ://doi.org/10.1007/ s4320 7-019-00003 -1
6. Kim, H.R., Bong, J.H., Jung, J., Sung, J.S., Kang, M.J., Park, J.G., Pyun, J.C.: An on-chip chemiluminescent immunoassay for bacterial detection using in situ-synthesized cadmium sulfide nanowires with passivation layers. Biochip. J. 14, 11 (2020). https ://doi.org/10.1007/s1320 6-020-4305-1
7. Pham, X.H., Hahm, E., Huynh, K.H., Son, B.S., Kim, H.M., Jun, B.H.: Sensitive colorimetric detection of prostate specific anti-gen using a peroxidase-mimicking anti-PSA antibody coated Au Nanoparticle. Biochip. J. (2020). https ://doi.org/10.1007/s1320 6-019-4204-5
8. Tran, R.J., Sly, K.L., Conboy, J.C.: Revealing the kinetic advan-tage of a competitive small-molecule immunoassay by direct detection. Anal. Chem. (2020). https ://doi.org/10.1021/acs.analc hem.0c022 86
9. Singh, S., Mishra, P., Banga, I., Parmar, S.A., Tripathi, P.P., Gan-dhi, S.: Chemiluminescence based immunoassay for the detection of heroin and its metabolites. Bioimpacts. 8, 53–58 (2018). https ://doi.org/10.15171 /bi.2018.07
10. Cheng, N., Shi, Q., Zhu, C., Li, S., Lin, Y., Du, D.: Pt–Ni(OH)2 nanosheets amplified two-way lateral flow immunoassays with smartphone readout for quantification of pesticides. Biosens. Bioelectron. 142, 111498 (2019). https ://doi.org/10.1016/j. bios.2019.11149 8
11. He, J., Tao, X., Wang, K., Ding, G., Li, J., Li, Q.X., Gee, S.J., Hammock, B.D., Xu, T.: One-step immunoassay for the insec-ticide carbaryl using a chicken single-chain variable fragment (scFv) fused to alkaline phosphatase. Anal. Biochem. 572, 9–15 (2019). https ://doi.org/10.1016/j.ab.2019.02.022
12. Wang, Y., Li, Z., Barnych, B., Huo, J., Wan, D., Vasylieva, N., Xu, J., Li, P., Liu, B., Zhang, C., Hammock, B.D.: Investiga-tion of the small size of nanobodies for a sensitive fluorescence polarization immunoassay for small molecules: 3-Phenoxyben-zoic Acid, an exposure biomarker of pyrethroid insecticides as a model. J. Agric. Food Chem. 67, 11536–11541 (2019). https :// doi.org/10.1021/acs.jafc.9b046 21
13. Tijssen, P.: Practice and theory of enzyme immunoassays. Else-vier, Amsterdam (1985)
14. http://sdbio senso r.com/xe/produ ct/7672.
15. Masdor, N.A., Altintas, Z., Tothill, I.E.: Sensitive detection of Campylobacter jejuni using nanoparticles enhanced QCM sen-sor. Biosens. Bioelectron. 78, 328–336 (2016). https ://doi. org/10.1016/j.bios.2015.11.033
16. Hasani, A., Do, H.H., Tekalgne, M., Hong, S.H., Jang, H.W., Kim, S.Y.: Recent progress of two-dimensional materials and metal-organic framework-based taste sensors. J. Korean Ceram. Soc. 57, 353–367 (2020). https ://doi.org/10.1007/s4320 7-020-00047 -8