Quantum-Dot-Sensitized Solar Cell with
Unprecedentedly High Photocurrent
Jin-Wook Lee1, Dae-Yong Son1, Tae Kyu Ahn1, Hee-Won Shin1, In Young Kim2, Seong-Ju Hwang2, Min Jae Ko3, Soohwan Sul4, Hyouksoo Han4& Nam-Gyu Park1
1Department of Energy Science, School of Chemical Engineering, Sungkyunkwan University, Suwon 440-746, Korea,2Center for Intelligent Nano-Bio Materials (CINBM), Department of Chemistry and Nano Sciences, Ewha Womans University, Seoul 120-750, Korea,3Photo-Electronic Hybrids Research Center, Korea Institute of Science and Technology (KIST), Seoul 136-791, Korea,4Center for Computer Simulation and Analytical Science, Samsung Advanced Institute of Technology (SAIT), Yongin 446-712, Korea.
The reported photocurrent density (JSC) of PbS quantum dot (QD)-sensitized solar cell was less than 19 mA/
cm2despite the capability to generate 38 mA/cm2, which results from inefficient electron injection and fast charge recombination. Here, we report on a PbS:Hg QD-sensitized solar cell with an unprecedentedly high JSCof 30 mA/cm2. By Hg21doping into PbS, JSCis almost doubled with improved stability. Femtosecond
transient study confirms that the improved JSCis due to enhanced electron injection and suppressed charge
recombination. EXAFS reveals that Pb-S bond is reinforced and structural disorder is reduced by interstitially incorporated Hg21, which is responsible for the enhanced electron injection, suppressed recombination and stability. Thanks to the extremely high JSC, power conversion efficiency of 5.6% is
demonstrated at one sun illumination.
Q
uantum dot (QD, semiconductor nanocrystal) has been recently drawing great attention as a material for solar energy conversion due to high absorption coefficient, tunable band gap and multiple exciton generation (MEG) effect1–4. QDs have been actively studied in dye-sensitized solar cell (DSSC) asalter-natives to conventional organic dyes5. As a result, remarkable accomplishments have been achieved in recent year,
where a power conversion efficiency (PCE) of ca. 5% was achieved using metal chalcogenides6,7and around 10%
using organic-inorganic perovskite8. However, most of the studied QDs for DSSC were based on the relatively large
band gap materials (.1.5 eV)6–8. Using these materials, it may not be possible to utilize the full solar spectrum,
which leads to a limited short-circuit photocurrent density (JSC) of ca. 20 mA/cm2(considering 20% loss from
FTO glass)9. No successful examples have been reported on high J
SCQD-sensitized solar cells based on low band
gap QDs (,1.5 eV) although it has ability to generate extremely high JSCowing to near IR absorption. Among the various low band gap QDs, PbS is one of the most intensively studied low band gap semiconductors since it has a high absorption coefficient of 1,53105cm21and wide range of tunable band gap owing to its large bohr exciton radius of 18 nm10,11. There have been a lot of efforts to use the PbS QD as a sensitizer. Antonio Braga et al. demonstrated a PCE of 2.21% with JSCof 10.91 mA/cm2using PbS/CdS QD photoelectrode being in contact
with polysulfide electrolyte12. Very recently, it was enhanced to 3.82% with J
SCof 18.84 mA/cm2by incorporating
PbS/CdS QD in hierarchical porous TiO213. However, the observed JSCs are still far below the theoretical value of
38 mA/cm2(after considering 20% light reflection at FTO) when considering the band gap of ca. 1.0 eV9. Main drawback of PbS QD in QD-sensitized solar cell has been argued to be inefficient charge separation and collection due to slow electron transfer kinetics14. Electron injection from the conduction band of PbS QD to the conduction band of TiO2was measured to be a ca. 100 ns, which is five times slower than CdSe QD (20 ns from
colloidal in organic solvent)14. In addition, it was also argued that PbS QD served as critical recombination center, which means that injected electrons in conduction band of TiO2tends to recombine readily with positively
charged PbS QD, and thereby efficient charge collection was seriously impeded12,15. For efficient charge separation and collection from the PbS QD, injection and recombination kinetics of PbS QD must be tuned. However, little attempt has been made to date.
Here, we report on a QD-sensitized solar cell with JSC approaching 30 mA/cm2 based on PbS:Hg QDs.
Deposition of PbS:Hg QD on nanostructured TiO2is implemented by simple wet chemical process, where the
photovoltaic performance is evaluated by using polysulfide as a redox electrolyte. Noticeable conversion effi-ciency of 5.6% with unprecedented high JSCis demonstrated under AM 1.5G one sun illumination. Electron
injection and charge recombination kinetics are studied by femtosecond transient absorption measurements. SUBJECT AREAS: QUANTUM DOTS SOLAR CELLS OPTICAL MATERIALS NANOPARTICLES Received 10 October 2012 Accepted 17 December 2012 Published 10 January 2013 Correspondence and requests for materials should be addressed to N.-G.P. (npark@skku. edu)
Chemical bonding nature surrounding Pb and Hg is investigated by extended X-ray absorption fine structure (EXAFS).
Results
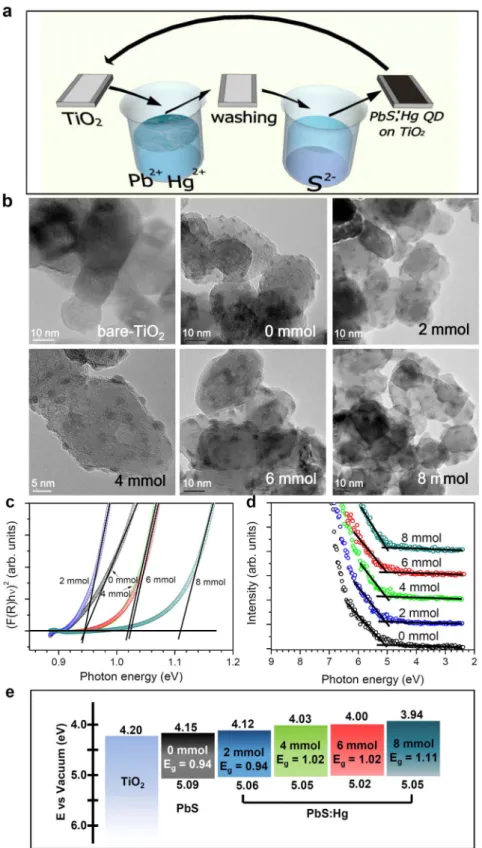
Fig. 1a shows deposition process of PbS:Hg QD on nanostructured TiO2surface using successive ionic layer adsorption and reaction
(SILAR) method. Pb21and Hg21ions are adsorbed on TiO 2surface
during the first dipping, which is followed by chemical reaction with S22 ion in second bath to form PbS:Hg QD on TiO
2 surface.
Concentration of HgCl2is varied from 0 mmol to 8 mmol to
evalu-ate the effect of Hg21concentration. Fig. 1b shows TEM micrographs of bare TiO2and PbS:Hg QD-adsorbed TiO2with different HgCl2
Figure 1|Morphology and energetic properties of PbS and PbS:Hg QDs. (a) Deposition process of PbS:Hg QDs on mesoporous TiO2nanostructure using successive ionic layer adsorption and reaction (SILAR) method. (b) TEM micrograph of bare TiO2and QD coated TiO2nanoparticles using the cationic solution containing 0 mmol, 2 mmol, 4 mmol, 6 mmol and 8 mmol of HgCl2.(c) Tauc plot calculated by using Kubelka-Munk equation from reflectance spectra. (d) UPS spectra of PbS:Hg QD adsorbed TiO2and extrapolation of low binding energy region. (e) Band edge alignment diagram for PbS and PbS:Hg QDs.
concentration. It is clearly identified that semi-sphered QDs are sparsely formed on the surface of TiO2nanoparticles regardless of
HgCl2concentration. Pb L3 and Hg L3 edges X-ray absorption near
edge spectroscopy (XANES) spectra of bulk PbS and HgS with PbS:Hg QDs deposited on TiO2 nanoparticles are compared in
Supplementary Fig. S1. To identify undesired impurity species, PbO, PbO2, Pb(NO3)2and HgCl2are also measured as references.
All electrodes showed almost identical shape with bulk PbS and HgS, which means that lead and mercury ions in samples exist in the form of Pb21and Hg21bonded to S22 16,17. Since it was reported that the peak area in X-ray photoelectron spectroscopic (XPS) data, repre-senting the number of electrons, is assumed to be proportional to the number of atoms in a given state18, the doping concentration is estimated from the area of Pb 4f and Hg 4f peaks (Supplementary Fig. S2, Table S1). As expected, the ratio of Hg21to (Pb211Hg21) increases as the HgCl2concentration increases. Doping
concentra-tion of Hg21in PbS:Hg is estimated to be 0, 5.4, 6.3, 14.6 and 16.7 at% for 0, 2, 4, 6 and 8 mmol of HgCl2, respectively. Relatively high
amount of Hg content of 16.7 at% for 8 mmol compared to the nominal composition (7.4 at%) is due to the stronger oxidizing char-acteristic of Hg21than Pb21 19.
Optical band gap of the QDs is estimated from reflectance spectra using Kubelka-Munk equation20 and Tauc plot21 (Fig. 1c). The optical band gap of PbS:Hg QD increases from 0.94 eV to 1.11 eV as the doping concentration increases from 0 at% to 16.7 at%. UV-vis absorption spectra of PbS:Hg QDs look red-shifted compared to the pristine PbS, especially in visible region as can be seen in Supplementary Fig. S3a. However, the threshold for the PbS doped with Hg (equal or greater than 4 mmol) in the NIR region in inset of Fig. S3a is moved to shorter wavelength than the pristine PbS, which is consistent with the increase in band gap. From the detailed invest-igation on HgCl2concentration change from 0 mmol to 2 mmol and
from 4 mmol to 6 mmol, optical band gap is almost unchanged in spite of the increased Hg21in PbS:Hg, which is related to quantum size effect (ca. 2.4 nm for 0 mmol, ca. 4.0 nm for 2 mmol and 4 mmol, and ca. 5.7 nm for 6 mmol and 8 mmol) as can be seen in Supplementary Fig. S4. As mentioned before, increase in Hg dop-ing concentration is expected to enlarge the optical band gap, which, however, will be compensated with increase in QD size. For this reason, little change in band gap is observed between 0 mmol and 2 mmol or 4 mmol and 6 mmol. Valence band maximum (VBM) is determined by ultraviolet photoelectron spectroscopy (UPS)22. Secondary cut-off is fitted to energy of He I light source (21.2 eV), where extrapolation of low energy region corresponds to potential energy of VBM from the vacuum level (Fig. 1d)22. It is noted that VBM is hardly changed by Hg concentration, which indicates that VBM is mainly dominated by S ion. The position of conduction band minimum (CBM) is calculated based on VBM and optical band gap energy. Band edge alignment is demonstrated in Fig. 1e, where CBMs of the QDs move upward as the concentration of HgCl2increases,
leading to gradual increase in optical band gap. PbS doped with Hg is measured to be p-type semiconductor (Supplementary Table S2), where thin film of PbS:Hg deposited on glass substrate is used for the Hall measurement instead of using QD-adsorbed TiO2 film
because deposited QD on TiO2is discontinuous.
Photovoltaic performances of PbS:Hg QD-sensitized solar cells are evaluated from current density-voltage (J-V) and external quantum efficiency (EQE) measurements (Fig. 2). Schematic structure of the QD-sensitized solar cell is depicted in Fig. 2a. Dependence of pho-tovoltaic performance on the SILAR coating cycle number is first investigated at the given TiO2thickness of 6.5 mm (Supplementary
Fig. S5). Optimum coating cycle for best efficiency is found to be 2 cycles for PbS (0 mmol of HgCl2), 4 cycles for both 2 mmol and
4 mmol HgCl2and 6 cycles for both 6 mmol and 8 mmol HgCl2
(Supplementary Fig. S5 and S6 and Table S3). In case of 0 mmol HgCl2condition (PbS), efficiency reaches maximum at 2 coating
cycles (Supplementary Fig. S6a) although absorption is further increased after 2 cycles (Supplementary Fig. S7a). This might be related to decreased band gap due to large sized PbS QD formed after several coating cycles14(ca. 5.7 nm for 6 cycle in Supplementary Fig. S4). No further increase in short-circuit current density (JSC) is
observed after 2 coating cycle (Supplementary Fig. S6b). On the other hand, PbS:Hg (2,8 mmol HgCl2) shows significant increase in JSC
as the coating cycle is increased, which is due to the increased absorp-tion (Supplementary Fig. S6b and Fig. S7b). Fig. 2b shows J-V curves of the PbS:Hg QD-sensitized solar cells depending on HgCl2
con-centration and photovoltaic parameters are summarized in Table S4, where ca. 10 mm-thick TiO2film is used since optimal efficiency is
obtained with around 10 mm-thick film from the investigation on dependence of TiO2 film thickness on photovoltaic performance
(Supplementary Fig. S8 and Table S5). JSCof QD-sensitized solar cell
is substantially improved after Hg21doping. By adding 2 mmol of HgCl2in Pb21 precursor solution, conversion efficiency is
signifi-cantly improved from 2.38% to 3.78%, which is mainly due to remarkable increase in JSCfrom 13.68 mA/cm2 to 22.27 mA/cm2
(63% increment). For the case of Hg21doped PbS, as the concentra-tion of HgCl2 increases from 2 mmol to 8 mmol, no significant
change in JSC is observed, whereas VOC is gradually increased.
Since the fill factors are degraded as photocurrent increase, shunt and series resistances are calculated from slope of J-V curves at short-circuit and at open-short-circuit region, respectively, using K2400 I-V system program based on LABVIEW (PV Measurements Inc) and plotted in Supplementary Fig. S9. Change in shunt resistance and series resistance are investigated as function of TiO2film thickness
and number of coating cycle. Upon increasing TiO2film thickness or
number of coating cycle, photocurrent is increased, while both shunt and series resistances are decreased. As can be seen in Tables S3 and S5, fill factors are decreased with increasing TiO2film thickness or
number of coating cycle, which is due to the decreased shunt resist-ance despite the decreased series resistresist-ance.
EQE spectra are demonstrated in inset of Fig. 2b. Maximum EQE of PbS:Hg QD sensitized solar cell reaches 74.6% at 470 nm, which is improved by 78% compared to the maximum EQE of 41.8% at 400 nm for PbS QD sensitized one. EQE is substantially enhanced from visible to near IR region, where 123% at 500 nm (from 33.1% to 74%), 472% at 700 nm (from 9.41% to 53.8%) and 440% at 1000 nm (from 1.89% to 10.2%) are improved. Stability of the devices is evaluated by measuring JSCwith respect to time
after electrolyte injection (Fig. 2c). JSCof PbS QD sensitized solar
cell sharply decreases immediately after electrolyte injection, where almost 80% of JSCdegrades during the initial 180 seconds.
Instability of PbS QD in polysulfide electrolyte is also observed in previous research12. However, degradation of J
SC surprisingly is
overcome as the HgCl2 concentration increases. Only 8%
degra-dation of JSCis observed for the 6 mmol sample. This is
consid-ered to be attributed to change in chemical bonding nature of Pb-S owing to Hg21doping, which will be discussed in detail based on EXAFS analysis.
Femtosecond transient absorption (TA) spectra are measured to analyze the carrier dynamics in PbS:Hg QD-TiO2system along with
pristine PbS QD-TiO2system. Fig. 2d shows femtosecond TA spectra
in the near IR (NIR) region from 840 nm to 1200 nm, where the source of absorption is related to electrons in conduction band of TiO223,24. When considering the wavelength of pump light (490 nm)
which is only absorbed by the QD, NIR absorption by electrons in TiO2conduction band can be ascribed to the injected photoelectrons
from PbS and PbS:Hg QD to TiO2. It can be noticed that DO.D.
increases as the HgCl2concentration increases and is highest for
HgCl2 concentration of 6 mmol. Since DO.D. is related to the
injected electrons,the higher DO.D. is indicative of more populated
electrons in TiO2conduction band, which is responsible not only for
Figure 2|Photovoltaic performance and femtosecond transient absorption spectra of PbS and PbS:Hg QDs. (a) Schematic device structure of QD-sensitized solar cell, (b) J-V curves and (c) Normalized JSCas a function of time for PbS:Hg QD-sensitized solar cells with different HgCl2 concentration. Inset is EQE spectra for PbS and 14.6 at% Hg21(6 mmol) doped PbS. (d) Transient absorption spectra at 0.5 ps delay. The wavelength of
pump light was 490 nm. (e) Transient absorption time profile and (f) Normalized DOD at 2 (6 0.1) ps (red), 20 (6 1) ps (blue), and 300 (6 15) ps (black) with standard deviation. The wavelength of probe was 870 nm. (g) Intensity averaged decay time constants (blue) and rise time constants (red) with error bars.
expected that increase in DO.D. leads to upward shift of Fermi level, resulting in increase in VOC25. The observed DO.D. is well correlated
with change in VOCmeasured in Table S4, where VOCincreases from
0.387 V to 0.426 V as the HgCl2increases from 0 mmol to 6 mmol
and slightly decreases to 0.424 with 8 mmol. Decreased DO.D. for 8 mmol HgCl2condition might be related to blue shift of absorption
caused by the increased band gap. TA time profile in this region exhibits triply exponential decays with an ultrafast rising component as a result of numerical convolutions with cross-correlation function (FWHM 5 200 fs). In order to compare the carrier dynamics, DO.D. is normalized as a function of time (Fig. 2e). The decay dynamics slow down monotonically with an increased concentration of HgCl2
from 0 mmol to 8 mmol. In Fig. 2f, DO.D. at arbitrary time delays of 2 ps, 20 ps, and 300 ps are elucidated with different HgCl2
concen-tration. The DO.D. at arbitrary time increases with increased HgCl2
concentration, which have the same trend with the shorter time delay (21 ps,13 ps). Numerically fitted parameters for decay time profile are listed in Table S6 where triply exponential model (eq 1) is used, and average decay time constants (td) are estimated by
eq 226, F tð Þ~A1e{t=t1zA2e{t=t2zA3e{t=t3 ð1Þ td~ Pi~1,2,3A it2i Pi~1,2,3 Aiti ð2Þ where Ai and ti are triply exponential decay components
con-stant. Average decay time constant increases from 151 ps to 186 ps as the HgCl2 concentration increases from 0 mmol to
8 mmol (Fig. 2g). Absorption decay dynamics of electrons in conduction band of TiO2 result from recombination of injected
electrons with holes in QDs in absence of electrolyte. Therefore it is obvious that charge recombination in TiO2 is substantially
suppressed as the HgCl2 concentration increases, which is
responsible for the increased VOC. Also, considering that charge
collecting efficiency is inversely proportional to recombination kinetics, suppressed charge recombination may lead to improve-ment of charge collecting efficiency (Fc)27. Ultrafast rising of
DO.D. signal in Fig. 2e is originated from injection of photo-excited electrons from QD to TiO223,24. Therefore, it is possible
to estimate the electron injection kinetics by measuring the time for DO.D. signal to reach its maximum. Fitted rise time constants are listed in Table S6 and Fig. 2g. Rise time constant decreases from 340 fs to 270 fs as the HgCl2concentration increases from
0 mmol to 8 mmol, which implies an improved electron injection efficiency (Finj)28. It may not be ruled out that upward shift of
PbS QD conduction band upon Hg21 doping provides a driving force for faster electron injection in PbS:Hg QD than in PbS QD29. However, since the band shift of CBM of QDs seems favoring electron injection toward TiO2, one hypothesis for the improved
functional properties of the cell and the mechanism for the inhibition of charge recombination seems to be related to struc-tural reinforcement by Hg doping.
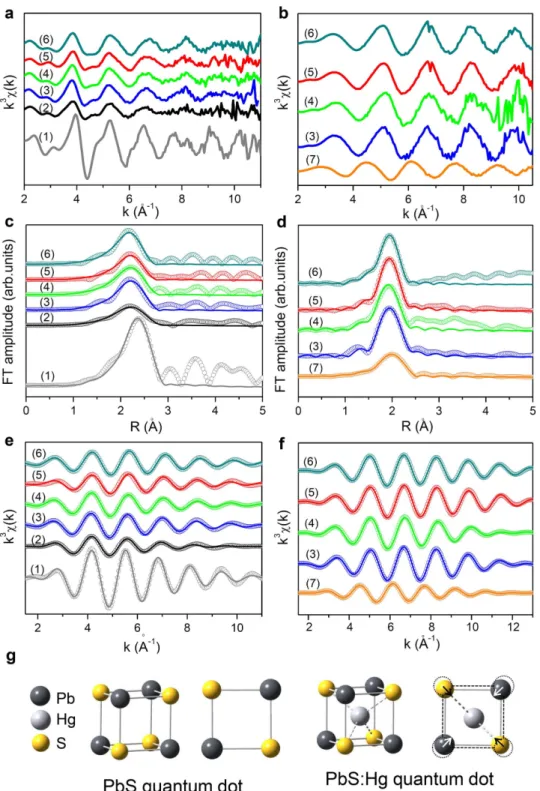
The effect of Hg21doping on the local structure of Pb21ions in the PbS:Hg QD adsorbed on TiO2surface is investigated with EXAFS
analysis at Pb and Hg L3-edge. As can be seen in Fig. 3a, regardless of
Hg doping, all the present PbS:Hg QDs adsorbed on TiO2 show
typical EXAFS oscillation of the reference PbS, confirming the formation of rocksalt-structured PbS phase. A closer inspection on the experimental spectra reveals that the wavelength of EXAFS oscil-lation becomes greater with the increase of Hg content, strongly suggesting the shortening of (Pb-S) bonds upon Hg doping30. The decrease of (Pb-S) bond distance upon the Hg doping is obviously verified by the quantitative EXAFS fitting analysis showing the grad-ual decrease of (Pb-S) distance with the increase of HgCl2
concen-tration (Fig. 3c, Fig. 3e and Table 1). This result provides strong
evidence for the reinforcement of the (Pb-S) bonds by the doping of Hg21ions. In addition to the systematic variation of bond distance, there is an overall decreasing trend of Debye-Waller factor (s2) with the increase of HgCl2 concentration, indicating the depression of
structural disorder around Pb ions (Table 1)31. Such a decrease of structural disorder is also attributable to the reinforcement of (Pb-S) bonds upon the Hg doping. The strengthening of chemical bonds between Pb and S leads not only to the increase of the optical band gap of PbS QD but also to the upward shift of the conduction band of PbS with antibonding character. For local structure of mercury ion, detailed analysis on the Hg L3-edge EXAFS spectra (Fig. 3b, 3d and
3f) is performed as follows. Since the value of coordination number obtained from the EXAFS fitting analysis corresponds to the product of coordination number (CN) and amplitude reduction factor (S02),
it is necessary to get the knowledge of amplitude reduction factor for a Hg-S pair, prior to determining the exact coordination number of Hg ion. In the present analysis, the S02value obtained from the pure
HgS reference is used to calculate the exact CN of mercury in the present PbS:Hg QDs. As listed in Table 1, this fitting analysis yields the CN of ,3.7–4 for mercury ions in the PbS:Hg QDs, strongly suggesting the stabilization of Hg ions in the interstitial tetrahedral sites. The tetrahedral symmetry of Hg ions in the PbS:Hg QDs is further confirmed by the comparison of their bond distance with that of pure (bulk) HgS material. In comparison with the reference HgS where the Hg ions are stabilized in the tetrahedral sites with the (Hg-S) bond distance of 2.49 A˚ , the present PbS:Hg QDs show a shorter bond distance of ,2.36–2.38 A˚ . Since the decrease of CN shortens the bond distance, the shorter (Hg-S) bond distance of the PbS:Hg QDs than that of the pure HgS underscores that the CN of Hg ion is smaller than or similar to four (i.e. the CN of Hg in the reference HgS). This result provides strong evidence for the stabilization of mercury ions in interstitial tetrahedral sites. If the Hg ions exist in octahedral symmetry (Pb site) with CN 5 6, the PbS:Hg QDs should show a longer (Hg-S) bond distance than that of the reference HgS (2.49 A˚ ) with CN 5 4. The tetrahedrally coordinated interstitial Hg21 ions contribute to contraction of lattice and consequently causing a reinforcement of Pb-S bond (Fig. 3g). Theoretically calculated (Hg-S) bond distance for 6 mmol HgCl2case is 2.386 A˚ , which is well
consistent with the observed bond distance of 2.369 A˚ . Both the enhancement of (Pb-S) bond strength and the improvement of struc-tural ordering around Pb21ions strongly suggest the enhanced struc-tural stability of PbS QD via the Hg doping. In addition, the enhanced structural ordering is likely to lead to reduction of deep trap density32,33, which contributes to suppression of charge recom-bination. Thus, the structural reinforcement by Hg addition is play-ing major role in improvplay-ing the functional properties of the cell, and is the main mechanism for the inhibition of charge recombination compared to the role of band shift.
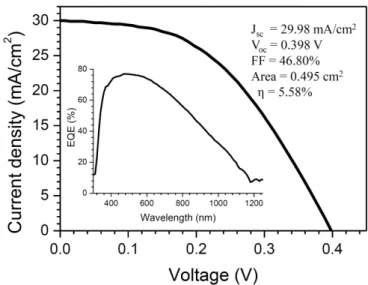
Best performance of PbS:Hg QD sensitized solar cell in this study is obtained by combination of 6 mmol HgCl2condition, scattering
layer and CsOH additive in electrolyte. Addition of 0.3 M CsOH into the electrolyte improves fill factor of the device by 13% (Supple-mentary Fig. S10 and Table S7), which is probably due to decrease in interfacial resistance at electrolyte/Cu2S counter electrode34. Light
scattering layer increases further EQE at longer wavelength (EQE of 56% at 800 nm and 32% at 1000 nm). As a result, JSC reaches
29.98 mA/cm2, leading to a PCE as high as 5.58% at AM 1.5G one sun illumination (Fig. 4).
Discussion
We presented a mercury doped PbS QD-sensitized solar cell with extremely high JSCof 30 mA/cm2. Such a high JSCwas realized by
reinforcing Pb-S bond via incorporation of Hg21ion into the inter-stitial site of PbS lattice. The improved ordering and covalency sur-rounding Pb ion led to faster electron injection and suppressed charge recombination. It is therefore concluded that structural
reinforcement by Hg addition plays a major role in improving the functional properties of the cell, and is the main mechanism for the inhibition of charge recombination. Based on our findings, optoelec-tronic and photovoltaic properties of QD materials are expected to be significantly improved by careful investigation on chemical bonding nature. Furthermore, such a preponderant enhancement in QD pho-tovoltaic materials is believed to provide new insight into super high efficiency solar cell technology such as third generation MEG photo-voltaics.
Methods
Sensitization of PbS:Hg QD on mesoporous TiO2layer.TiO2nanoparticles and films were prepared according to the method described elsewhere35. Fluorine-doped tin oxide (FTO) glass (Pilkington, TEC-8,8 V/sq ) was cleaned with ethanol using ultrasonic cleaner for 15 min and subsequently UV/Ozone cleaning was conducted for 15 min to remove organic contaminants. A dense blocking layer was prepared on the cleaned FTO glass using 0.1 M Ti(IV) bis (ethyl acetoacetato) diisopropoxide (Aldrich, 98%) in 1-butanol (Aldrich, 99.8%) solution. TiO2nanoparticles were hydrothermally synthesized using titanium isopropoxide (Aldrich, 97%) in autoclave at 230uC. TiO2paste was prepared by mixing the synthesized nanocrystalline TiO2, terpineol (Aldrich, 99.5%), ethyl cellulose (Aldrich, 46 cp) and lauric acid (Fluka,
Figure 3|Pb and Hg L3-edge EXAFS analysis of PbS and PbS:Hg QDs. EXAFS data of Pb (a, c, e) and Hg (b, d, f) L3-edge region. (a),(b) Experimental k3X (k) EXAFS oscillations, (c),(d) Fourier transformed EXAFS data, and (e)(f) the Fourier-filtered EXAFS data of (1) bulk PbS, (2) 0 mmol, (3) 2 mmol,
(4) 4 mmol, (5) 6 mmol, (6) 8 mmol HgCl2and (7) bulk HgS. In the (c), (d), (e) and (f), empty circles and solid lines represent the experimental and fitted data, respectively. (g) PbS and PbS:Hg quantum dot unit cell using ball-stick model, showing contraction of Pb-S bond via interstitial occupation of Hg ion.
96%) with nominal composition of 1.255450.350.1. The paste was further treated using three-roll-mill for 40 min to disperse nanoparticles sufficiently. The TiO2paste was coated on the blocking layer coated FTO substrate using doctor-blade method and annealed at 550uC for 1 h in air. Thickness of the annealed mesoporous TiO2layers was measured by an alpha-step IQ surface profiler (KLA Tencor). Successive ionic layer adsorption and reaction (SILAR) method was used to sensitize the TiO2 nanoparticles with PbS:Hg QDs as described in Fig. 1a. Briefly, mesoporous TiO2 coated electrode was first dipped in aqueous solution of 0.1 M Pb(NO3)2(Aldrich, 99.99%) for 1 min, followed by dipped in 0.1 M Na2S (Aldrich) for 1 min. Between each dipping, the electrode was thoroughly washed with DI (deionized) water. For PbS:Hg, 2,8 mmol of HgCl2(Sigma-Aldrich, 99.5%) was added to cationic precursor solution. These processes were defined as one cycle and several coating cycle was repeated to obtain the optimum photovoltaic performance in each condition (2 cycles for 0 mmol, 4 cycles for 2 mmol and 4 mmol and 6 cycles for 6 mmol and 8 mmol) (Supplementary Fig. S5, Fig. S6 and Table S3). To enhance the photovoltaic performance, ZnS passivation layer was deposited after PbS:Hg deposition on TiO2by using aqueous solution of 0.1 M Zn(CH3COO)2(Aldrich, 99.99%) and 0.1 M Na2S36. Solar cell fabrication.Cu2S formed on a brass sheet was used for counter electrode. Brass foil (Alfa aesar, 0.25 mm thick) was etched in hydrochloric acid (SAMCHUM, 35.0,37.0%) at 80uC for 15 min and subsequently washed with DI water and dried using air gun. Polysulfide solution composed of 1 M Na2S (Aldrich) and 1 M S (Sigma-Aldrich, 99.5%) in DI water was dropped on unmasked area of etched brass and black colored Cu2S immediately formed on the brass foil. The PbS:Hg QD-sensitized working electrode and the Cu2S-brass counter electrode were assembled using double-side silicon-binder-coated polyimide tape (ca. 80 mm) as a spacer and sealant. Polysulfide redox electrolyte composed of 1 M Na2S (Aldrich) and 1 M S (Sigma-Aldrich, 99.5%) in DI water was injected through the 0.75 mm-diameter hole at working electrode and the holes were sealed using polyimide tape. For the best performance, 0.3 M of CsOH (Aldrich, 99.9%, 50 wt% solution in water) was added to electrolyte.
Materials and photovoltaic characterizations.The active area was measured by a digital microscope camera (DCMe 500) equipped with an image analysis program (Leopard 2009). Current density and voltage were measured using solar simulator (Oriel Sol 3A class AAA) equipped with 450 W Xenon lamp (Newport 6279NS) and a Keithley 2400 source meter. Light intensity was adjusted with the NREL-calibrated Si solar cell having KG-2 filter for approximating one sun light intensity (100 mW/cm2). While measuring current and voltage, the cell was covered with an aperture mask. External quantum efficiency (EQE) was measured by a specially designed EQE system (PV measurement Inc.). A 75 W Xenon lamp (USHIO, Japan) was used as a white light source to generate monochromatic beam. Morphology and size of PbS:Hg QDs adsorbed on the nanocrystalline TiO2surface were investigated using a high-resolution transmission electron microscope (HR-TEM, Jeol, JEM-2100F) at an acceleration voltage of 200 kV. Average diameter of QDs was determined from TEM micrograph using image J program (version 1.45s). Stoichiometry of QDs was analyzed using X-ray photoelectron spectroscopy (VG microtech, ESCA 2000). X-ray source was Al Ka and x axis was fitted for C 1s peak to have 284.6 eV. Removal of background signal and integration of peak was conducted using VGX900-W system. Ultraviolet photoelectron spectroscopy (UPS) spectra were measured with an AXIS-NOVA using a He I (21.2 eV) gas discharge lamp. Absorbance and reflectance was measured by UV/Vis spectrometer (PerkinElmer, Lambda 1050).
Hall measurement.To prepare samples for Hall measurement, chemical bath deposition of PbS and PbS:Hg thin film was conducted as described elesewhere37. 1 M Pb(CH3COO)2, 1 M thiourea and 0.5 M NaOH in DI water were used for deposition of PbS while 0.85 M Pb(CH3COO)2and 0.15 M HgCl2were used for deposition of
PbS:Hg film. Both of the deposition was performed for 10 min at room temperature, which led to 300 nm thick-PbS and 235 nm thick-PbS:Hg on glass substrate. Hall voltage was measured under bias current of 1 mA for PbS film and 3 mA for PbS:Hg film, and applied field was adjusted from 1 to 5 kG using LaKeShore 7500 series Hall Measurement System at room temperature. Resistivity, type of conductivity, sheet carrier density, and mobility of majority carrier were calculated by van der Pauw method.
Femtosecond transient absorption measurement.Pump-probe transient absorption (TA) experiments were carried out using commercial Helios system (Ultrafast Systmes). The pump beam of 490 nm with a pulse energy of 1.6 mJ was obtained from an optical parametric amplifier (Light conversion, TOPAS-C), pumped by a regeneratively amplified Ti:Sapphire laser system (Coherent, Libra) with 1-k Hz repetition rate. The probe pulse was a white light continuum generated by focusing a small portion of the amplifier output though a c-axis sapphire window. XANES and EXAFS measurements.Local structure of QD was analyzed by XANES (X-ray absorption near edge structure) and EXAFS (extended X-ray absorption fine structure). The Pb L3-edge XANES/EXAFS data were collected at room temperature in a fluorescent mode at the beam line 10C at the Pohang Accelerator Laboratory (PAL), Korea. The spectra were calibrated by measuring the spectrum of Pb foil simultaneously. Data analysis for the experimental spectra was performed with the standard procedure by using UWXAFS 2.0 program38. For the fitting of the reference, the amplitude reduction factor (S02) was varied while the CN was fixed to the crystallographic value. All the bond distances (R), Debye-Waller factors (s2), and energy shifts (DE) were allowed to vary. In order to exactly estimate the CNs of lead ions in the present PbS:Hg QDs adsorbed on TiO2, S02was fixed to the value from the reference PbS.
1. Nozik, A. J. et al. Semiconductor quantum dots and quantum dot arrays and applications of multiple exciton generation to third-generation photovoltaic solar cells. Chem. Rev. 110, 6873–6889 (2010).
2. Samber, J. B., Novet, T. & Parkinson, B. A. Multiple exciton collection in a sensitized photovoltaic system. Science 330, 63–66 (2010).
3. Kamat, P. V. Quantum dot solar cells. Semiconductor nanocrystals as light harvesters. J. Phys. Chem. C 112, 18737–18753 (2008).
4. Tang, J. et al. Colloidal-quantum-dot photovoltaics using atomic-ligand passivation. Nat. Mater. 10, 765–771 (2011).
5. Ru¨hle, S., Shalom, M. & Zaban, A. Quantum-dot-sensitized solar cells. ChemSusChem 11, 2290–2304 (2010).
6. Santra, P. K. & Kamat, P. V. Mn-doped quantum dot sensitized solar cells: A strategy to boost efficiency over 5%. J. Am. Chem. Soc. 134, 2508–2511 (2012). 7. Pan, Z. et al. Highly efficient inverted type-I CdS/CdSe core/shell structure
QD-sensitized solar cells. ACS Nano 6, 3982–3991 (2012).
8. Kim, H.-S. et al. Lead iodide perovskite sensitized all-solid-state submicron thin film mesoscopic solar cell with efficiency exceeding 9%. Sci. Rep. 2:591, 1–7 (2012).
9. Meillaud, F., Shah, A., Droz, C., Vallat-Sauvain, E. & Miazza, C. Efficiency limits for single-junction and tandem solar cells. Sol. Energ. Mater. Sol. Cells 90, 2952–2959 (2006).
Table 1 | Results of non-linear least-squares curve fitting analysis for the Pb and Hg L3edge spectra of the PbS and PbS:Hg QDs
adsorbed on TiO2with different HgCl2concentration. Bulk PbS
and HgS are references. CN, R and s2represent coordination number, interatomic distance and Debye-Waller factor
Bond CN R (A˚) s2(10233A˚2)
Bulk PbS (Pb-S) 6 2.869 17.58 0 mmol (Pb-S) 3.07 2.796 26.30 2 mmol (Pb-S) 2.95 2.780 18.77 4 mmol (Pb-S) 3.16 2.772 20.88 6 mmol (Pb-S) 1.94 2.755 15.88 8 mmol (Pb-S) 2.64 2.732 16.42 Bulk HgS (Hg-S) 4 2.492 10.72 2 mmol (Hg-S) 3.74 2.384 4.95 4 mmol (Hg-S) 4.05 2.359 6.78 6 mmol (Hg-S) 3.73 2.369 5.15 8 mmol (Hg-S) 3.96 2.373 6.33
Figure 4|Photovoltaic performance of PbS:Hg QD-sensitized solar cell. J-V curve and EQE spectrum (inset) of PbS:Hg QD-sensitized solar cell. HgCl2concentration was 6 mmol and number of coating cycle was 6. Total TiO2film thickness was 25 mm, comprising 5 mm with 20 nm TiO2 particles and 20 mm with 40 nm and 500 nm TiO2particles.
10. Schoolar, R. B. & Dixon, J. R. Optical constants of lead sulfide in the fundamental absorption edge region. Phys. Rev. 137, A667–A670 (1965).
11. Scholes, G. D. & Rumbles, G. Excitons in nanoscale systems. Nat. Mater. 5, 683–696 (2006).
12. Braga, A., Gime´nez, S., Concina, I., Vomiero, A. & Mora-Sero´, I. Panchromatic sensitized solar cells based on metal sulfide quantum dots grown directly on nanostructured TiO2electrodes. J. Phys. Chem. Lett. 2, 454–460 (2011). 13. Zhou, N. et al. Highly efficient PbS/CdS co-sensitized solar cells based on
photoanodes with hierarchical pore distribution. Electrochem. Commun. 20, 97–100 (2012).
14. Hyun, B.-R. et al. Electron injection from colloidal PbS quantum dots into titanium dioxide nanoparticles. ACS Nano 2, 2206–2212 (2008).
15. Lee, H. et al. PbS and CdS quantum dot-sensitized solid-state solar cells: ‘‘old concepts, new results’’. Adv. Funct. Mater. 19, 2735–2742 (2009).
16. Funasaka, K. et al. Detection of Pb-LIII edge XANES spectra of urban atmospheric particles combined with simple acid extraction. Sci. Total Environ. 403, 230–234 (2008).
17. Zaman, K. M., Blue, L. Y., Huggins, F. E. & Atwood, D. A. Cd, Hg, and Pb compounds of benzene-1,3-diamidoethanethiol (BDETH2). Inorg. Chem. 46, 1975–1980 (2007).
18. Briggs, D. & Seah, M. P. Practical Surface Analysis by Auger and X-ray photoelectron spectroscopy. John Wiley & Sons, Chichester, UK, (1990). 19. Taniguchi, S., Green, M. & Lim, T. The room-temperature synthesis of anisotropic
CdHgTe quantum dot alloys: a ‘‘molecular welding’’ effect. J. Am. Chem. Soc. 133, 3328–3331 (2011).
20. Zhou, F., Kang, K., Maxisch, T., Ceder, G. & Morgan, D. The electronic structure and band gap of LiFePO4and LiMnPO4. Solid State Commun. 132, 181–186 (2004).
21. Ardalan, P. et al. Effects of self-assembled monolayers on solid-state CdS quantum dot sensitized solar cells. ACS Nano 5, 1495–1504 (2011).
22. Carlson, B., Leschkies, K., Aydil, E. S. & Zhu, X.-Y. Valence band alignment at cadmium selenide quantum dot and zinc oxide (1010) interfaces. J. Phys. Chem. C 112, 8419–8423 (2008).
23. Yoshihara, T. et al. Identification of reactive species in photoexcited
nanocrystalline TiO2films by wide-wavelength-range (400–2500 nm) transient absorption spectroscopy. J. Phys. Chem. B 108, 3817–3823 (2004).
24. Ellingson, R. J. et al. Dynamics of electron injection in nanocrystalline titanium dioxide films sensitized with [Ru(4,49-dicarboxy-2,29-bipyridine)2(NCS)2] by infrared transient absorption. J. Phys. Chem. B 102, 6455–6458 (1998). 25. Peter, L. M. Dye-sensitized nanocrystalline solar cells. Phys. Chem. Chem. Phys. 9,
2630–2642 (2007).
26. Farrow, B. & Kamat, P. V. CdSe quantum dot sensitized solar cells. shuttling electrons through stacked carbon nanocups. J. Am. Chem. Soc. 131, 11124–11131 (2009).
27. Lagemaat, J. V. D., Park, N.-G. & Frank, A. J. Influence of electrical potential distribution, charge transport, and recombination on the photopotential and photocurrent conversion efficiency of dye-sensitized nanocrystalline TiO2solar cells: a study by electrical impedance and optical modulation techniques. J. Phys. Chem. B 104, 2044–2052 (2000).
28. Cherepy, N. J., Smestad, G. P., Gra¨tzel, M. & Zhang, J. Z. Ultrafast electron injection: implications for a photoelectrochemical cell utilizing an anthocyanin dye-sensitized TiO2nanocrystalline electrode. J. Phys. Chem. B 101, 9342–9351 (1997).
29. Tvrdy, K., Frantsuzov, P. A. & Kamat, P. V. Photoinduced electron transfer from semiconductor quantum dots to metal oxide nanoparticles. PNAS 108, 29–34 (2011).
30. Teo, B. K. EXAFS : Basic Principles and Data Analysis. Springer-Verlag, Berlin, (1986).
31. Tranquada, J. M. & Ingalls R. Extended x-ray-absorption fine-structure study of anharmonicity in CuBr. Phys. Rev. B 28, 3520–3528 (1983).
32. Zhu, K., Vinzant, T. B., Neale, N. R. & Frank, A. J. Removing structural disorder from oriented TiO2nanotube arrays: reducing the dimensionality of transport and recombination in dye-Sensitized solar cells. Nano Lett. 7, 3739–3746 (2007). 33. Mora-Sero´, I. & Gime´nez, S. Recombination in quantum dot sensitized solar cells.
Accounts Chem. Res. 42, 1848–1857 (2009).
34. Lich, S., Tenne, R., Flaisher, H. & Manassen, J. Cation effects on the electroche-mistry of anions in polysulfide photoelectrochemical cells. J. Electrochem. Soc. 133, 52–59 (1986).
35. Kim, M.-J. et al. Unusual enhancement of photocurrent by incorporation of Bro¨nsted base thiourea into electrolyte of dye-sensitized solar cell. J. Phys. Chem. C 114, 19849–19852 (2010).
36. Guijarro, N. et al. Uncovering the role of ZnS treatment in the performance of quantum dot sensitized solar cells. Phys. Chem. Chem. Phys. 13, 12024–12032 (2011).
37. Mane, R. S. & Lokhande, C. D. Chemical deposition method for metal chalcogenide thin films. Mater. Chem. Phys. 65, 1–31 (2000).
38. Choy, J.-H., Hwang, S.-J. & Park, N.-G. Intracrystalline structure of molecular mercury halide intercalated in high-TC superconducting lattice of
Bi2Sr2CaCu2Oy. J. Am. Chem. Soc. 119, 1624–1633 (1997).
Acknowledgements
This work was supported by the National Research Foundation of Korea (NRF) grant funded by the Ministry of Education, Science and Technology (MEST) of Korea under contracts No. 2012-0005601, R31-2008-10029 (WCU program) and the Global Frontier R&D Program on Center for Multiscale Energy System. J.-W.L. is grateful to global PhD fellowship grant from NRF under contract No. 2011-0008000. The experiments at Pohang Accelerator Laboratory (PAN) were supported in part by MEST and POSTECH.
Author contributions
N.-G.P. contributed to the conception and design of the experiment, analysis of the data and writing the manuscript with assistance of J.-W.L. J.-W.L. carried out design and synthesis of QD materials, preparation of the devices, device performance measurements. D.-Y.S. synthesized TiO2nanoparticles with different particle size. T.K.A. and H.-W.S. contributed
to the femto-second data analysis. S.S. and H.H. carried out femtosecond transient measurements. M.J.K. collected UPS data. I.Y.K. and S.-J.H. measured the extended x-ray absorption fine structure (EXAFS) at PAL and analyzed the EXZFS data.
Additional information
Supplementary informationaccompanies this paper at http://www.nature.com/ scientificreports
Competing financial interests:The authors declare no competing financial interests. License: This work is licensed under a Creative Commons
Attribution-NonCommercial-NoDerivs 3.0 Unported License. To view a copy of this license, visit http://creativecommons.org/licenses/by-nc-nd/3.0/
How to cite this article:Lee, J. et al. Quantum-Dot-Sensitized Solar Cell with Unprecedentedly High Photocurrent. Sci. Rep. 3, 1050; DOI:10.1038/srep01050 (2013).