IEG 환경지질연구정보센터
11
0
0
전체 글
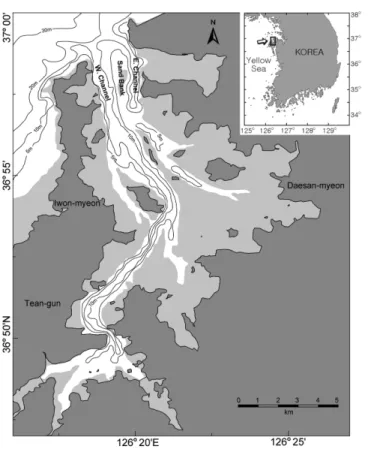
(2) 244. Hyung Rae Jo and Hee Jun Lee. Fig. 1. Map of the study area, Garolim Bay showing the location of sand bank between tidal channels. Water depths are relative to lowest low water level.. Fig. 2. Surface sediment distribution in Garolim Bay. Modified from Lee et al. (2004). Note sand distribution at the bay mouth.. surrounded by wide tidal flats. Sand and gravelly sand distribute in the sand bank, the flanking channels, and locally in the adjacent intertidal flats (Fig. 2). Muddy sand mainly occurs along the tidal channels. The intertidal flats mostly comprise sandy mud and mud. The sand of the bank is well to poorly sorted and very coarse to medium-grained (-0.32.0 φ). The sand bank shows a lenticular geometry in crosssection, overlying a generally flat basement; the thickness of unconsolidated sediments reaches 30–35 m under the bank crest (Shin, 1998). The physical processes in the bay are largely controlled by semi-diurnal and fortnightly variations of tides. Mean tidal range near the mouth is 6.39 m in spring tides and 2.86 m in neap tides (KORDI, 1981; Song et al., 1983). As the tides propagate into the bay, the tidal range slightly increases up to 6.85 m in spring and 3.06 m in neap tides at the bayhead (KORDI, 1981). Tidal currents are rectilinear with prevailing directions generally parallel to the bottom topography (KORDI, 1981). The channels in the inner bay show a dominance of ebb currents (Fig. 3). Whereas the two channels at the bay mouth are mutually evasive: flood-dominated eastern channel and ebb-dominated western channel (KORDI, 1981; Lee and Jo, 2003). Because of the narrow width, tidal currents are strongest at the mouth, reaching up to 1.8 m/sec at the surface (KORDI, 1981). In the western part of the mouth, clockwise water circulations are generated during. Fig. 3. Main flow directions in tidal channels. Arrows represent mean maximum velocities of flood and ebb currents, based on long-term current measurements by KORDI (1981). Note flood dominance at the mouth and ebb dominance in the inner bay..
(3) Sediment transport processes over a sand bank. 245. flood periods due to the effect of the headland to the west. Most of waves in the bay are locally wind-generated waves rather than swells propagated from offshore. Just off the mouth, high waves with a significant wave height larger than 1.5 m occur in late autumn through winter (October– March), when northwestly winds prevail (KORDI, 1981). Wave periods are mostly less than 9 seconds. The occurrence rate of waves with maximum height less than 0.5 m is 72.0% just off the mouth and increases to 92.1% at 1 km landwards from the mouth, indicative of a rapid dissipation of wave energy. There is little freshwater inflow into the bay except for summer rainy seasons, resulting in longitudinal salinity gradient of 1.0–2.5‰ (KORDI, 1981). 3. METHODS Hydrodynamic measurements were carried out at the bay mouth for a tidal cycle (12 hours) on April 19, 2002 (spring tide). The measurements were undertaken under mild meteorological conditions for the assessment of the prevailing tidal currents. The tidal currents were measured with a shipmounted ADP (1000 kHz, SonTek Inc.) along the transect. Fig. 5. Positions of current measurements on a tidal curve. Currents were measured with a ship-mounted ADP (acoustic Doppler profiler) crossing the bay mouth every 1 hour. Thick gray bars with number denote each ADP measurement.. crossing the bay mouth every 1 hour, each being completed within ca. 15 minutes (Figs. 4 and 5). The current data were recorded for 1 m-depth cells at a 10-second interval. Morphological surveys were conducted for a detailed bathymetric map of the sand bank and for the dimensions and orientations of the superposed bedforms. In April 2003, echo-sounder data were collected with a RESON’s NaviSound 215 system along transect lines of ca. 200 km long in total (Fig. 4). The transects were designed to be mostly longitudinal with respect to the sand bank, because sonar images achieved from the part of the sand bank show that the migration directions of surface bedforms are roughly parallel to the bank orientation (Lee and Jo, 2003). The longitudinal transects were densely spaced with a 100-m interval in general, allowing detailed mapping of bedform orientations. Hydrodynamic conditions during the surveys were of weak waves and the transition from spring to neap tides. Simultaneously with the morphological surveys, 94 surface sediment samples were collected to reveal the grain size characteristics of surface sediment of the sand bank. Grain size analysis was performed by dry sieving and using Sedigraph 5100 for coarse and fine fractions, respectively. 4. RESULTS 4.1. Hydrodynamics. Fig. 4. Map showing the locations of current measurements, morphological surveys, and surface sediment samples around the sand bank.. The results of ADP measurements show distinct current patterns over the sand bank. At the end of flood (profile 1, Fig. 6), the current speeds were 0.2–0.6 m/sec with relatively strong currents over the western flank of the sand bank. The currents flowed towards the SE, but a clockwise eddy formed over the western channel. During the maximum ebb currents (profile 4, Fig. 6), the currents flowed to.
(4) 246. Hyung Rae Jo and Hee Jun Lee. Fig. 6. Cross-sections from ADP measurements at the bay mouth, showing current speeds and directions on high tide, maximum ebb, low tide, and maximum flood. The blank on each cross-section depicts the morphology of sand bank. The currents show mutually evasive characteristics: ebb-dominance in the western channel and flood-dominance in the eastern channel.. the N–NW. Strong currents occurred in the western channel, showing maximum speed of ca. 1.5 m/sec. Over the eastern flank, the ebb currents showed a maximum speed of ca. 0.8 m/sec. At the end of ebb phase (profile 7, Fig. 6), the currents showed highly variable directions over the sand bank. The currents in the western channel flowed to the N–NE (ebb direction), but reversed towards the south (flood direction) in the easternmost part. The current speeds decreased remarkably to a range of 0.2–0.4 m/sec. During the maximum flood currents (profile 11, Fig. 6), the currents flowed to the SE in general with a clockwise eddy over the western channel. The current speeds increased significantly to a range of 0.2–0.8 m/sec with a maximum speed of ca. 1 m/sec over the eastern flank. The currents over the western flank showed a maximum speed of ca. 0.9 m/sec. The maximum flood and ebb currents are thought to be. most responsible for bedload transport on the sand bank. They are examined in more detail in terms of along-bank (positive to the NW) and cross-bank (positive to the NE) components of depth-averaged velocities (Fig. 7). The depth-averaged maximum flood and ebb currents showed directions of SSE and NNW, respectively, oblique to the sand-bank orientation (55°–235°) at the bay mouth. This means that the flood current approached the bank crest from the NE and the ebb current from the SW. The along-bank component of maximum flood current was ca. 0.8 m/sec over the eastern flank and reduced significantly as the flow approached the crest (Fig. 7a). The cross-bank component displayed similar but less distinct spatial variations. As the flow left the crest, both along- and cross-bank components increased rapidly over the western flank. In the westernmost part of transect, the currents weakened significantly.
(5) Sediment transport processes over a sand bank. 247. Fig. 7. Along-bank (Uab, positive towards the NW) and cross-bank (Ucb, positive towards the NE) components of depth-averaged currents on (a) maximum flood and (b) maximum ebb, together with current directions and sand-bank morphology. Water depths are relative to lowest low water level.. and reversed in direction due to the development of an eddy. During the maximum ebb current, the along- and cross-bank velocities were highest in the western channel and both decreased significantly over the western flank as the flow approached the crest (Fig. 7b). As the flow left the crest, along-bank component showed a distinct increase over the eastern flank, although cross-bank component did not increase significantly. 4.2. Bedload Sediment Transport Bedload transport rates (kg·m-1·s-1) were calculated, following the method by Soulsby (1997). The data used for the calculation are depth-averaged velocities from ADP measurements and median grain size (d50, 0.55 mm) of surface sediment samples acquired near the ADP transect. The calculated transport rates varied considerably depending on current speeds. Strong ebb (profiles 3 and 4) and flood (profiles 10 and 11) currents resulted in much higher bedload transport rates than weak tidal currents of other profiles; the transport rates during near slack waters (profiles 1, 6, and 7) were calculated at zero or nearly zero. Figures 8 and 9 show bedload transport rates during maximum ebb (profile 4) and flood (profile 11) currents, respectively, which are most responsible for the sediment movement on the sand bank. During the maximum ebb current, bedload transport rates were significantly high (up to ca. 0.5 kg·m-1·s-1) in the western channel and decreased rapidly on the western flank toward the bank crest, resulting in no sediment movement on the crest (Fig. 8). The crestward decrease. on the western flank is distinct in both along- and crossbank components. On the eastern flank and channel, the transport rates increased slightly to less than 0.05 kg·m-1·s-1, which is much less than those in the western channel. In contrast, the maximum flood current produced relatively high transport rates (max. 0.14 kg·m-1·s-1) on the eastern flank (Fig. 9). As the flow approached the bank crest, it resulted in decreasing transport rates toward the crest on the eastern flank and eventually no sediment movement on the crest. Both the along- and cross-bank components showed crestward decrease, although the decrease is more distinct in along-bank component. On the western flank, the transport rates increased to ca. 1.0 kg·m-1·s-1 because current speed increased as the flow left the bank crest. In the western channel, transport rates were calculated at zero due to weak current related to eddy development. The resultant bedload transport pattern over a tidal cycle is characterized by opposite directions of net sand movement on either side of the bank; sand moved to the SE (flood direction) on the eastern flank and channel whereas to the N–NNW (ebb direction) on the western flank and channel (Fig. 10). It is also notable that the cross-bank component of residual bedload transport rates showed a convergence toward the bank crest: northeastward (+) on the western flank and southwestward (-) on the eastern flank. 4.3. Morphology and Surface Bedforms The sand bank is present between mutually evasive channels, i.e., the ebb-dominant western and flood-dominant.
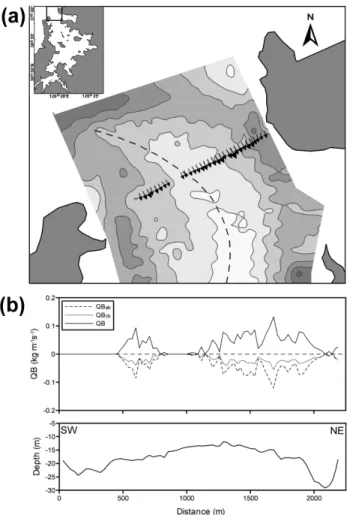
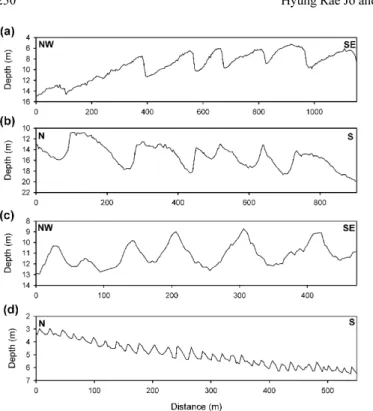
(6) 248. Hyung Rae Jo and Hee Jun Lee. Fig. 8. Instantaneous bedload transport rates on maximum ebb. (a) Vectors of bedload transport rates. Dashed line denotes the crest of sand bank. (b) Bedload transport rates (QB) and their along(QBab) and cross-bank (QBcb) components. The rates are highest in the western channel due to strong ebb current and reduce towards the crest. Note that the cross-bank component (+, northeastwards) decreases towards the crest on the western flank, suggestive of sediment transport and accumulation towards the crest.. Fig. 9. Instantaneous bedload transport rates on maximum flood. (a) Vectors of bedload transport rates. (b) Bedload transport rates (QB) and their along- (QBab) and cross-bank (QBcb) components. The rates are highest on the eastern flank and reduce towards the crest. Note that the cross-bank component (−, southwestwards) decreases crestwards on the eastern flank, suggestive of sediment transport and accumulation towards the crest.. eastern channels (Fig. 11). The bank is approximately 6 km long and up to 2 m high above the lowest low water level. The flanking channels are ca. 25 m in maximum depth. The western channel extends southwards to the bayhead, whereas the eastern channel terminates near the southern end of the bank. The axis of the bank has a N–S orientation in general but turns to NW–SE direction in its northern part (Fig. 11). The northern part of the bank is relatively broad and shows a slightly steeper eastern slope and a gentle western slope. The narrow southern part, however, has a steeper western slope and a gentle eastern slope. The southern end of the bank is linked to the other sand bodies near Woo-do (island), where the eastern channel terminates. The bedforms on and around the sand bank are examined for bedload transport pathways, using echo sounding profiles. The bedforms are classified into small (spacing, 0.6– 5 m), medium (5–10 m), and large (10–100 m) dunes, fol-. lowing the Ashley’s (1990) scheme (Fig. 12). Some dunes exceed 100 m in wavelength (up to 165 m) and reach 4.4 m in height. The large dunes develop almost entirely over the sand bank and the flanking channels (Fig. 13). The medium and small dunes are restricted to the higher part of the bank and a shallow channel east of Woo-do. The decreased dune size in these areas can be attributed to the finer grain size (mean grain size, 1.34–2.04 φ), shallow depth, and/or weak currents. The asymmetry of dunes and their migration directions were determined and mapped, based mainly on the longitudinal profiles and more precisely with the aid of transverse profiles (Fig. 13). The sediment transport pathways inferred from the dune asymmetry largely rely on the large dunes because they dominate over the sand bank and are believed to represent long-term sediment transport, not changing their asymmetry with reversing tidal flows (Dalymple and Roads, 1995; Mallet et al., 2000)..
(7) Sediment transport processes over a sand bank. Fig. 10. Residual bedload transport rates over a tidal cycle. (a) Vectors of residual bedload transport. (b) Residual bedload transport rates (QB) and their along- (QBab) and cross-bank (QBcb) components. Note mutually evasive sediment transport and bedload convergence towards the crest depicted by the spatial variations in cross-bank component.. Most of the large dunes show distinct asymmetric profiles, indicating the dune migration by dominant flood or ebb flow (Fig. 12). The flood-oriented large dunes occur in the eastern channel and most of the northern part of the bank (Fig. 13). In contrast, the ebb-oriented large dunes are present along the western channel and the western flank of the bank. The southern higher part of the bank is dominated by ebb-oriented, small and medium dunes (Fig. 13). In the transitional zone between the flood- and ebb-oriented dune fields, dunes do not show distinct asymmetry and commonly have symmetric profiles (Fig. 12c). The transitional zones occur on the lower western flank of the northern part and the crest area in the middle part of the bank (Fig. 13). The E-W-trending sand body south of the bank is also such a transitional zone characterized by the development of symmetric dunes, representing a convergence between the flood-oriented dunes to the north and the ebb-oriented dunes to the south. This distribution pattern of dune asym-. 249. Fig. 11. Detailed bathymetric map of sand bank with the locations of echo-sounder profiles shown in Figure 12 (thick lines with Alphabet). Dashed line denotes the crest of sand bank. Contours in meters (relative to lowest low water level).. metry allows defining a net sediment transport pathways over the sand bank during more than a tidal cycle and possibly more than a fortnightly cycle. The sediment transport pattern is chiefly defined as flood-oriented transport in the eastern side and ebb-oriented transport in the western side. 5. DISCUSSION Sand banks and linear sand ridges are classified as three types: (1) open-shelf ridges, (2) estuary-mouth banks, and (3) headland-associated banks (Dyer and Huntley, 1999). The estuary-mouth banks are further divided into those at wide mouths of funnel-shaped estuaries and those at narrow mouths (tidal inlets) constricted by barrier islands. The sand bank at the mouth of Garolim Bay, which is an embayment submerged during the Holocene transgression (Chough et al., 2000), is similar geomorphologically to estuary-mouth banks, but is different in physical processes from them..
(8) 250. Hyung Rae Jo and Hee Jun Lee. Fig. 12. Echo-sounder profiles showing large and medium dunes superposed on the sand bank. (a) Large dunes with flood-oriented asymmetry. (b) Large dunes with ebb-oriented asymmetry. (c) Large dunes with symmetric profiles. (d) Medium dunes with ebboriented asymmetry. For the locations of profiles, see Figure 11.. Sand banks at tidal inlets occur in wave-dominated environments with micro- to meso-tidal ranges. They commonly occur as a pair of flood and ebb tidal deltas landward and seaward of the tidal inlets, respectively. Although strong tidal currents at narrow inlets enough to transport sand are necessary for the formation of sand banks, waves have more important role on sand bank morphology (Dyer and Huntley, 1999). The estuaries with a wide mouth are linked to large rivers, which discharge a significant volume of freshwater. Sand transport in such estuaries is controlled by both tidal currents and river flows (Dalrymple and Choi, 2007). River flows decrease in strength in a seaward direction. On the contrary, tidal currents become stronger landwards due to the funnel-shaped geometry of estuaries (hypersynchronous system). “Tidal maximum” with maximum tidal-current speed occurs near the apex of the funnel geometry. Bedload convergence zone between an inner, fluvial-dominated portion with net seaward transport and an outer, tide-dominated portion with net landward transport lies landward of the main coastline, i.e., within the lower reach of fluvial channels downstream of tidal limit. As a result, most area of the estuaries is characterized by net landward sand transport (flood dominant), giving rise to up-estuary migration of tidal sand bars or sand banks (Dalrymple and Choi, 2007). Fluctuations in river flows can influence significantly on. Fig. 13. Bedload transport pattern inferred from dune asymmetries. Symmetric dunes are marked by arrows with heads at both ends. Note clockwise sediment transport and convergence of bedload transport characterized by the development of symmetric dunes.. the location of bedload convergence and net transport direction within the estuaries (Berne et al., 1993; Dalrymple and Choi, 2007). In contrast to the funnel-shaped estuaries, Garolim Bay has a pot-like shape with a narrow mouth and a wider inner part. Tidal currents in Garolim Bay show maximum speed at the mouth because of its narrow width (KORDI, 1981; Song et al., 1983). As the bay is not linked to major rivers, there is little freshwater inflow except for summer rainy seasons, suggestive of minimal influence of river flows on bedload transport. The nature of bedload transport and the location of bedload convergence in the bay, thus, can be different from those in funnel-shaped estuaries. The source of sand is interpreted to be outside the bay, based on the distribution and the transport pattern of sand. The sand area extends out of the bay, but terminates in the middle bay (Fig. 2), suggestive of sand supply into the bay from outside. As revealed by this study, flood-oriented sand.
(9) Sediment transport processes over a sand bank. transport is dominant in the eastern part of the bay mouth, where sand distribution extends outside the bay. The sand delivered into the bay accumulates at the bay mouth, forming the sand bank; the sand distribution terminates around the southern end of the bank. The location of sand accumulation appears to be controlled by the pattern of maximum tidal currents (Fig. 3). Flood currents are dominant at the mouth except for a narrow zone of the western channel. In the inner bay, however, tidal channels are characterized by ebb dominance. The eastern channel of flood dominance at the bay mouth changes to a ebb-dominant channel near the southern end of the bank, where flood-oriented dunes converge with ebb-oriented dunes (Fig. 13). This transition of tidal currents seems to prevent sand from being transported further southwards, facilitating sand accumulation at the bay mouth. The comparison between the bathymetries of 1977 and 2003 reveals that the sand bank has remained stationary at the present location for last 25 years (Fig. 14). This suggests that the sand bank is in a dynamic equilibrium. Consequently the bedload convergence zone in Garolim. Fig. 14. Comparison between 10.5-m contours of 1977 and 2003 revealing the location of sand bank unchanged for last 25 years. Water depth relative to lowest low water level.. 251. Bay, which can be indicated by sand accumulation, appears to occur more seawards compared with that in funnel-shaped estuaries. The formation and maintenance of sand banks are associated with crestward convergence of sediment transport. Many theoretical models have been provided for the processes relevant to sand-bank dynamics: the helical flow concept (Houbolt, 1968; Off, 1983), the bed shear stress stability model (Smith, 1969), the tidal stirring concept (Pingree, 1978), and the seabed stability model (Huthnance, 1982). Most of these models have, however, been criticized as inappropriate for explaining sand-bank dynamics by theoretical considerations and field measurements. Helical flows counterotating on the sides of sand banks can produce convergence of sediment transport toward the crest (Houbolt, 1968; Off, 1983). But the scale and intensity of such flows are considered to be much smaller than the scale of sand banks and the intensity of main tidal flows (Dyer and Huntley, 1999; Snedden and Darlymple, 1999). A phase lag between bed stress and bed topography on transverse bedforms gives rise to erosion upstream and deposition downstream of the crest with inverted processes for reversing flows, resulting in tide-averaged sediment transport toward the crest (Smith, 1969). This process is, however, relevant at the scale of sand waves but negligible for larger sand banks (Soulsby, 1983; Hulscher, 1996). Residual eddies and/or transient eddies associated with coastal irregularities (e.g., headlands) can produce the convergence of sediment transport toward the center of eddies (Pingree, 1978). However this process does not appear to be a dominant mechanism for sand-bank formation and maintenance because residual flows are much weaker than instantaneous flows and the eddies are highly transient over the tidal cycle with intensity and location of the eddies varying rapidly (Dyer and Huntley, 1999; Bastos et al., 2004). Seabed stability model of Huthnance (1982) predicts sediment accumulation along the bank crest as a result of the interaction between hydrodynamic conditions and bank morphology. The model explains that sand banks grow obliquely to main tidal flows. As the flow approaches obliquely the bank crest, the along-bank component of the flow decreases due to the friction by the bank and the cross-bank component increases by continuity. The tidal flow thus veers toward the bank crest. For reversing tidal flow, crestward flow veering occurs on the opposite side of bank in the same way. As a result, sediment transport converges toward the crest. The Huthnance’s (1982) model is thought to be the most advanced theory for explaining the dynamics of sand banks (Dyer and Huntley, 1999). The crestward flow veering and resultant sediment convergence have been observed on various types of sand banks such as open-shelf sand ridges, shoreface-connected ridges, and headlandassociated banks (e.g., van de Meene and van Rijn, 2000; Bastos et al., 2004). Compared with other types of sand.
(10) 252. Hyung Rae Jo and Hee Jun Lee. banks, estuary-mouth banks have been less studied in terms of sediment dynamics (Dyer and Huntley, 1999). The SaintGeorges Bank at the mouth of the Gironde Estuary, SW France was studied to reveal sediment transport processes responsible for the maintenance of the sand bank (Mallet et al., 2000). The bank develops between mutually evasive tidal channels, oriented anticlockwise with respect to main tidal flows. The sand bank is maintained by a clockwise residual transport with a crestward convergence, controlled by depth-averaged main tidal flows. Although the authors conclude that the Huthnance’s (1982) model is the most reliable theory to explain the sand-bank dynamics, their conclusion is not supported by field data; the tidal flows over the bank were not measured and flow veering was not observed. Morphological surveys and hydrodynamic measurements in the study area give an opportunity to examine the sediment dynamics of a sand bank occurring at the narrow mouth of semi-enclosed embayment, which does not correspond to the sand-bank types of Dyer and Huntley’s (1999) classification. Similar to estuary-mouth banks, the sand bank in Garolim Bay occurs between mutually evasive tidal channels. The sand bank lies obliquely to main tidal flows with an anticlockwise angle. Flood flows approach obliquely the bank through the eastern flank and ebb flows through the western flank, which is similar to the condition inducing a crestward veering of tidal flows (Huthnance, 1982). As predicted by Huthnance (1982), the along-bank component of tidal flows reduces when the flows approach the crest (Fig. 7). The cross-bank component, however, decreases rather than increases as the model predicts. Consequently, the tidal flows do not show a crestward veering. The Huthnance’s model, thus, appears to be inapplicable to the sand bank in Garolim Bay. This is probably due to the influence of coast close to the sand bank and/or the confinement within the narrow bay mouth. In some sand banks close to coastlines (e.g., headland-associated banks and shoreface-connected ridges), crestward flow veering has been observed only partially over a tidal cycle, although this mechanism, combined with other processes, has played an important role on crestward sediment convergence (van de Meene and van Rijn, 2000; Bastos et al., 2004). The seabed stability model of Huthnance (1982) is thought to be most appropriate for open-shelf ridges (Dyer and Huntley, 1999). Although crestward flow veering does not occur over the sand bank in Garolim Bay, mutually evasive tidal currents flowing obliquely to the bank axis result in a convergence of flood- and ebb-oriented bedload transport around the crest. The bedload convergence is verified by the spatial variations in the cross-bank component of bedload transport rates. During maximum flood current, high transport rates occur on the eastern flank with southwestward (crestward) cross-bank component (Fig. 9b). The cross-bank compo-. nent reduces towards the crest, followed by no sediment movement; this is suggestive of sediment accumulation around the crest. The maximum ebb current produces high transport rates on the western flank with a northeastward (crestward) cross-bank component (Fig. 9a). The decrease of cross-bank component towards the crest, followed by no sediment transport, is also indicative of sediment accumulation on the crest. The resultant residual transport rates over a tidal cycle clearly exhibit mutually evasive bedload transport separated roughly by the bank crest (Fig. 10a). The cross-bank component of residual transport rates shows net bedload transport southwestwards on the eastern flank and northeastwards on the western flank, indicative of bedload convergence towards the crest (Fig. 10b). The sediment transport pattern indicated by large dunes represents a long-term sediment transport over more than fortnightly tidal cycles (Mallet et al., 2000). The large bedforms in Garolim Bay show a clockwise bedload transport pattern around the bank (Fig. 13). The pattern generally coincides with that predicted by residual transport rates over a tidal cycle, but reveals larger area of flood-oriented transport at the bay mouth. This is interpreted as the result of wave actions. Current data were acquired under calm weather conditions. The bedload transport rates calculated from these data, thus, represent those almost produced by tidal currents. Morphological surveys were performed in April soon after windy winter season. Strong northwestly winds prevail the west coast during winter, resulting in frequent storm days and increased wave heights. The wave measurements just off the bay mouth actually show a significant increase of wave heights from October to March (KORDI, 1981). This increased wave action should enhance the shear stress exerted to seabed (Soulsby, 1997; Lee and Jo, 2003; Lee et al., 2004). As the waves propagate towards the SE because of the northwestly winds (KORDI, 1981), flood-oriented bedload transport is likely to be accentuated (Soulsby, 1997; Li and Amos, 2001). The predominance of flood-oriented dunes at the bay mouth has probably resulted from the combined effect of waves and currents during winter. Although it is presumed that waves have an important effect on bedload transport at the bay mouth during winter, further studies are needed for the quantitative assessment of the effect of waves on the sand-bank dynamics. 6. CONCLUSIONS A sand bank is present between mutually evasive tidal channels at the mouth of Garolim Bay, west coast of Korea, which is a macrotidal, semi-enclosed embayment with a narrow entrance. The sand bank is different in environmental settings and sediment transport processes from the sandbank types of Dyer and Huntley’s (1999) classification, although similar to estuary-mouth banks. Sand delivered into the bay through the flood-dominant, eastern channel.
(11) Sediment transport processes over a sand bank. accumulates in the bay-mouth area, not transferred further southwards due to ebb-dominance in the channels of inner bay. The zone of bedload convergence in the bay scale, which can be indicated by sand accumulation, appears to lie near the mouth, more seawards compared with that in funnel-shaped estuaries. The formation and maintenance of the sand bank is principally governed by main tidal currents flowing obliquely to the bank axis. Flood-oriented bedload transport on the eastern flank and ebb-oriented transport on the western flank produce a clockwise sand circulation and converge around the bank crest. Flow veering towards the crest is not distinct, suggestive of the limitations of applying seabed stability model to the sand banks close to coastlines. Although tidal currents are thought to be the principal processes responsible for the formation and maintenance of the sand bank, waves generated by northwestly winter winds also seem to play an important role on the bank dynamics by enhancing flood-oriented sediment transport at the bay mouth. ACKNOWLEDGMENTS: This study was supported by the Korea Research Foundation Grant funded by the Korean Government (MOEHRD, Basic Research Promotion Fund) (KRF-2005-003-C00170) and partly through a basic research program of the Korea Ocean Research & Development Institute (Grant PE9811A). We thank K. Choi and an anonymous reviewer for their helpful reviews of the manuscript.. REFERENCES Ashley, G.M., 1990, Classification of large-scale subaqueous bedforms: a new look at an old problem. Journal of Sedimentary Petrology, 60, 160−172. Bastos, A.C., Paphitis, D., and Collins, M.B., 2004, Short-term dynamics and maintenance processes of headland-associated sandbanks: Shambles Bank, English Channel, UK. Estuarine, Coastal and Shelf Science, 59, 33−47. Berné, S., Castaing, P., Le Drezen, E., and Lericolais, G., 1993, Morphology, internal structure, and reversal of asymmetry of large subtidal dunes in the entrance to Gironde Estuary (France). Journal of Sedimentary Petrology, 63, 780−793. Chough, S.K., Lee, H.J., and Yoon, S.H., 2000, Marine Geology of Korean Seas. Elsevier, New York, 313 p. Dalrymple, R.W. and Rhodes, R.N., 1995, Estuarine dunes and bars. In: Perillo, G.M.E. (ed.), Geomorphology and Sedimentology of Estuaries. Elsevier Science, Amsterdam, p. 359−422. Dalrymple, R.W. and Choi, K., 2007, Morphologic and facies trends through the fluvial-marine transition in tide-dominated depositional systems: a schematic framework for environmental and sequence-stratigraphic interpretation. Earth-Science Reviews, 81, 135−174. Dalrymple, R.W., Knight, R.J., Zaitlin, B.A., and Middleton, G..V., 1990, Dynamics and facies model of a macrotidal sand bar complex. Sedimentology, 37, 577−612. Dyer, K.R. and Huntley, D.A., 1999, The origin, classification and modeling of sand banks and ridges. Continental Shelf Research, 19, 1285−1330.. 253. Houbolt, J.J.H.C., 1968, Recent sediments in the Southern Bight of the North Sea. Geologie en Mijnbouw, 47, 245−273. Hulscher, S.J.M.H., 1996, Tidal-induced large-scale regular bed form patterns in a three-dimensional shallow water model. Journal of Geophysical Research, 101, 20727−20744. Huthnance, J.M., 1982, On one mechanism forming linear sandbanks. Estuarine and Coastal Marine Science, 14, 19−99. KORDI, 1981, Hydrographical, Meteorological, Geophysical, Sedimentological, Ecological Surveys and Tide Model Study. Report BSPI 00027-47-2, Korea Ocean Research and Development Institute, 308 p. Lee, H.J. and Jo, H.R., 2003, Sedimentological and hydrodynamical monitoring of modern sediments in Garolim Bay on the west coast of Korea. Workshop on Sedimentation in the Yellow Sea Coasts (Expanded Abstract), Seoul, Oct. 30-31, p. 323−344. Lee, H.J., Jo, H.R., Chu, Y.S., and Bahk, K.S., 2004, Sediment transport on macrotidal flats in Garolim Bay, west coast of Korea: significance of wind waves and asymmetry of tidal currents. Continental Shelf Research, 24, 821−832. Li, M.Z. and Amos, C.L., 2001, SEDTRANS96: the upgraded and better calibrated sediment-transport model for continental shelves. Computers & Geosciences, 27, 619−645. Mallet, C., Howa, H.L., Garlan, T., Sottolichio, A., and Le Hir, P., 2000, Residual transport model in correlation with sedimentary dynamics over an elongate tidal sandbar in the Gironde Estuary (southwestern France). Journal of Sedimentary Research, 70, 1005−1016. Off, T., 1983, Rhythmic linear sand bodies caused by tidal currents. Bulletin of the American Association of Petroleum Geology, 47, 324−341. Pingree, R.D., 1978, The formation of the Shambles and other banks by tidal stirring of the seas. Journal of Marine Biological Association, 58, 211−226. Shin, D.H., 1998, Sedimentary Environments and Holocene SeaLevel Fluctuations in the Garolim Bay Tidal Flats, West Coast of Korea.. Ph.D. thesis, Inha University, Incheon, 193 p. (in Korean) Smith, J.D., 1969, Geomorphology of a sand ridge. Journal of Geology, 77, 39−55. Snedden, J.W. and Dalrymple, R.W., 1999, Modern shelf sand ridges: historical review of modern examples and a unified model of ridge origin and evolution. In: Bergman, K.M. and Snedden, J.W. (eds.), Isolated Shallow Marine Sand Bodies: Sequence Stratigraphic Analysis and Sedimentologic Interpretation. SEPM, Special Publication, 64, 13−28. Song, W., Yoo, D., and Dyer, K.R., 1983, Sediment distribution, circulation and provenance in a macrotidal bay: Garolim Bay, Korea. Marine Geology, 52, 121−140. Soulsby, R., 1983, The bottom boundary layer of shelf seas. In: Johns, B. (ed.), Physical Oceanography of Coastal and Shelf Seas. Elsevier, Amsterdam, p. 189−266. Soulsby, R., 1997, Dynamics of Marine Sands: A Manual for Practical Applications. Thomas Telford, London, 249 p. van de Meene, J.W.H. and van Rijn, L.C., 2000, The shoreface-connected ridges along the central Dutch coast — part 1: field observations. Continental Shelf Research, 20, 2295−2323. Manuscript received April 3, 2008 Manuscript accepted June 28, 2008.
(12)
수치


+2
관련 문서
정부주도의 제도개편처럼 하루아침에 상황을 바꾸는 식의 변화가 아니라“잃어버린 10 년”동안 꾸준히 그리고 천천히 진행되어옴으로써 아무도 잘 알아차릴 수
?IP 주소 자원 소모, MN의 부담이 크다 but FA없이 mobile IP 구현.?. 한국과학기술원
うち借用金 7.5 兆円 期間5年超が 41% 約 3.1 兆円 2,000 億円 うち自行債券 3.0 兆円 期間5年超が 9,718 億円 約 1.0 兆円 4,400 億円
기업집단 유동성 계열사별 현금 및 현금등가물 합의 기업집단 자산에 대한 비율 기업집단 부채비율 계열사별 부채의 합의 기업집단 자산에
[r]
시험의 중요한 포인트이므로 놓치시면 안됩니다... 따라서 탄산음료시장의 거 래량은
[r]
22 收回投资所收到的现金 수회투자소수도적현금 투자자산의 처분 23 取得投资收益所收到的现金 취득투자수익소수도적현금 투자수익의 취득
