Assessment of metal artifacts in three-dimensional dental surface models derived by cone-beam
computed tomography
Objective: The aim of this study was to assess artifacts induced by metallic restorations in three-dimensional (3D) dental surface models derived by cone- beam computed tomography (CBCT). Methods: Fifteen specimens, each with four extracted human premolars and molars embedded in a plaster block, were scanned by CBCT before and after the cavitated second premolars were restored with dental amalgam. Five consecutive surface models of each specimen were created according to increasing restoration size: no restoration (control) and small occlusal, large occlusal, disto-occlusal, and mesio-occluso- distal restorations. After registering each restored model with the control model, maximum linear discrepancy, area, and intensity of the artifacts were measured and compared. Results: Artifacts developed mostly on the buccal and lingual surfaces. They occurred not only on the second premolar but also on the first premolar and first molar. The parametric values increased significantly with increasing restoration size. Conclusions: Metallic restorations induce considerable artifacts in 3D dental surface models. Artifact reduction should be taken into consideration for a proper diagnosis and treatment planning when using 3D surface model derived by CBCT in dentofacial deformity patients.
[Korean J Orthod 2014;44(5):229-235]
Key words: Cone-beam computed tomography, Three-dimensional surface model, Artifact, Metallic restoration
Wael Nabha
aYoung-Min Hong
aJin-Hyoung Cho
bHyeon-Shik Hwang
ba
Department of Orthodontics, School of Dentistry, Chonnam National University, Gwangju, Korea
b
Department of Orthodontics, School of Dentistry, Dental Science Research Institute, Chonnam National University, Gwangju, Korea
Received February 1, 2014; Revised March 17, 2014; Accepted March 18, 2014.
Corresponding author: Hyeon-Shik Hwang.
Professor and Chairman, Department of Orthodontics, School of Dentistry, Chonnam National University, Yongbong-ro 33, Buk-gu, Gwangju 500-757, Korea.
Tel +82-62-530-5841 e-mail [email protected]
*This research was supported by Basic Science Research Program through the National Research Foundation of Korea (NRF) funded by the Ministry of Education (NRF-2010- 0025828).
© 2014 The Korean Association of Orthodontists.
The authors report no commercial, proprietary, or financial interest in the products or companies described in this article.
This is an Open Access article distributed under the terms of the Creative Commons Attribution Non-Commercial License (http://creativecommons.org/licenses/by-nc/3.0) which permits unrestricted non-commercial use, distribution, and reproduction in any medium, provided the original work is properly cited.
pISSN 2234-7518 • eISSN 2005-372X
http://dx.doi.org/10.4041/kjod.2014.44.5.229
INTRODUCTION
Three-dimensional (3D) computed tomography (CT) provides accurate and detailed information for diag- nosis and treatment planning of dentofacial defor mities.
Although volume-rendered and multiplanar recon- structed images are mostly used, 3D surface models are more useful in some circumstances, such as evaluation of facial asymmetry
1,2and computer-assisted surgical simulation.
3-6Despite the many advantages of 3D CT, detailed occlusal and accurate interocclusal data cannot be obtained. Moreover, image quality is affected by artifacts induced by various factors such as beam hardening, extinction, scatter, noise, exponential edge gradient effect, aliasing, partial volume effect, and object motion.
7-10In particular, the quality is worsened by the existence of metals such as orthodontic brackets and dental restorations.
7,11,12To overcome this limitation, attempts have been made to combine maxillofacial CT images with digital dental models.
13-18In this method, the dental part of a CT image is replaced with a 3D dental surface model created by optical
14or laser scanning.
13,15-18Nevertheless, artifacts influence image accuracy when surface registration is used for the fusion.
14,18The purpose of this study was to assess artifacts induced by metallic restorations in 3D dental surface models derived by cone-beam computed tomography (CBCT).
MATERIALS AND METHODS
For this study, extracted human premolars and molars were prepared by removing soft tissue, residual
bone, and calculus and embedded in plaster blocks (15 specimens with four different teeth per specimen) such that their crowns were aligned as in the natural dentition. In each specimen, cavities of increasing size were prepared in the second premolar according to the standard methods
19and the tooth was restored with dental amalgam, as follows: no restoration (control), small occlusal restoration, large occlusal restoration, disto-occlusal restoration, and mesio-occluso-distal restoration (Figure 1). Five sequential scans were obtained with a CBCT scanner (Alphard Vega; Asahi Roentgen Ind. Co., Kyoto, Japan) before and after the restorations under the following conditions: 80 kV, 5 mA, 0.39 × 0.39 × 0.39 mm voxel size, and 200 × 179 mm field of view (FOV). The images were saved in Digital Imaging and Communication in Medicine (DICOM) format and imported into imaging software (InVivoDental 5.0; Anatomage, San Jose, CA, USA).
Then, 3D surface models were constructed by using segmentation threshold values ranging from 600 to 3,071 according to the program’s default function and converted to stereolithographic format.
To reveal artifacts, each restored model was regis- tered with the control model by using the iterative closest point algorithm
20in 3D reverse engineering software (Rapidform 2006; INUS, Seoul, Korea). The initial registration was performed by selecting three corresponding points on both models. Regional regi- stration was used to calculate rotation and tran sla tion from surface information of the two data sets. Cor- responding points and shapes were searched and their distance was minimized after rotation and translation.
Discrepancies between the models were shown by color mapping.
Figure 1. Illustration of the restorations. A, Small occlusal restoration; B, large occlusal restoration; C, disto-occlusal
restoration; D, mesio-occluso-distal restoration.
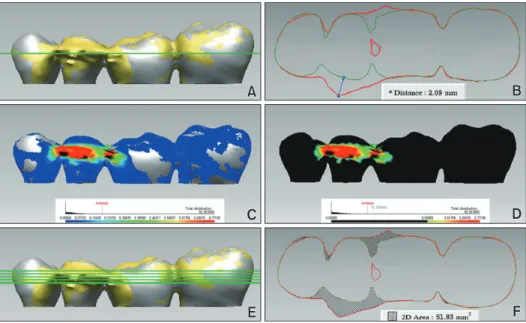
For quantitative assessment, maximum linear dis- crepancy, area, and intensity of artifacts were measured.
Maximum linear discrepancy was measured as the distance between shells at the most protruded point of the graphic (Figure 2A and 2B). Artifact area was defined as the area of discrepancy over 0.5 mm. The shell/shell
deviation function of the reverse engineering software was used to neglect discrepancies smaller than 0.5 mm.
The graphics were exported to image analysis software (Image-Pro Plus 4.1; Media Cybernetics, Bethesda, MD, USA), and artifact area in the buccal, lingual, and occlusal views was measured by using the area function
Figure 2. Quantitative assessment of artifacts on the basis of discrepancies of two models, each restoration model and no restoration model as the control. The present figures show the discrepancies between a mesio-occluso-distal restoration and the control. A and B, Maximum linear discrepancy was measured as the distance between the shells at the most protruded point of the graphic. C and D, Artifact area was defined as an area of discrepancy over 0.5 mm. E and F, Artifact intensity was defined as the sum of five discrepancy areas measured in cross-sectional graphics captured at the level of the maximum linear discrepancy and 0.5 and 1.0 mm above and below.
Figure 3. Color-mapped graphics obtained by registering three-dimensional surface models of the restorations with
the control (no restoration). Discrepancies between the shells indicate artifacts due to amalgam restoration. Blue and
red represent the minimum and maximum discrepancies, respectively. A, Small occlusal restoration; B, large occlusal
restoration; C, disto-occlusal restoration; D, mesio-occluso-distal restoration.
of the software (Figure 2C and 2D). Artifact intensity was determined from cross-sectional views at the level of the maximum linear discrepancy and 0.5 and 1.0 mm above and below. The cross-sectional graphics were exported to the image analysis software, and the area of discrepancy at each level was measured. The sum of the five areas was defined as artifact intensity (Figure 2E and 2F).
Statistical analysis
Data were presented as means and standard deviations.
One-way analysis of variance (ANOVA) was used to analyze parametric differences according to increasing restoration size, and the Tukey test was used for post- hoc comparisons. All analyses were carried out by the SPSS software program (version 18.0; SPSS Inc., Chicago, IL, USA).
RESULTS
Color mapping revealed artifacts in all cases. They were present not only on the second premolar but also
on the adjacent teeth and mostly on the buccal and lingual surfaces. On these surfaces, the artifacts showed a bridging pattern between the second premolar and the adjacent teeth. The extent of artifacts increased with increasing restoration size (Figure 3).
The maximum linear discrepancy was the least for the small occlusal restoration and the greatest for the mesio- occluso-distal restoration (Table 1), with significant differences among the models. Similarly, artifact area and intensity significantly increased with increasing restoration size (Tables 2 and 3, respectively).
DISCUSSION
A 3D surface model is influenced by several factors such as scan field and segmentation threshold value.
21This study used the specimen which consisted of extracted teeth. However, CBCT scans were performed in large FOV, 200 × 179 mm. It was because the FOV is commonly used for diagnosis of dentofacial deformities.
We wanted to simulate CBCT scans of actual patient as much as possible while we used the specimen. The
Table 1. Maximum linear discrepancy according to restoration size (unit: mm)
Small O restoration Large O restoration DO restoration MOD restoration Significance (p-value) Maximum discrepancy 0.3 ± 0.2
a0.6 ± 0.3
b1.2 ± 0.3
c2.1 ± 0.4
d< 0.001 Values are presented as mean ± standard deviation.
Different superscript letters indicate significant differences between groups.
O, Occlusal; DO, disto-occlusal; MOD, mesio-occluso-distal.
Table 2. Artifact area according to restoration size (unit: mm
2)
Small O restoration Large O restoration DO restoration MOD restoration Significance (p-value)
Buccal 0.6 ± 1.1
a5.2 ± 3.9
b32.4 ± 9.5
c48.3 ± 11.9
d< 0.001
Lingual 1.2 ± 1.4
a9.8 ± 6.1
b29.4 ± 10.9
c50.4 ± 12.8
d< 0.001
Values are presented as mean ± standard deviation.
Different superscript letters indicate significant differences between groups.
O, Occlusal; DO, disto-occlusal; MOD, mesio-occluso-distal.
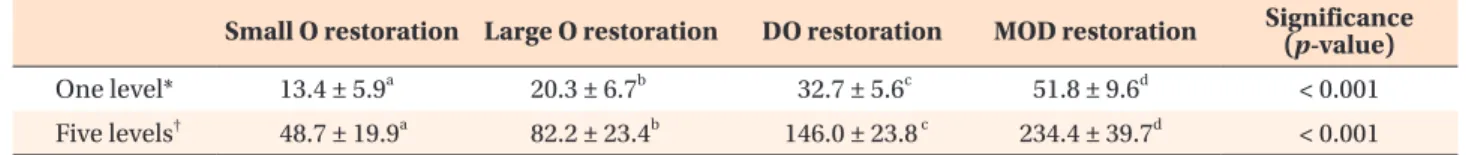
Table 3. Artifact intensity according to restoration size (unit: mm
2)
Small O restoration Large O restoration DO restoration MOD restoration Significance (p-value)
One level* 13.4 ± 5.9
a20.3 ± 6.7
b32.7 ± 5.6
c51.8 ± 9.6
d< 0.001
Five levels
†48.7 ± 19.9
a82.2 ± 23.4
b146.0 ± 23.8
c234.4 ± 39.7
d< 0.001 Values are presented as mean ± standard deviation.
Different superscript letters indicate significant differences between groups.
O, Occlusal; DO, disto-occlusal; MOD, mesio-occluso-distal.
*Discrepancy area measured at the level of the maximum linear discrepancy.
†