ABSTRACT
BACKGROUND/OBJECTIVES: The objective of this study was to examine factors affecting cooking behavior at home. We examined components of the theory of planned behavior, perception of cooking skills, and socio-demographic variables affecting cooking behavior at home.
SUBJECTS/METHODS: The study sample included 425 women raising elementary school children living in South Korea. They responded to an online structured questionnaire. The variables affecting cooking behavior at home were assessed using hierarchical regression analysis.
RESULTS: The frequency of cooking behavior at home was 14.1 meals per week. Most respondents showed an intention regarding cooking behavior. The average score for attitude toward cooking behavior at home was 15.1 points (scale of 1 to 25). Attitude and cooking behavior showed a significant positive correlation (P < 0.01, r = 0.22). The subjective norm was 14.6 points (scale of 1 to 25). The subjective norm showed a significant correlation with cooking behavior (P < 0.01, r = 0.18). The control belief was 2.8 points (scale of 1 to 5). The control belief and cooking behavior showed a significant correlation in all questions (P <
0.01, r = 0.25). The subjects were significant confident about their cooking skills, except for Kimchi. Perception of cooking skills showed a significant correlation with all questions concerning cooking behavior (P < 0.01, r = 0.30). Significant variables for predicting intention regarding cooking behavior were perception of cooking skills, employment status, income, and attitude. Significant variables for predicting cooking behavior were employment status, income, control belief, number of children, and behavioral intention.
CONCLUSIONS: In order to provide nutrition education to increase cooking behavior at home, it is necessary to have a positive attitude toward cooking behavior, increase control belief, and improve confidence related to cooking skills. Moreover, differentiated education based on the employment status of women is needed.
Keywords: Intention; attitude; belief; control
Original Research
Received: Jun 5, 2019 Revised: Aug 16, 2019 Accepted: Apr 6, 2020
§
Corresponding Author:
Ji Eun Kim
Department of Home Economics Education, Dongguk University, 123 Dongdae-ro, Gyeongju 38066, Korea.
Tel. +82-53-770-2528 Fax. +82-53-770-2527 E-mail. [email protected]
©2021 The Korean Nutrition Society and the Korean Society of Community Nutrition This is an Open Access article distributed under the terms of the Creative Commons Attribution Non-Commercial License (https://
creativecommons.org/licenses/by-nc/4.0/) which permits unrestricted non-commercial use, distribution, and reproduction in any medium, provided the original work is properly cited.
ORCID iDs Ji Eun Kim
https://orcid.org/0000-0001-6271-2300 Conflict of Interest
The author declares no potential conflicts of interests.
Other
This paper is part of the author's doctoral dissertation thesis.
Ji Eun Kim §
Department of Home Economics Education, Dongguk University, Gyeongju 38066, Korea
Factors affecting home cooking
behavior of women with elementary
school children applying the theory of
planned behavior
INTRODUCTION
Home-cooked meals have many benefits, such as reduction of excess energy, sugar, and fat intakes and increased vegetable and fruit ingestion compared to dining out [1]. Home- cooked meals can also increase ingestion of healthy and fresh foods and help prevent obesity [2,3]. Home-cooked meals are highly nutritional and are associated with a lower probability of overeating or unbalanced diet. Further, home-cooked meals use fresh ingredients, are safe, and have low risk of allergic reactions [4]. It has also been reported that lifespan can be extended by more frequent consumption of home-cooked meals [1]. In terms of the economic benefits, many studies have established that home-cooked meals save costs compared to dining out [5,6]. Home-cooked meals also have environmental benefits that help protect the environment since they do not use disposables [5]. Regarding emotional benefits, preparing meals at home can set a good example for children [6]. More frequent consumption of family meals is associated with fewer problematic behaviors in adolescence, including dramatic weight loss, drinking, and smoking. Lastly, children in households that ate family meals more often were found to be more satisfied with their lives [4].
Although home-cooked meals have many advantages, the number of homes preparing meals has been decreasing. Regarding Korean adults' eating patterns, the ratio of home meals decreased from 45.8% in 1998 to 38.1% in 2012, and the frequency of home-cooked meals decreased from 2.1 meals per day in 1998 to 1.7 meals per day in 2012. Moreover, ingestion of home-cooked meals decreased from 67.8% in 1998 to 55.7% from 2007 to 2009 [7]. In Korea, the time spent preparing meals was reported to be 3.7 hours per week. This is significantly lower than the average time worldwide, which was reported to be 6.5 hours [8].
Recently, more people have gained interest in home-cooked meals, often known as home meals, through public media. In a study that surveyed 2,000 adult men and women, consumers have increasingly realized that home meals are healthier than dining out and, as a result, have shown increased interest [9]. This signifies that more people are becoming interested in healthy meals and ingredients. Therefore, it is necessary to satisfy these needs and provide nutrition education to encourage people to cook more at home. To accomplish this, it is important to identify the factors that affect cooking behavior at home.
Most preceding studies [1,4,7,10,11] have focused on dining out, not on home-cooked meals.
In particular, it is even harder to find any studies on cooking behavior at home. According to a report that studied college students' cooking behavior at home, cooking behavior is affected by knowledge of cooking, cooking skills, expectations for outcomes of cooking, confidence, time, and physical·mental efforts [12]. Other studies have identified health, time, money, accessibility to fresh ingredients, pleasure of cooking, skills, and age as important factors that affect college students' cooking behavior [13]. Recent research on intention regarding cooking behavior studied college students' attitudes toward cooking and factors obstructing their cooking behavior based on the theory of planned behavior (TPB) [14]. As a result, factors affecting cooking behavior at home were found to be the subjective norm, control belief, and past cooking behavior. In Korea, there was a thesis written on the number of ingested home-cooked meals and dietary evaluation based on a national nutrition survey.
The study concluded that more frequent consumption of home-cooked meals contributed
to a healthier diet [3]. Other studies were mostly surveys and literature studies, and no study
in Korea has addressed cooking behavior at home in a theoretical sense. Therefore, it is
necessary to study cooking behavior at home based on established behavioral theory. In this
respect, this study was conducted to identify factors that affect cooking behavior at home based on the TPB.
The TPB asserts that one develops a behavioral intention in order to execute a behavior. This behavioral intention is determined by the attitude toward the behavior, subjective norm, and control belief [15]. Therefore, this study surveyed the intention regarding cooking behavior, attitude toward cooking behavior, subjective norm, and control belief in order to identify the factors that affect cooking behavior at home. Based on the findings of preceding studies, cooking skills [16] and general characteristics [5,12,13,17] were also included as factors that affect cooking behavior at home.
SUBJECTS AND METHODS
Participants
The subjects were 425 mothers raising elementary school children in South Korea who were recruited by an online survey firm. The online research company sent the questionnaire to the panel, after which they checked the respondents and conducted the survey after obtaining consent. The survey was conducted by the Seoul Metropolitan Government in 6 metropolitan cities, 5 provinces, 1 special self-governing city, and 1 special self-governing province according to the classification of Korea's administrative districts. The survey took place from December 13, 2017 through December 19, 2017. Mothers raising elementary school children had a
significant effect on their children's diets and showed a negative attitude toward cooking, which was perceived as tiresome [10]. Therefore, it was concluded that the mothers of elementary school students would be suitable subjects for studying cooking behavior at home.
Questionnaire development and contents
The first draft of the questionnaire was written based on preceding studies [1,2,5,14,16,18,19]
and a focus group interview with 25 women with elementary school children. The draft was used as a preliminary survey administered to 27 women raising elementary school children residing in Daegu Metropolitan City. Based on the preliminary survey, the questionnaires were revised and supplemented after a discussion with a professor of nutritional studies. The questionnaires were exempted from deliberation (DGU Institutional Review Board [IRB]
20170021-03) by the IRB of Dongguk University, Gyeongju Campus. The questionnaires addressed subjects' demographics, cooking behavior at home, intention regarding cooking behavior at home, attitude toward cooking behavior at home, subjective norms, control belief, and perception of cooking skills. The validity of the survey tool was discussed with the professor of nutrition in order to secure content validity.
The demographics of the subjects addressed subjects' age, occupation, level of education, number of children, income, length of marriage, spousal participation in dinner, and spousal participation in preparing meals in the form of 8 questions. Cooking behavior at home was measured based on the number of meals prepared by the subjects at home for 1 week.
Subjects were asked to rate their intention regarding cooking at home on the following day.
Attitudes toward cooking behavior at home were measured based on 18 questions about
beliefs and 18 questions about evaluation in the outcomes of cooking behavior. Questions
about attitude were constructed based on previous questions related to cooking behavior at
home [1,2,4-6]. For the attitudes, beliefs measured degree of belief in the outcome of the
cooking behavior, and the evaluation measured degree of evaluation in the outcome of the cooking behavior. Therefore, the questions on belief matched the questions on evaluation.
The scores for attitude were derived by multiplying the score for belief by the score for the corresponding evaluation. Higher scores mean a more positive attitude toward cooking behavior at home. The Cronbach's α value of attitude toward cooking behavior at home was 0.894. The questions asking for negative beliefs and evaluation were scored in a manner opposite to that of the positive questions.
The subjective norm toward cooking behavior at home was measured based on 6 questions each on normative belief and motivation to comply. The reference group of the subjective norm was composed of those who appeared in other studies [14,18,19] as influencers on cooking behavior. For the normative belief, the subjects were asked whether or not the reference group encourages cooking behavior at home, and the motivation to comply measured whether or not they would accept it when the reference group encourages cooking behavior at home. Therefore, the questions on normative belief matched the questions on motivation to comply. The score for the subjective norm was calculated by multiplying the score for the normative belief by the score for the corresponding motivation to comply.
Higher scores mean a greater effect of the surrounding reference groups on cooking behavior at home. The Cronbach's α value was 0.889.
The perceived behavior control was measured based on control beliefs, which were adopted after discussion with a nutrition professor. The control belief questions consisted of a difficult situation outlined in a prior study [5] related to cooking behavior. The control belief toward cooking behavior at home included various hardships that may occur while cooking and asked 10 questions as to whether or not the subjects would continue cooking even in those situations. Higher scores mean greater control. The Cronbach's α value was 0.860.
Perception of cooking skills was mostly measured based on cooking skills ability and cooking confidence, according to a previous study [16]. Therefore, perception of cooking skills consisted of 15 questions measuring the ability and confidence of subjects in terms of cooking skills and cooking methods for everyday food. Higher scores mean more advanced skills. The Cronbach's α value was 0.925.
The Likert's scale of 1 through 5 was used to measure the intention regarding cooking behavior at home, belief and evaluation, normative belief and motivation to comply, control belief, and perception of cooking skills. A score of 1 is the most negative response while 5 is the most positive response.
Statistical analysis
The data in the survey were analyzed using the SPSS WIN 24 program. The subjects' demographics were identified based on frequencies and descriptive statistics, and the Cronbach's α value was calculated to determine the reliability analysis of the questions.
Pearson's correlation analysis was conducted to address relativity between cooking behavior
at home and the factors. Then, t-test and analysis of variance were conducted to discuss
how the demographical factors affect attitude toward cooking behavior at home, subjective
norm, control belief, perception of cooking skills, intention regarding cooking behavior,
and cooking behavior. Hierarchical regression was conducted to clarify the factors affecting
intention toward cooking behavior and cooking behavior.
RESULTS
General characteristics
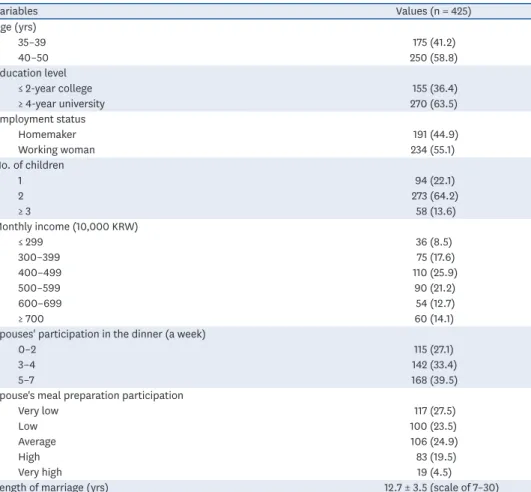
The subjects' general characteristics are listed in Table 1. The subjects' ages were between 35 and 39 (41.2%) and between 40 and 50 (58.8%) years. In terms of education, 63.5% had 4-year university degrees or higher, and 36.4% had associate 2-year college degrees or lower.
For occupation, 44.9% were homemakers, and 55.1% were working women. Moreover, 64.2% had 2 children while 22.1% had 1 child and 13.6% had 3 or more. In terms of family monthly income, 25.9% made between 4 and 4.99 million KRW, followed by between 5 and 5.99 million KRW (21.2%), 3 and 3.99 million KRW (17.6%), 7 million KRW or higher (14.1%), 6 and 6.99 million KRW (12.7%), and 2.99 million KRW or less (8.5%). For spousal participation in dinner, 39.5% showed an average of 5–7 times per week, whereas 33.4% showed 3–4 times and 27.1% showed 2 or fewer times. Based on these results, it was found that 70% or more spouses have dinner with their families at least 3 times per week.
Spouse's rate of participation in preparing meals indicated the subjective perception the survey subjects, and 27.5% responded ‘very low’, 23.5% ‘low’, 24.9% ‘average’, 19.5% ‘high’, and 4.5% ‘very high’. Based on these results, it was found that more spouses participate in the meal preparation process, whereas 51% of the subjects believe that their spouses are not sufficiently helpful with meal preparation. Only 24% responded that their spouses are helpful. The subjects were married for 12.7 years on average, ranging between 7 to 30 years.
Table 1. General characteristics of the subjects
Variables Values (n = 425)
Age (yrs)
35–39 175 (41.2)
40–50 250 (58.8)
Education level
≤ 2-year college 155 (36.4)
≥ 4-year university 270 (63.5)
Employment status
Homemaker 191 (44.9)
Working woman 234 (55.1)
No. of children
1 94 (22.1)
2 273 (64.2)
≥ 3 58 (13.6)
Monthly income (10,000 KRW)
≤ 299 36 (8.5)
300–399 75 (17.6)
400–499 110 (25.9)
500–599 90 (21.2)
600–699 54 (12.7)
≥ 700 60 (14.1)
Spouses' participation in the dinner (a week)
0–2 115 (27.1)
3–4 142 (33.4)
5–7 168 (39.5)
Spouse's meal preparation participation
Very low 117 (27.5)
Low 100 (23.5)
Average 106 (24.9)
High 83 (19.5)
Very high 19 (4.5)
Length of marriage (yrs) 12.7 ± 3.5 (scale of 7–30)
Values are presented as mean ± SD or number (%).
Cooking behavior and intention regarding cooking behavior at home
The frequency of cooking behavior at home was 14 times per week on average, which means that 2 meals were prepared at home per day. The frequency of cooking behavior ranged from between 1 to 21 times, and there were women who hardly cooked at home and others who prepared all of their meals at home. Intention regarding cooking behavior at home scored 4.4 points (scale of 1 to 5) on average, and the subjects showed a strong intention to cook at home. Intention regarding cooking behavior and cooking behavior showed a significant positive correlation (P < 0.01, r = 0.33). Subjects' cooking behavior at home and intention are shown in Table 2.
Attitude toward cooking behavior at home and correlation between attitude and cooking behavior
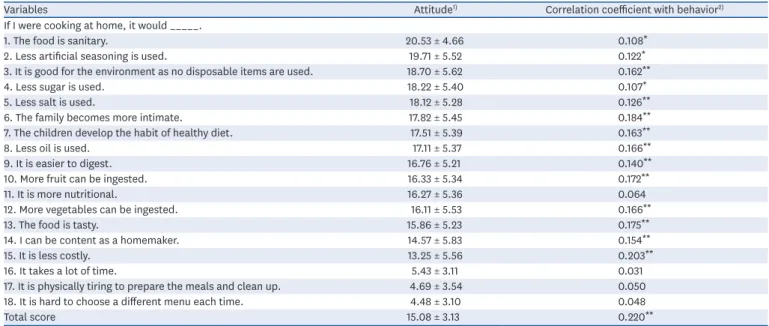
Table 3 displays information on attitude toward cooking behavior at home as well as the correlation between attitude and cooking behavior. The average score for attitude toward cooking behavior at home was 15.1 points (scale of 1 to 25). The response with the highest score for attitude toward cooking behavior was ‘The food is sanitary’ (20.5). Other responses with the next highest scores were: ‘Less artificial seasoning is used’ (19.7), ‘It is good for the environment as no disposable items are used’ (18.7), ‘Less sugar is used’ (18.2), ‘Less salt is used’ (18.1), ‘The family becomes more intimate’ (17.8), ‘The children develop the habit of healthy diet’ (17.5), ‘Less oil is used’ (17.1), ‘It is easier to digest’ (16.8), ‘More fruits can be ingested’ (16.3), ‘It is more nutritional’ (16.3), ‘More vegetables can be ingested’ (16.1), ‘The food is tasty’ (15.9), ‘I can be content as a homemaker’ (14.6), and ‘It is less costly’ (13.3).
Based on these results, the subjects believed that home-cooked meals are positive with regards to food sanitation, environment, proper nutrition, balanced diet, taste, and family intimacy. On the other hand, the responses with the lowest attitude scores scored 5.5 points or lower. In ascending order: ‘It is hard to choose a different menu each time’ (4.5), ‘It is physically tiring to prepare meals and clean up’ (4.7), and ‘It takes a lot of time’ (5.4). These results suggest that subjects struggle with the fact that cooking at home is time-consuming and physically tiring, and it is hard to choose a menu for each meal.
Attitude toward cooking behavior at home and cooking behavior showed a significant positive correlation (P < 0.01, r = 0.22). Therefore, a positive attitude toward cooking behavior was found to lead to cooking behavior. Among the responses on attitude, the one with the highest correlation was ‘It is less costly’ (P < 0.01, r = 0.20). This result suggests that saving meal costs is an important motivating factor leading to cooking at home. The response with the second highest correlation was ‘The family becomes more intimate’ (P <
0.01, r = 0.18). The attitude score was 17.8 points, which was the 6th highest among the 18 questions. This suggests that family intimacy is a more important factor than nutrition or taste when it comes to cooking at home. The responses with the lowest attitude scores—‘It takes a lot of time’, ‘It is physically tiring to prepare meals and clean up’, and ‘It is hard to Table 2. Cooking behavior and intention regarding cooking behavior at home
Variables Values (scale) Correlation coefficient with behavior
3)Cooking behavior at home
1)14.1 ± 4.3 (1–21) -
Intention regarding cooking behavior at home
2)4.39 ± 0.82 (1–5) 0.328 **
Values are presented as mean ± SD.
1)
Cooking behavior at home was measured by the number of meals prepared by the subjects at home for 1 week. A higher score indicates a higher cook behavior.
2)
The intention regarding cooking behavior at home assessed the intention of the subjects to cook at home the next day. The items were measured on a 5-point scale, from 1 ‘not at all’ to 5 ‘very much’. A higher score indicates a higher intention to cook.
3)
Pearson's correlation coefficient.
** P < 0.01.
choose a different menu each time—did not show any significant correlation with cooking behavior’. Subjects that believed that cooking at home is physically tiring and takes too much time as well as presents difficulties in choosing a menu were less likely to cook at home. The response ‘It is nutritional’ showed a relatively high attitude score of 16.3 but also showed no significant correlation with cooking behavior. This result suggests that although the subjects believe that it is nutritional to cook at home, cooking behavior is not affected.
Subjective norm regarding cooking behavior at home and correlation between subjective norm and cooking behavior
The subjective norm regarding cooking behavior at home and its correlation with cooking behavior are shown on Table 4. The average score of the subjective norm was 14.6 points (scale of 1 to 25). The reference group with the highest score of the subjective norm was children with a score of 17.4 points. Therefore, children were the most important reference group for cooking at home, followed by spouses (16.1), parents-in-law (15.3), and parents (15.3). Siblings and friends earned scores of 12.1 and 11.7, respectively, and showed a relatively low influence.
Subjective norm showed a significant correlation with cooking behavior at home (P < 0.01, r = 0.18). Spouses and parents showed the highest correlations with cooking behavior (P < 0.01, r = 0.17, respectively), which suggests the highest influence on cooking behavior at home.
Other groups showing a weak correlation were siblings (P < 0.01, r = 0.17), friends (P < 0.01, r = 0.16), children (P < 0.05, r = 0.11), and parents-in-law (P < 0.05, r = 0.11). In these results, children’s subjective norm showed the highest scores but a low correlation with cooking behavior. Siblings and friends showed subjective norm scores lower than those of children and parents-in-law, but their correlations with cooking behavior were high.
Table 3. Attitude toward cooking behavior at home
Variables Attitude
1)Correlation coefficient with behavior
2)If I were cooking at home, it would _____.
1. The food is sanitary. 20.53 ± 4.66 0.108 *
2. Less artificial seasoning is used. 19.71 ± 5.52 0.122 *
3. It is good for the environment as no disposable items are used. 18.70 ± 5.62 0.162 **
4. Less sugar is used. 18.22 ± 5.40 0.107 *
5. Less salt is used. 18.12 ± 5.28 0.126 **
6. The family becomes more intimate. 17.82 ± 5.45 0.184 **
7. The children develop the habit of healthy diet. 17.51 ± 5.39 0.163 **
8. Less oil is used. 17.11 ± 5.37 0.166 **
9. It is easier to digest. 16.76 ± 5.21 0.140 **
10. More fruit can be ingested. 16.33 ± 5.34 0.172 **
11. It is more nutritional. 16.27 ± 5.36 0.064
12. More vegetables can be ingested. 16.11 ± 5.53 0.166 **
13. The food is tasty. 15.86 ± 5.23 0.175 **
14. I can be content as a homemaker. 14.57 ± 5.83 0.154 **
15. It is less costly. 13.25 ± 5.56 0.203 **
16. It takes a lot of time. 5.43 ± 3.11 0.031
17. It is physically tiring to prepare the meals and clean up. 4.69 ± 3.54 0.050
18. It is hard to choose a different menu each time. 4.48 ± 3.10 0.048
Total score 15.08 ± 3.13 0.220 **
Values are presented as mean ± SD.
1)
The items of behavioral belief and outcome evaluation were measured on a 5-point scale, from 1 ‘not at all’ to 5 ‘very much’ respectively. The score for attitude was calculated by multiplying the score for behavioral belief by the score for the corresponding outcome evaluation (scale 1–25). A higher score indicates a higher attitude toward cooking behavior at home.
2)
Pearson's correlation coefficient.
* P < 0.05, ** P < 0.01.
Control belief toward cooking behavior at home and correlation between control belief and cooking behavior
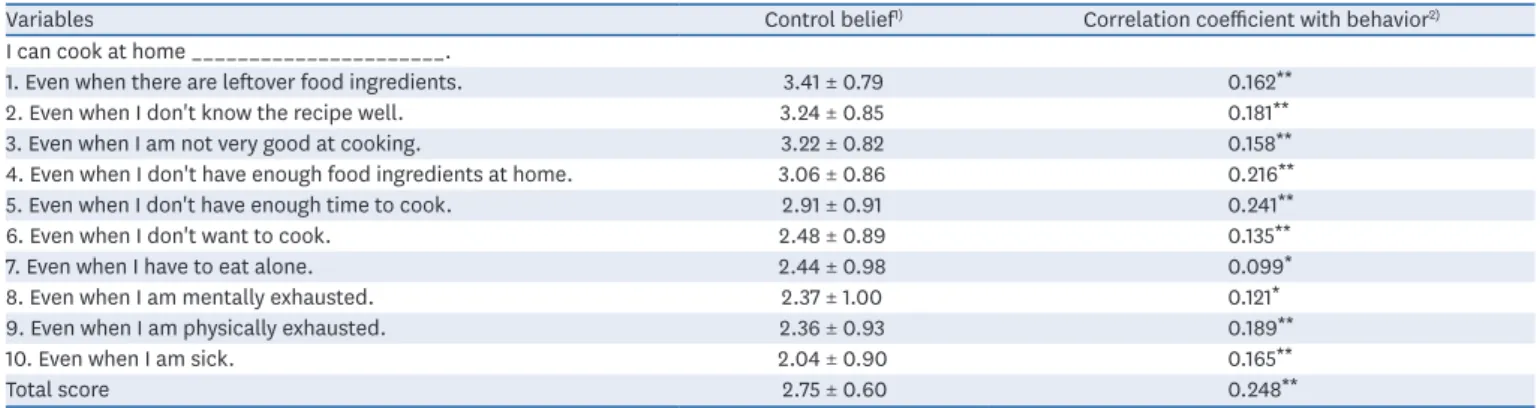
The control belief toward cooking behavior at home and its correlation with cooking behavior are shown in Table 5. The average score of control belief toward cooking behavior at home was 2.8 points (scale of 1 to 5). The response with the highest control belief was ‘I can cook myself even when there are leftover food ingredients’ with a score of 3.4, followed by ‘I can cook myself even when I don't know the recipe well’, ‘I can cook myself even when I am not very good at cooking’, and ‘I can cook myself even when I don't have enough food ingredients at home’. All of these responses scored 3.0 or higher. The response ‘I can cook myself even when I don't have enough time to cook’ scored 2.9 points. The responses ‘I can cook myself even when I don't want to cook’, ‘I can cook myself even when I have to eat alone’, ‘I can cook myself even when I am mentally exhausted’, ‘I can cook myself even when I am physically exhausted’, and ‘I can cook myself even when I am sick’ scored 2.5 points or below in terms of control belief.
The control belief toward cooking behavior at home and cooking behavior showed a significant correlation for all responses (P < 0.01, r = 0.25). The response with the highest correlation was
‘I can cook myself even when I don't have enough time to cook’ (P < 0.01, r = 0.24), followed by
‘I can cook myself even when I don't have enough food ingredients at home’ (P < 0.01, r = 0.22).
Table 4. Subjective norm regarding cooking behavior at home
Variables Subjective norm
1)Correlation coefficient with behavior
2)1. Children 17.36 ± 5.22 0.112 *
2. Husband 16.09 ± 5.12 0.172 **
3. Parents-in-low 15.33 ± 5.22 0.105 *
4. Parents 15.30 ± 5.04 0.172 **
5. Siblings 12.12 ± 4.75 0.166 **
6. Friends 11.65 ± 4.92 0.161 **
Total score 14.64 ± 4.05 0.184 **
Values are presented as mean ± SD.
1)
The items of normative belief and outcome evaluation were measured on a 5-point scale, from 1 ‘not at all’ to 5
‘very much’ respectively. The score for subject norm was calculated by multiplying the score for normative belief by the score for the corresponding motivation to comply (scale 1–25). A higher score indicates a higher subjective norm regarding cooking behavior at home.
2)
Pearson's correlation coefficient.
* P < 0.05, ** P < 0.01.
Table 5. Control belief toward cooking behavior at home
Variables Control belief
1)Correlation coefficient with behavior
2)I can cook at home ______________________.
1. Even when there are leftover food ingredients. 3.41 ± 0.79 0.162 **
2. Even when I don't know the recipe well. 3.24 ± 0.85 0.181 **
3. Even when I am not very good at cooking. 3.22 ± 0.82 0.158 **
4. Even when I don't have enough food ingredients at home. 3.06 ± 0.86 0.216 **
5. Even when I don't have enough time to cook. 2.91 ± 0.91 0.241 **
6. Even when I don't want to cook. 2.48 ± 0.89 0.135 **
7. Even when I have to eat alone. 2.44 ± 0.98 0.099 *
8. Even when I am mentally exhausted. 2.37 ± 1.00 0.121 *
9. Even when I am physically exhausted. 2.36 ± 0.93 0.189 **
10. Even when I am sick. 2.04 ± 0.90 0.165 **
Total score 2.75 ± 0.60 0.248 **
Values are presented as mean ± SD.
1)
The items of control belief were measured on a 5-point scale, from 1 ‘not at all’ to 5 ‘very much’. A higher score indicates a higher control belief toward cooking behavior at home.
2)
Pearson's correlation coefficient.
* P < 0.05, ** P < 0.01.
Considering these results, the subjects believe that lack of time or proper food ingredients is the easiest obstacle to overcome when cooking at home. The items with the lowest correlation, on the other hand, included ‘I can cook myself even when I have to eat alone’ (P < 0.05, r = 0.10) and ‘I can cook myself even when I am mentally exhausted’ (P < 0.05, r = 0.12). These results suggest that the subjects are very unlikely to cook at home when they have to eat alone and when they are mentally exhausted.
Perception of cooking skills at home and correlation between perception of cooking skills and cooking behavior
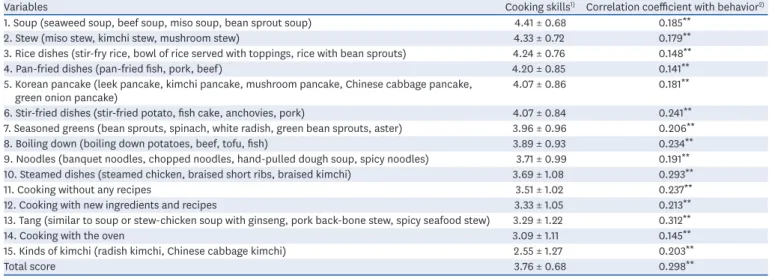
Perception of cooking skills score and its correlation with cooking behavior at home are shown in Table 6. Perception of cooking skills score was 3.8 points (scale of 1 to 5). The most confident cooking skills was based on soups (4.4), followed by stews (4.3), rice dishes (4.2), pan-fried dishes (4.2), Korean pancakes (4.1), and stir-fried dishes (4.1). The subjects were rather confident about their cooking skills. The scores for seasoned greens, boiling down, noodles, steamed dishes, cooking without any recipes, cooking with new ingredients and recipes, tang (similar to soup or stew), and cooking with an oven were between 3.1 and 4.0, which suggests the subjects were very confident. However, the score for Kimchi was 2.6, which was rather low.
Perception of cooking skills showed a significant correlation with all responses related to cooking behavior at home. Perception of cooking skills had the highest correlation with tang (similar to soup or stew) (P < 0.01, r = 0.31), followed by steamed dishes (P < 0.01, r = 0.29) with relatively higher coefficients of correlation. These results suggest that the subjects cook more often when they feel they are good at cooking steamed dishes or tang (similar to soup or stew) comprising main entrées. Perception of cooking skills with the lowest correlation were pan-fried dishes (P < 0.01, r = 0.14), including fish or meat, and dishes prepared in an oven (P < 0.01, r = 0.15). As an explanation, cooking fish or meat at home generates too much odor, and the dishes prepared in an oven are not very familiar in Korean homes.
Table 6. Perception of cooking skills at home
Variables Cooking skills
1)Correlation coefficient with behavior
2)1. Soup (seaweed soup, beef soup, miso soup, bean sprout soup) 4.41 ± 0.68 0.185 **
2. Stew (miso stew, kimchi stew, mushroom stew) 4.33 ± 0.72 0.179 **
3. Rice dishes (stir-fry rice, bowl of rice served with toppings, rice with bean sprouts) 4.24 ± 0.76 0.148 **
4. Pan-fried dishes (pan-fried fish, pork, beef) 4.20 ± 0.85 0.141 **
5. Korean pancake (leek pancake, kimchi pancake, mushroom pancake, Chinese cabbage pancake,
green onion pancake) 4.07 ± 0.86 0.181 **
6. Stir-fried dishes (stir-fried potato, fish cake, anchovies, pork) 4.07 ± 0.84 0.241 **
7. Seasoned greens (bean sprouts, spinach, white radish, green bean sprouts, aster) 3.96 ± 0.96 0.206 **
8. Boiling down (boiling down potatoes, beef, tofu, fish) 3.89 ± 0.93 0.234 **
9. Noodles (banquet noodles, chopped noodles, hand-pulled dough soup, spicy noodles) 3.71 ± 0.99 0.191 **
10. Steamed dishes (steamed chicken, braised short ribs, braised kimchi) 3.69 ± 1.08 0.293 **
11. Cooking without any recipes 3.51 ± 1.02 0.237 **
12. Cooking with new ingredients and recipes 3.33 ± 1.05 0.213 **
13. Tang (similar to soup or stew-chicken soup with ginseng, pork back-bone stew, spicy seafood stew) 3.29 ± 1.22 0.312 **
14. Cooking with the oven 3.09 ± 1.11 0.145 **
15. Kinds of kimchi (radish kimchi, Chinese cabbage kimchi) 2.55 ± 1.27 0.203 **
Total score 3.76 ± 0.68 0.298 **
Values are presented as mean ± SD.
1)
The items of perception of cooking skills were measured on a 5-point scale, from 1 ‘not at all’ to 5 ‘very much’. A higher score indicates a higher perception of cooking skills on at home.
2)
Pearson's correlation coefficient.
** P < 0.01.
Differences in the components of the TPB according to demographic variables Table 7 shows differences in subjects' attitudes toward cooking behavior at home, subjective norm, control belief, perception of cooking skills, intention regarding cooking behavior, and cooking behavior according to general characteristics. The attitude toward cooking behavior at home showed significant differences according to the subjects' level of education, income, spousal participation in the preparation process, and length of marriage. The subjects showed positive attitudes toward cooking behavior at home with a higher level of education, greater income, spousal active participation, and longer marriage.
The subjective norm concerning cooking behavior at home showed a significant difference according to spousal participation in the meal preparation process. The subjective norm score Table 7. Differences in the components of the theory of planned behavior according to demographic variables
Variables Attitude Subjective norm Control belief Cooking skills Behavior intention Behavior
Age (yrs)
35–39 15.00 ± 3.04 14.77 ± 4.14 2.80 ± 0.57 3.71 ± 0.64 4.29 ± 0.90 13.50 ± 4.60
40–50 15.14 ± 3.20 14.55 ± 3.99 2.72 ± 0.61 3.79 ± 0.70 4.46 ± 0.76 14.56 ± 4.10
T-value
1)−0.477 0.543 1.281 −1.166 −2.086 * −2.438 *
Employment status
Homemaker 15.20 ± 3.02 14.90 ± 4.12 2.81 ± 0.60 3.82 ± 0.59 4.61 ± 0.66 16.03 ± 3.16
Working woman 14.99 ± 3.21 14.44 ± 1.33 2.71 ± 0.60 3.70 ± 0.74 4.21 ± 0.90 12.57 ± 4.55
T-value 0.673 1.170 1.702 1.886 5.339 *** 9.231 ***
Education level
≤ 2-year college 14.64 ± 3.24 14.33 ± 3.90 2.76 ± 0.59 3.67 ± 0.75 4.30 ± 0.89 13.85 ± 4.47
≥ 4-year university 15.33 ± 3.04 14.82 ± 4.13 2.75 ± 0.60 3.80 ± 0.63 4.44 ± 0.78 14.28 ± 4.26
T-value −2.207 * −1.225 0.239 −1.566 −1.662 −0.983
No. of children
1 15.18 ± 3.15 13.98 ± 3.97 2.63 ± 0.59 3.53 ± 0.70
a4.33 ± 0.84 12.13 ± 4.39
a2 15.02 ± 3.14 14.88 ± 4.03 2.78 ± 0.59 3.78 ± 0.66
b4.40 ± 0.84 14.85 ± 4.08
b≥ 3 15.22 ± 3.07 14.61 ± 4.20 2.85 ± 0.61 4.00 ± 0.63
b4.47 ± 0.71 13.95 ± 4.49
bF-value
2)0.158 1.752 2.946 9.665 *** 0.501 14.718 ***
Monthly income (10,000 KRW)
≤ 299 14.46 ± 3.54 14.59 ± 4.16 2.83 ± 0.52 3.47 ± 0.78
a4.56 ± 0.74 16.08 ± 3.69
a300–399 14.75 ± 3.11 14.31 ± 4.49 2.72 ± 0.54 3.72 ± 0.60 4.52 ± 0.72 15.17 ± 3.98
400–499 14.95 ± 3.20 14.88 ± 3.78 2.71 ± 0.55 3.77 ± 0.67 4.40 ± 0.85 13.95 ± 4.29
500–599 14.56 ± 2.85
a14.05 ± 3.78 2.62 ± 0.63 3.68 ± 0.67 4.24 ± 0.84 13.20 ± 4.68
b600–699 15.78 ± 3.03 14.89 ± 4.88 2.92 ± 0.67 3.87 ± 0.65 4.46 ± 0.72 13.87 ± 4.14
≥ 700 16.26 ± 2.94
b15.33 ± 3.40 2.89 ± 0.64 3.95 ± 0.70
b4.27 ± 0.97 13.57 ± 4.41
F-value 3.329 ** 0.949 2.656 * 2.926 * 1.598 3.535 **
Spouses' participation in the dinner (a week)
0–2 14.88 ± 3.20 14.20 ± 4.10 2.62 ± 0.58
a3.68 ± 0.72 4.26 ± 0.94 13.32 ± 4.43
a3–4 14.84 ± 3.03 14.58 ± 3.87 2.79 ± 0.59
a3.73 ± 0.66 4.41 ± 0.84 13.99 ± 4.43
5–7 15.43 ± 3.15 15.00 ± 4.15 2.81 ± 0.60
b3.83 ± 0.66 4.46 ± 0.72 14.79 ± 1.11
bF-value 1.706 1.346 3.930 * 1.858 2.147 4.087 *
Spouse's meal preparation participation
Very low 15.08 ± 3.19
a14.20 ± 4.27
a2.61 ± 0.53
a3.71 ± 0.68 4.43 ± 0.83 13.96 ± 4.62
Low 14.62 ± 2.72
a14.13 ± 3.71
a2.67 ± 0.55
a3.69 ± 0.68 4.43 ± 0.71 14.91 ± 4.10
Average 14.46 ± 3.35
a14.52 ± 3.75 2.79 ± 0.60 3.71 ± 0.68 4.26 ± 0.84 13.60 ± 4.24
High 15.86 ± 3.31
a15.40 ± 3.90 2.99 ± 0.69
b3.91 ± 0.66 4.35 ± 0.93 14.08 ± 4.47
Very high 17.63 ± 2.55
b17.47 ± 5.28
b2.86 ± 0.41 4.00 ± 0.59 4.84 ± 0.50 14.11 ± 3.56
F-value 6.355 *** 3.917 ** 5.942 *** 2.219 2.249 1.250
Length of marriage (yrs)
7–12 14.80 ± 2.99 14.51 ± 3.80 2.73 ± 0.59 3.64 ± 0.66 4.29 ± 0.89 13.60 ± 4.58
13–30 15.41 ± 3.26 14.80 ± 4.33 2.78 ± 0.60 3.89 ± 0.68 4.51 ± 0.73 14.74 ± 3.97
T-value −2.029 * −0.729 −0.783 −3.807 *** −2.714 ** −2.755 **
Values are presented as mean ± SD. Different characters in the same column mean significant differences.
1)
T-value by t-test.
2)
F-value by ANOVA.
* P < 0.05, ** P < 0.01, *** P < 0.001.
of the group with a ‘very high’ spousal participation rate in the meal preparation process was also very high compared to the other group. This means that spousal participation rate in the meal preparation process has a great influence on the subjective norm.
The control belief pertaining to cooking behavior at home varied according to income, spousal participation in dinner, and spousal participation in the meal preparation process.
Subjects that were more likely to overcome factors obstructing cooking behavior also had a higher income, more frequent spousal participation in dinner, and more frequent spousal participation in the meal preparation process.
Perception of cooking skills showed significant differences according to the number of children, income, and length of marriage. The subjects that were more confident about cooking skills also had more children, a higher income, and a longer marriage. Generally, homemakers cook more often when they have more children or have been married for a longer period. In terms of income, a greater income leads to higher interest in cooking.
Intention regarding cooking behavior varied according to age, employment status, and length of marriage. Subjects' intention regarding cooking behavior increased with older age, position as a full-time homemaker, and a longer marriage.
Cooking behavior showed significant differences according to age, employment status, number of children, income, spousal participation in dinner, and length of marriage.
The actual frequency of cooking behavior increased with older age, position as a full-time homemaker, more children, more frequent spousal participation in dinner, and a longer marriage. In the case of employment status, homemaker’s cooking behavior was higher than that of working women. In the case of income, increased cooking behavior was associated with a lower income, suggesting that subjects cook more often at home when there are financial issues.
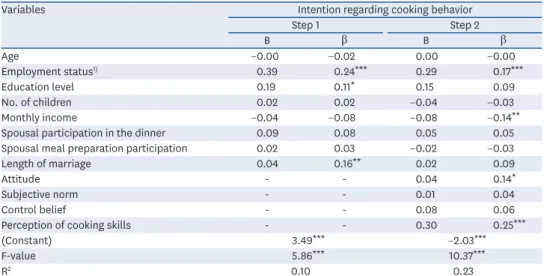
Factors explaining intention regarding cooking behavior at home
In order to discuss how the factors of the TPB (attitude, subjective norm, and control belief ) and perception of cooking skills affect intention regarding cooking behavior, hierarchical analysis was conducted by using the general characteristics entered as control variables.
Employment status was converted into a dummy variable, and homemaker was set as the standard variable. Table 8 shows the results.
As a result of entering the general characteristics as the only independent variables in the
first stage, employment status (P < 0.001), level of education (P < 0.05), and length of
marriage (P < 0.01) had significant effects on intention regarding cooking behavior. These
variables explain the intention regarding cooking behavior at a rate of 10%. A higher intention
regarding cooking behavior was associated with the position of homemaker, a higher level
of education, and a longer marriage. In the second stage, the factors of the TPB (attitude,
subjective norm, and control belief ) and perception of cooking skills were added as the
independent variables. As a result, employment status (P < 0.001), income (P < 0.01), attitude
(P < 0.05), and perception of cooking skills (P < 0.001) appeared to be influential, whereas the
level of education showed no effect. These variables explain the intention of cooking behavior
at a rate of 23%. As a result, intention regarding cooking behavior increased with the position
of homemaker, a more positive attitude, and greater confidence in cooking skills. Intention
regarding cooking behavior was greater with a lower income. As an explanation, intention
regarding cooking behavior at home generally increases with a lower income due to concerns over saving money. The relative influence on intention regarding cooking behavior was highest for perception of cooking skills (β = 0.25), followed by employment status (β = 0.17), attitude (β = 0.14), and income (β = −0.14).
Factors explaining cooking behavior at home
In order to discuss how the factors of the TPB (attitude, subjective norm, control belief, and behavioral intention) and perception of cooking skills influence cooking behavior, hierarchical analysis was conducted by using the general characteristics entered as controlled variables. The results are shown in Table 9.
As a result of entering the general characteristics as the only independent variables in the first stage, employment status (P < 0.001), number of children (P < 0.01), income (P < 0.05), Table 8. Factors explaining intention regarding cooking behavior at home
Variables Intention regarding cooking behavior
Step 1 Step 2
B β B β
Age −0.00 −0.02 0.00 −0.00
Employment status
1)0.39 0.24 *** 0.29 0.17 ***
Education level 0.19 0.11 * 0.15 0.09
No. of children 0.02 0.02 −0.04 −0.03
Monthly income −0.04 −0.08 −0.08 −0.14 **
Spousal participation in the dinner 0.09 0.08 0.05 0.05
Spousal meal preparation participation 0.02 0.03 −0.02 −0.03
Length of marriage 0.04 0.16 ** 0.02 0.09
Attitude - - 0.04 0.14 *
Subjective norm - - 0.01 0.04
Control belief - - 0.08 0.06
Perception of cooking skills - - 0.30 0.25 ***
(Constant) 3.49 *** −2.03 ***
F-value 5.86 *** 10.37 ***
R
20.10 0.23
1)
The employment status was converted into a dummy variable, and homemaker was set as the standard variable.
* P < 0.05, ** P < 0.01, *** P < 0.001.
Table 9. Factors explaining cooking behavior at home
Variables Cooking behavior
Step 1 Step 2
B β B β
Age 0.10 0.08 0.12 0.09
Employment status
1)3.29 0.38 *** 2.67 0.31 ***
Education level 0.72 0.08 0.55 0.06
No. of children 1.11 0.15 ** 0.91 0.12 **
Monthly income −0.31 −0.11 * −0.41 −0.14 **
Spousal participation in the dinner 0.61 0.11 * 0.43 0.08
Spousal meal preparation participation 0.11 0.03 −0.07 −0.02
Length of marriage 0.07 0.06 −0.00 −0.00
Attitude - - 0.14 0.10
Subjective norm - - −0.00 −0.00
Control belief - - 0.93 0.13 **
Perception of cooking skills - - 0.66 0.10
Intention of cooking behavior - - 0.64 0.11 *
(Constant) 3.99 −3.62
F-value 15.07 *** 14.32 ***
R
20.23 0.31
1)