코크스가스의 탄소배출계수 개발 및 불확도 평가
조승현
*
・ 노준영**
・ 강성민***
・ 전의찬****†
*
세종대학교 기후변화협동과정 박사과정 학생,**
세종대학교 기후에너지융합학과 박사과정 학생,***
세종대학교 기후환경융합센터 선임연구원,****
세종대학교 기후환경융합학과 교수Development of the Coke Oven Gas Carbon Emission Factor and Calculation of Uncertainty
Jo, Seunghyun
*
, Roh, Joon Young**
, Kang, Sung Min***
and Jeon, Eui-chan**** †
* Ph.D. student, Cooperate Course for Climate Change, Sejong University, Seoul, Korea
** Ph.D. student, Department of Climate and Environment, Sejong University, Seoul, Korea
*** Senior Researcher, Department of Climate and Environment Research Center, Sejong University, Seoul, Korea
**** Professor, Dept. of Climate and Environment, Sejong University, Seoul, Korea
ABSTRACT
At the 24th Conference of the Parties (COP) detailed implementation of the transparency system under the Paris Agreement was established. Accordingly, the United Nations Framework Convention on Climate Change change (UNFCCC) national greenhouse gas statistics calculation method from 1996 IPCC G/L to 2006 IPCC G/L, and from 2024, Korea also needs to report the inventory applied with 2006 IPCC G/L. Following entry into the Paris Agreement, Korea established an implementation plan to lay the groundwork for early application of the 2006 IPCC G/L.
According to the National Greenhouse Gas Statistics Management Plan (Cooperation of related agencies, 2020) the first plan (2015 ~ 2020) included improving the reliability of the national greenhouse gas inventory system and characterizing domestic emissions by expanding the national emission coefficient as well as preparing for application. The second plan (2020
~ 2024) included expanding the scope of statistics on greenhouse gas emissions and improving the method of statistics calculation.
According to Article 25 of the Enforcement Decree of the Framework Act on Low Carbon, Green Growth, the goal was to reduce total national greenhouse gas emissions based on 2017 data by 24.4%. Of the total greenhouse gas emissions of 709.1 million tons of CO
2
eq in 2017, 173 million tons of CO2
eq should thus eliminated. As of 2017, Korea's energy sector's greenhouse gas emissions amounted to 615.8 million tons of CO2
eq, up 156% from approximately 240.4 million tons of CO2
eq in 1990. Greenhouse gas emissions from the energy sector accounted for 86.8% of Korea's greenhouse gas emissions in 2017.In order to apply the 2006 IPCC G/L to the domestic energy sector inventory, all energy sources must be considered.
Among sources not previously quantified, by-product gases (Coke Oven Gas, blast furnace gas, linze donawitz gas) are generated from steel production and are recycled as energy sources in power generation and processes.
In this study, the carbon emission factor for coke oven gas (COG), which was not included in the current national energy balance for the 2006 IPCC G/L, was calculated and compared with the IPCC default emission factor to confirm the necessity of developing the carbon emission factor. In addition, the uncertainty was calculated to confirm the reliability of the carbon emission factor.
Key words: COG, Greenhouse Gases, Emission Factor, Uncertainty
†Corresponding author : [email protected] (05006, 209, Neungdong-ro, Gwangjin-gu, Seoul, Republic of Korea. Tel. +82-2-3408-4353)
ORCID 조승현 0000-0001-9004-9948 노준영 0000-0002-3066-3230
강성민 0000-0001-8628-8241 전의찬 0000-0003-2783-4550
Received: December 14, 2020 / Revised: January 13, 2021 1st, March 10, 2021 2nd / Accepted: March 31, 2021
1. 서론
제24차 유엔기후변화협약 당사국총회(COP: Conference of the Parties)에서는 파리협정에 따른 투명성체계 세부이 행지침(rule book)이 확정되었다. 이에 따라 UNFCCC는 국가 온실가스 통계 산정방법을 기존 1996 IPCC(Intergovermental Panel on Climate Change) G/L에서 2006 IPCC G/L으로 변경 하였고, 2024년부터는 우리나라도 2006 IPCC G/L을 적용한 인벤토리를 보고해야 한다. 우리나라는 파리협정 발효에 따라 2006 IPCC G/L의 조기 적용 기반을 마련하기 위한 이행계획을 수립하였다.
『국가 온실가스 통계 총괄관리계획』(관계기관 합동, 2020)에 따르면, 제1차 계획(2015~2019년)에는 국가 온실 가스 인벤토리 체계 및 작성의 신뢰도 개선, 국가고유배출 계수 확대를 통한 국내 배출원의 특성 반영, 파리협정 준 수를 위한 2006 IPCC G/L 지침 조기적용 기반 마련이 포 함되었다. 제2차 계획(2020 ~ 2024년)에는 온실가스 배출 량의 통계 산정범위 확대와 통계 산정방법 개선 등이 포함 되어 있다.
저탄소녹색성장기본법 시행령 제25조(2019년 12월 31 일 개정)에 따라 온실가스 감축목표는 2030년 국가 온실 가스 총배출량을 2017년 온실가스 총배출량의 24.4%만큼 을 감축하는 것이다. 2017년 온실가스 총배출량 709.1백 만톤 CO
2
eq 중에서 173백만톤 CO2
eq을 감축해야 한다.2017년 기준 우리나라 에너지분야 온실가스 배출량은 615.8백만톤 CO
2
eq이며, 1990년 약 240.4백만톤 CO2
eq에 서 약 156% 증가하였다. 2017년 에너지분야 온실가스 배출량은 우리나라 온실가스 배출량의 86.8%를 차지하고 있 고 지속적으로 증가하는 추세이다.
국내 에너지분야 인벤토리에서 2006 IPCC G/L을 적용 하기 위해서는 고려되지 않은 에너지원들(부생가스, 갈탄, 토탄 등)을 추가해야 한다. 이 중 부생가스(COG, BFG, LDG)는 철강생산에서 발생하며 발전 및 공정 내 에너지 원으로 재활용하고 있다.
본 연구에서는 2006 IPCC G/L 중 현행 국가에너지밸런 스에서 누락되어 있는 코크스가스(COG)를 대상으로 탄소 배출계수를 산정하여 배출수준을 확인하고, IPCC 기본 배 출계수와 비교하여 탄소배출계수 개발 필요성 여부를 확 인하고자 한다. 또한 탄소배출계수의 신뢰성을 확인하기 위해 불확도를 산정하고자 한다.
2. 연구 방법
2.1 코크스가스 분석방법
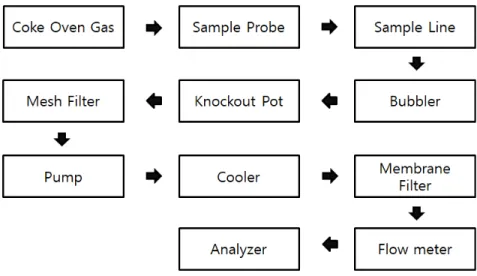
코크스가스 분석은 Fig. 1에서 보는 바와 같이 진행하였 다. 코크스가스는 샘플 프로브를 통해 샘플 라인을 거쳐 전 처리(수분, 먼지제거) 후 분석기로 샘플이 전달된다. 수분 과 먼지제거를 위해 Bubbler에서 Membrane Filter의 전처 리를 거쳐 분석기를 통해 코크스가스의 조성과 발열량이 분석되었다. Analyzer는 산업용 가스분석기(MAX300-IG, USA)로 ISO 6976 규격에 맞추어 제작되었다. 본 연구는 Fig. 1과 같은 절차를 거쳐 분석된 자료를 사업장으로부터 받아서 탄소배출계수를 산정하는 데 사용하였다.
Fig. 1. Analysis process of coke oven gas
2.2 코크스가스 분석자료 수집 및 탄소배출계수 산정
코크스가스의 분석자료는 부생가스를 사용하는 철강업 체 2곳 중 1곳을 대상으로 하였고, 2018년 1월부터 12월 까지 코크스가스의 조성, 밀도, 총발열량, 순발열량 등을 수집하였다.코크스가스의 탄소배출계수 산정은 식 (1)에서 보는 바 와 같고, 코크스가스의 탄소 몰질량과 순발열량을 고려하 여 산정하였고, 코크스가스의 탄소배출계수 개발에 필요 한 순발열량, 밀도, 가스성분의 몰 질량은 대상사업장의 측정자료를 사용하였다.
×
×
×
(1)EF
i
: 연료 i의 탄소배출계수(kgC/GJ) VRy
: 조성별 부피비(m3
/m3
-연료) MWy
: 성분별 탄소의 몰 질량(kg/kmol) V : 표준상태에서 1 kmol이 갖는 부피(22.4 m3
) ECi
: 연료 i의 순발열량(MJ/Nm3
-연료)2.3 불확도 산정 방법
본 연구는 코크스가스의 탄소배출계수 불확도를 산정 하기 위하여 몬테카를로 시뮬레이션을 사용하였다. 2006 IPCC 가이드라인에 의하면 몬테카를로 시뮬레이션 분석 은 개별적인 확률밀도함수로부터 배출계수의 난수를 선 택하고 난수에 대응하는 배출계수를 계산하는 것이라고 소개하고 있다. 몬테카를로 시뮬레이션의 결과는 전문가 판단을 고려하여 입력한 자료에 의해 계산이 되기 때문에 정상적인 방법론으로 타당하다고 보고 있다.
몬테카를로 시뮬레이션은 난수를 생성하여 확률밀도함 수를 통해 불확도를 평가할 수 있는 방법으로 대상 자료 의 불확도를 4단계로 분석한다.
1단계: 모델 선정하는 단계로 탄소배출계수 산정 work-sheet를 구성함.
2단계: 순발열량, 밀도 등 입력변수의 확률밀도함수를 적합성 검정함.
3단계: Crystall ball을 이용한 무작위 샘플링 시뮬레이 션 수행(10,000회)
4단계: 95% 신뢰구간의 배출계수를 산정함.
3. 연구 결과
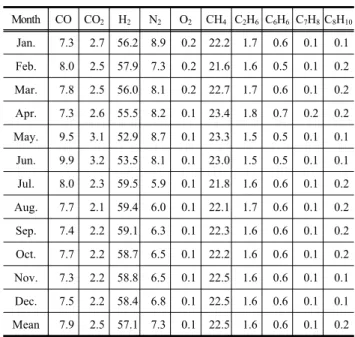
3.1 코크스가스의 조성
코크스가스의 분석자료는 부생가스를 사용하는 철강업 체 2곳 중 1곳을 대상으로 하였고, 2018년 1월부터 12월 까지의 월평균 측정값을 사용하였다. 코크스가스의 조성 은 아래와 같다(Table 1 참조). 코크스가스의 조성은 H
2
가 57.1%로 가장 높았고 CH4
(22.5%), CO(7.9%), N2
(7.3%) 순으로 나타났다. 탄소배출계수 산정에는 코크스가스 조 성 중 탄소계열의 가스를 사용하였다.3.2 코크스가스의 순발열량
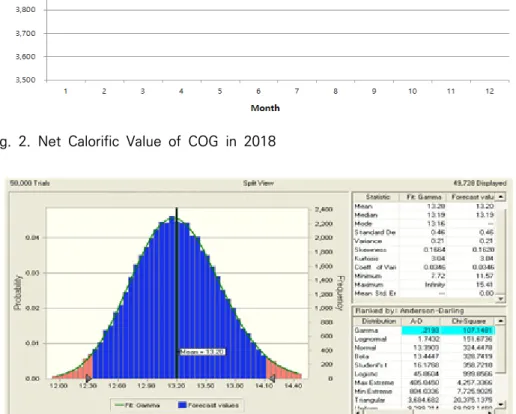
코크스가스의 순발열량 값은 2018년 1월부터 12월까지의 월평균 측정값을 사용하였고, 발열량은 ISO 6976 규격에 따 라 측정하였다. 월별 순발열량은 다음과 같다(Fig. 2 참조).
1월부터 12월까지 순발열량은 3,977 ~ 4,102 kcal/Nm
3
범위 로 평균 4,038 kcal/Nm3
, 표준편차 37.6 kcal/Nm3
로 나타났 다.Month CO CO 2 H 2 N 2 O 2 CH 4 C 2 H 6 C 6 H 6 C 7 H 8 C 8 H 10
Jan. 7.3 2.7 56.2 8.9 0.2 22.2 1.7 0.6 0.1 0.1 Feb. 8.0 2.5 57.9 7.3 0.2 21.6 1.6 0.5 0.1 0.2 Mar. 7.8 2.5 56.0 8.1 0.2 22.7 1.7 0.6 0.1 0.2 Apr. 7.3 2.6 55.5 8.2 0.1 23.4 1.8 0.7 0.2 0.2 May. 9.5 3.1 52.9 8.7 0.1 23.3 1.5 0.5 0.1 0.1 Jun. 9.9 3.2 53.5 8.1 0.1 23.0 1.5 0.5 0.1 0.1 Jul. 8.0 2.3 59.5 5.9 0.1 21.8 1.6 0.6 0.1 0.2 Aug. 7.7 2.1 59.4 6.0 0.1 22.1 1.7 0.6 0.1 0.2 Sep. 7.4 2.2 59.1 6.3 0.1 22.3 1.6 0.6 0.1 0.2 Oct. 7.7 2.2 58.7 6.5 0.1 22.2 1.6 0.6 0.1 0.2 Nov. 7.3 2.2 58.8 6.5 0.1 22.5 1.6 0.6 0.1 0.1 Dec. 7.5 2.2 58.4 6.8 0.1 22.5 1.6 0.6 0.1 0.1 Mean 7.9 2.5 57.1 7.3 0.1 22.5 1.6 0.6 0.1 0.2
Table 1. Composition of COG in 2018
3.3 코크스가스의 탄소배출계수 산정 결과
본 연구에서 산정한 코크스가스의 탄소배출계수는 앞 서 제시한 식 (1)에 따라 산정하였으며 생산량 기준으로 가중평균 하였다. 배출계수 산정 결과 보는 바와 같이 12.3 kgC/GJ로 나타났다(Table 2 참조). 본 연구에서 산정 한 배출계수 결과는 2006 IPCC G/L 탄소배출계수와 비교 하여 5.3% 낮은 수준으로 나타났다. 이러한 차이를 보아 국가특성을 반영할 필요가 있는 것으로 판단된다.
Fig. 2. Net Calorific Value of COG in 2018
Classification
Carbon Emission Factor
of COG (2018)(A)
2006 IPCC G/L(B)
Rate of Change(%) *
COG 12.3 13.0 5.3
* Rate of Change (%): ((A-B)/B)*100
Table 2. Comparison of COG Carbon Emission Factor and 2006 IPCC G/L carbon emission factor (unit: kgC/GJ)
Fig. 3. Uncertainty in COG carbon emission factor
3.4 COG 탄소배출계수의 불확도 분석 결과
불확도 산정은 2006 IPCC G/L 1권 일반 지침 및 보고 의 제시된 산정 절차에 따라 몬테카를로 시뮬레이션 프로 그램(Crystal ball)을 사용하였다. 산정된 코크스가스 탄소 배출계수의 불확도는 Gamma 분포로 밝혀졌으며, 탄소배 출계수의 중앙값은 13.2 kgC/GJ, 하위 2.5%의 탄소배출계수 는 12.3 kgC/GJ, 상위 97.5%의 탄소배출계수는 14.1 kgC/GJ 로 나타났다(Fig. 3 참조). 또, COG 탄소배출계수의 불확도 범위는 95% 신뢰수준에서 –6.5% ~ +7.0%로 산정되었고, 2006 IPCC G/L 에너지 분야 기본 배출계수의 불확도 범위 인 ±7%와 유사한 수준으로 나타났다.
4. 결론
국가 온실가스 통계 산정방법이 기존 1996 IPCC G/L 에서 2006 IPCC G/L으로 변경되며, 2024년부터 2006 IPCC G/L을 적용한 인벤토리를 보고해야 한다. 우리나라 는 파리협정 발효에 따라 2006 IPCC G/L의 조기 적용 기 반을 마련하기 위한 이행계획을 수립하였고, 현행 국가에 너지밸런스를 2006 IPCC G/L의 연료체계를 기준으로 하 여 누락되어 있는 에너지원을 고려해야한다.
최근 철강생산업종에서 발생되는 부생가스는 온실가스 저감수단으로 활용하고 있고, 부생가스 연소에서는 CO2 배출이 이루어질 수 있다. 현재 부생가스 연료 사용에 따 른 온실가스 배출과 관련된 연구는 미비한 수준이며, 현 재 국가에너지밸런스에도 누락되어 있는 상황이다. 따라 서, 본 연구에서는 2006 IPCC G/L의 연료체계에 포함되 어 있는 부생가스 중 코크스가스의 탄소배출계수와 배출 계수에 관련된 불확도를 산정하였다.
코크스가스의 조성은 H
2
가 57.1%로 가장 높았고 CH4
(22.5%), CO(7.9%), N2
(7.3%) 순으로 나타났다. 순발열 량은 3,977 ~ 4,102 kcal/Nm3
범위로 평균은 4,038 kcal/Nm3
으로 나타났다. 본 연구에서 개발된 코크스가스의 탄소배출 계수는 12.3 kgC/GJ로 2006 IPCC G/L 탄소배출계수와 비 교하여 5.3% 낮게 나타났다.개발된 코크스가스 탄소배출계수의 불확도는 몬테카를 로 시뮬레이션 프로그램(Crystal ball)을 이용하여 분석하 였다. 분석결과, 불확도 범위는 95% 신뢰수준에서 –6.5%
~ +7.5%로 나타났으며, 본 연구에서 산정된 코크스가스 탄소배출계수의 불확도를 2006 IPCC G/L 온실가스 배출 계수의 불확도 범위와 비교해 볼 때 2006 IPCC G/L 에너
지분야의 기본 배출계수에 대한 불확도 범위인 ±7%와 비 슷한 수준으로 나타났다.
본 연구 결과에 따르면, 코크스가스의 탄소배출계수는 2006 IPCC G/L의 기본값과 약 5% 정도 차이를 보였고, 불확도는 비슷한 수준으로 나타났다. 국내 특성을 반영하 는 배출계수 산정이 필요할 것으로 판단되고, 향후 많은 시설 및 다른 부생가스 연료 대상으로 탄소배출계수를 개 발할 필요성이 있으며, 부생가스 사용과 관련된 통계자료 의 구축이 필요할 것으로 판단된다.
사사
본 연구는 환경부 “기후변화특성화대학원사업”의 지원 으로 수행되었습니다.
References
Federal Environment Agency. 2019. National Inventory Report for the German Greenhouse Gas Inventory 2019-CRF data. German: Federal Environment Agency.
National report.
Greenhouse Gas Inventory and Research Center(GIR).
2018. National greenhouse gas inventory report of Korea. Seoul. Korea: Greenhouse Gas Inventory and Research Center. National report.
Intergovernmental Panel on Climate Change(IPCC). 2007.
2006 IPCC Guidelines for National Greenhouse Gas Inventories. Geneva, Swiss; Intergovernmental Panel on Climate Change.
Istituto Superiore per la Protezione e la Ricerca Ambientale. 2019. Italian Greenhouse Gas Inventory 1990-2018 National Inventory Report 2018-CRF data.
Italian.
National Institute for Environmental Studies. 2019.
NationalGreenhouse Gas Inventory Report of Japan 2019-CRF data. Japan: National Institute for Environmental Studies. National report.
Jung SY, 2018, Demonstration of high value-added chemical product production technology and evaluation of greenhouse gas reduction through industrial by-product gas separation, purification, and chemical
conversion, INFORMATION FOR CHEMICAL ENGINEERS, Vol. 36, No. 2, pp. 170
Kim JH, 2018, CO separation and recovery technology in steel by-product gas, NEWS & INFORMATION FOR CHEMICAL ENGINEERS, Vol. 36, No. 2, pp.171~174
Goverment of Republic of Korea, 2019, Article 25 of the Enforcement Decree of the Framework Act on Low Carbon, Green Growth.
Joint agencies, 2020, 『National Greenhouse Gas Statistics Comprehensive Management Plan』
UNFCCC, 2019, The Katowice Rulebook–main principles of the document;[accessed 2019 May 06], https://cop24.gov.pl/news/news-details/news/the-katowice- rulebook-main-principles-of-the-document/